



Expanding time-temperature chronometry for arc magmas with MgO diffusion in hydrous melts
Affiliations | Corresponding Author | Cite as | Funding information
Published by the European Association of Geochemistry
under Creative Commons License CC BY-NC-ND 4.0
Keywords: experimental MgO diffusion, diffusion chronometry, hydrous silicate melts


- Share this article


-
Article views:1,366Cumulative count of HTML views and PDF downloads.
- Download Citation
- Rights & Permissions

top
Abstract

Figures
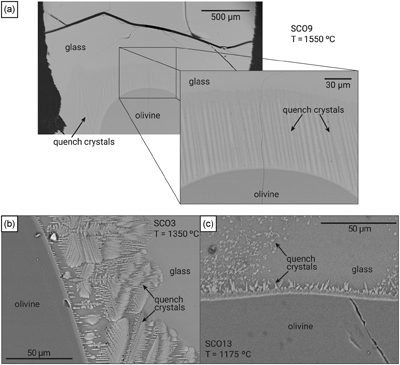 Figure 1 Examples of experiment textures. Decompression cracks are present in all experiments. Quench crystals are largest in high temperature experiments. (a) BSE image of SCO9 at 1550 °C. Zoomed in panel shows crystals at the olivine melt interface that formed upon quench. (b) BSE image of SCO3 at 1350 °C illustrating dendritic quench crystals near the interface. (c) BSE image of SCO13 at 1175 °C showing clusters of smaller quench crystals near the interface. | 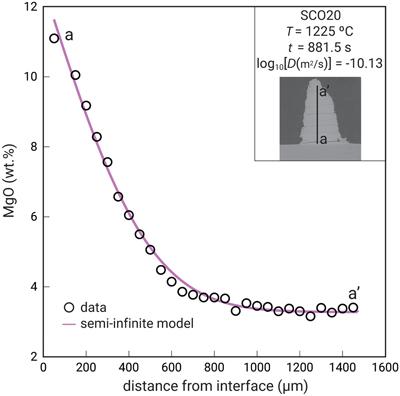 Figure 2 Diffusion profile and best fit. Measured MgO concentrations are shown as black circles. Coloured line corresponds to the semi-infinite model. Inset: BSE image for SCO20; black line shows location and direction (a to a′) of one of three traverses on this sample. | 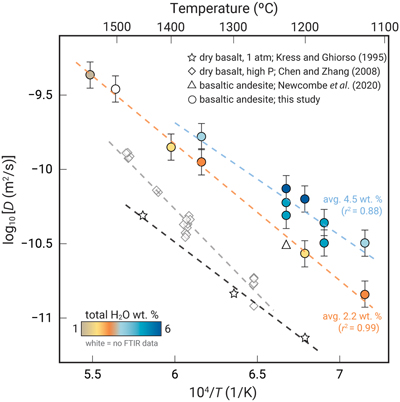 Figure 3 DMgO as a function of T at ∼2.2 and ∼4.5 wt. % water at 1 GPa, compared to DMgO in dry basalt at 1 atm (Kress and Ghiorso, 1995), dry MORB at 0.47–1.42 GPa (Chen and Zhang, 2008), and a hydrous DMgO data point (Newcombe et al., 2020). Colour gradient shows measured water via FTIR. | 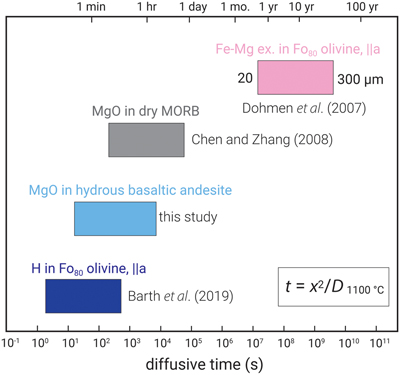 Figure 4 Timescales recorded by diffusion chronometers for mafic arc systems including Fe-Mg exchange in Fo80 (Dohmen et al., 2007), MgO in dry MORB (Chen and Zhang, 2008), DMgO in hydrous basaltic andesite (this study, covering diffusivities at 2.2 and 4.5 wt. % H2O), and H in Fo80 olivine (Barth et al., 2019). Timescales were modelled using inset equation with x = 20–300 μm and D was calculated at 1100 °C. |
| Figure 1 | Figure 2 | Figure 3 | Figure 4 |
top
Introduction
Quantifying the syn-eruptive pressure-temperature-time pathways of magmas is critical for understanding the magmatic drivers of eruption intensity and behaviour. Melt inclusions (MIs) are useful to directly access magmatic conditions at the time of entrapment; however, post-entrapment crystallisation processes may complicate the reconstruction of initial melt compositions and volatile contents (e.g., Danyushevsky et al., 2000
Danyushevsky, L.V., Della-Pasqua, F.N., Sokolov, S. (2000) Re-equilibration of melt inclusions trapped by magnesian olivine phenocrysts from subduction-related magmas: petrological implications. Contributions to Mineralogy and Petrology 138, 68–83. https://doi.org/10.1007/PL00007664
; Gaetani and Watson, 2000Gaetani, G.A., Watson, E.B. (2000) Open system behavior of olivine-hosted melt inclusions. Earth and Planetary Science Letters 183, 27–41. https://doi.org/10.1016/S0012-821X(00)00260-0
). Previous studies have addressed this by applying bulk corrections under the assumption of chemical homogeneity (e.g., Danyushevsky et al., 2000Danyushevsky, L.V., Della-Pasqua, F.N., Sokolov, S. (2000) Re-equilibration of melt inclusions trapped by magnesian olivine phenocrysts from subduction-related magmas: petrological implications. Contributions to Mineralogy and Petrology 138, 68–83. https://doi.org/10.1007/PL00007664
; Gaetani and Watson, 2000Gaetani, G.A., Watson, E.B. (2000) Open system behavior of olivine-hosted melt inclusions. Earth and Planetary Science Letters 183, 27–41. https://doi.org/10.1016/S0012-821X(00)00260-0
) but are limited in resolving internal compositional gradients. In contrast, chemical zonation profiles in olivine hosted MIs provide practical advantages to study the systematics of various magmatic settings on Earth (e.g., Watson and Baker, 1991Watson, E.B., Baker, D.R. (1991) Chemical Diffusion in Magmas: An Overview of Experimental Results and Geochemical Applications. In: Perchuk, L.L., Kushiro, I. (Eds.) Physical Chemistry of Magmas. Springer, New York, 120–151. https://doi.org/10.1007/978-1-4612-3128-8_4
; Costa and Chakraborty, 2004Costa, F., Chakraborty, S. (2004) Decadal time gaps between mafic intrusion and silicic eruption obtained from chemical zoning patterns in olivine. Earth and Planetary Science Letters 227, 517–530. https://doi.org/10.1016/j.epsl.2004.08.011
; Newcombe et al., 2014Newcombe, M.E., Fabbrizio, A., Zhang, Y., Ma, C., Le Voyer, M., Guan, Y., Eiler, J.M., Saal, A.E., Stolper, E.M. (2014) Chemical zonation in olivine-hosted melt inclusions. Contributions to Mineralogy and Petrology 168, 1030. https://doi.org/10.1007/s00410-014-1030-6
, 2020Newcombe, M.E., Plank, T., Zhang, Y., Holycross, M., Barth, A., Lloyd, A.S., Ferguson, D., Houghton, B.F., Hauri, E. (2020) Magma Pressure-Temperature-Time Paths During Mafic Explosive Eruptions. Frontiers in Earth Science 8, 531911. https://doi.org/10.3389/feart.2020.531911
; Costa et al., 2020Costa, F., Shea, T., Ubide, T. (2020) Diffusion chronometry and the timescales of magmatic processes. Nature Reviews Earth & Environment 1, 201–214. https://doi.org/10.1038/s43017-020-0038-x
; Wallace et al., 2021Wallace, P.J., Plank, T., Bodnar, R.J., Gaetani, G.A., Shea, T. (2021) Olivine-Hosted Melt Inclusions: A Microscopic Perspective on a Complex Magmatic World. Annual Review of Earth and Planetary Sciences 49, 465–494. https://doi.org/10.1146/annurev-earth-082420-060506
) and Mars (e.g., Saper and Stolper, 2020Saper, L.M., Stolper, E.M. (2020) Controlled Cooling‐Rate Experiments on Olivine‐Hosted Melt Inclusions: Chemical Diffusion and Quantification of Eruptive Cooling Rates on Hawaii and Mars. Geochemistry, Geophysics, Geosystems 21, e2019GC008772. https://doi.org/10.1029/2019GC008772
) because they record the diffusion of MgO in the silicate melt during post-entrapment crystallisation of olivine on MIs walls. The resulting concentration gradients can be leveraged as a powerful chronometer for quantifying the timescales of magma ascent and other relatively rapid volcanic processes (e.g., Newcombe et al., 2014Newcombe, M.E., Fabbrizio, A., Zhang, Y., Ma, C., Le Voyer, M., Guan, Y., Eiler, J.M., Saal, A.E., Stolper, E.M. (2014) Chemical zonation in olivine-hosted melt inclusions. Contributions to Mineralogy and Petrology 168, 1030. https://doi.org/10.1007/s00410-014-1030-6
, 2020Newcombe, M.E., Plank, T., Zhang, Y., Holycross, M., Barth, A., Lloyd, A.S., Ferguson, D., Houghton, B.F., Hauri, E. (2020) Magma Pressure-Temperature-Time Paths During Mafic Explosive Eruptions. Frontiers in Earth Science 8, 531911. https://doi.org/10.3389/feart.2020.531911
; Saper and Stolper, 2020Saper, L.M., Stolper, E.M. (2020) Controlled Cooling‐Rate Experiments on Olivine‐Hosted Melt Inclusions: Chemical Diffusion and Quantification of Eruptive Cooling Rates on Hawaii and Mars. Geochemistry, Geophysics, Geosystems 21, e2019GC008772. https://doi.org/10.1029/2019GC008772
). Calibrating MgO diffusion provides a unique opportunity to expand the chronometry recorded by Fe-Mg exchange (Dohmen et al., 2007Dohmen, R., Becker, H.-W., Chakraborty, S. (2007) Fe–Mg diffusion in olivine I: experimental determination between 700 and 1,200°C as a function of composition, crystal orientation and oxygen fugacity. Physics and Chemistry of Minerals 34, 389–407. https://doi.org/10.1007/s00269-007-0157-7
) and H+ diffusion in olivine (Barth et al., 2019Barth, A., Newcombe, M., Plank, T., Gonnermann, H., Hajimirza, S., Soto, G.J., Saballos, A., Hauri, E. (2019) Magma decompression rate correlates with explosivity at basaltic volcanoes — Constraints from water diffusion in olivine. Journal of Volcanology and Geothermal Research 387, 106664. https://doi.org/10.1016/j.jvolgeores.2019.106664
) because (1) it can track temperature sensitive changes over periods of minutes-to-hours, and (2) it is not orientation dependent. Additionally, MgO profiles in silicate melts can be measured using commonly available analytical equipment (EPMA, SEM-EDS), thus facilitating quick and cost effective data collection.Widespread application of this innovative approach is currently limited by a lack of MgO diffusion data for hydrous melt compositions. MgO diffusion during olivine dissolution has been experimentally calibrated in nominally anhydrous (0.25–0.4 wt. % H2O) mid-ocean ridge basaltic melts (Chen and Zhang, 2008
Chen, Y., Zhang, Y. (2008) Olivine dissolution in basaltic melt. Geochimica et Cosmochimica Acta 72, 4756–4777. https://doi.org/10.1016/j.gca.2008.07.014
). Newcombe et al. (2014Newcombe, M.E., Fabbrizio, A., Zhang, Y., Ma, C., Le Voyer, M., Guan, Y., Eiler, J.M., Saal, A.E., Stolper, E.M. (2014) Chemical zonation in olivine-hosted melt inclusions. Contributions to Mineralogy and Petrology 168, 1030. https://doi.org/10.1007/s00410-014-1030-6
, 2020)Newcombe, M.E., Plank, T., Zhang, Y., Holycross, M., Barth, A., Lloyd, A.S., Ferguson, D., Houghton, B.F., Hauri, E. (2020) Magma Pressure-Temperature-Time Paths During Mafic Explosive Eruptions. Frontiers in Earth Science 8, 531911. https://doi.org/10.3389/feart.2020.531911
have investigated chemical gradients in olivine hosted MIs from ocean island and arc volcanoes by applying the data set of Chen and Zhang (2008)Chen, Y., Zhang, Y. (2008) Olivine dissolution in basaltic melt. Geochimica et Cosmochimica Acta 72, 4756–4777. https://doi.org/10.1016/j.gca.2008.07.014
to calculate cooling rates and track the thermal histories of volcanic eruptions. However, Arrhenius relationships for MgO diffusion have only been established for dry basaltic melts. The use of dry melt data to estimate the thermal histories of H2O-bearing magmas is not entirely appropriate because the presence of dissolved H2O enhances diffusion rates (e.g., Watson, 1981Watson, E.B. (1981) Diffusion in magmas at depth in the Earth: The effects of pressure and dissolved H2O. Earth and Planetary Science Letters 52, 291–301. https://doi.org/10.1016/0012-821X(81)90184-9
), resulting in rapidly increased diffusivity as more dissolved water is incorporated into the melt. Consequently, applications of dry DMgO will yield erroneously long timescales for modelled volcanic processes in hydrous systems.To account for the effects of H2O on MgO diffusion, Newcombe et al. (2020)
Newcombe, M.E., Plank, T., Zhang, Y., Holycross, M., Barth, A., Lloyd, A.S., Ferguson, D., Houghton, B.F., Hauri, E. (2020) Magma Pressure-Temperature-Time Paths During Mafic Explosive Eruptions. Frontiers in Earth Science 8, 531911. https://doi.org/10.3389/feart.2020.531911
conducted one additional experiment using a hydrous basaltic andesite melt at 1225 °C and 1 GPa. But aside from this single DMgO measurement, no other MgO diffusion data in hydrous silicate melts have been published. This experimental study expands on the understanding of MgO diffusion in hydrous silicate melts by reporting an internally consistent data set at 1125–1550 °C and 2.2–4.5 wt. % H2O. Our results can be applied to model the thermal histories and eruptive styles of global arc magmas, which contain 4 wt. % H2O on average, but span from 1–6 wt. % (Plank et al., 2013Plank, T., Kelley, K.A., Zimmer, M.M., Hauri, E.H., Wallace, P.J. (2013) Why do mafic arc magmas contain ∼4 wt% water on average? Earth and Planetary Science Letters 364, 168–179. https://doi.org/10.1016/j.epsl.2012.11.044
). Our results may also be useful in evaluating post-entrapment processes (e.g., cooling, decompression, crystallisation) that lead to vapour bubble growth in MIs (Rasmussen et al., 2020Rasmussen, D.J., Plank, T.A., Wallace, P.J., Newcombe, M.E., Lowenstern, J.B. (2020) Vapor-bubble growth in olivine-hosted melt inclusions. American Mineralogist 105, 1898–1919. https://doi.org/10.2138/am-2020-7377
). Finally, because MgO diffusion in the melt is considered to be the rate limiting step for olivine growth and dissolution (Chen and Zhang, 2008Chen, Y., Zhang, Y. (2008) Olivine dissolution in basaltic melt. Geochimica et Cosmochimica Acta 72, 4756–4777. https://doi.org/10.1016/j.gca.2008.07.014
), accurate measurements of MgO diffusion in melts of varying composition are essential for quantifying kinetic controls on olivine saturation in magmas.top
Experimental and Analytical Techniques
We conducted series of piston cylinder experiments in the experimental geochemistry lab at Cornell University following the approach of Chen and Zhang (2008)
Chen, Y., Zhang, Y. (2008) Olivine dissolution in basaltic melt. Geochimica et Cosmochimica Acta 72, 4756–4777. https://doi.org/10.1016/j.gca.2008.07.014
. San Carlos Olivine (SCO; Fo90) grains were: cored into 2.5 mm diameter rods, sliced into 0.3–0.5 mm thick discs, manually grounded with progressively finer SiC paper; then machine polished with alumina suspension and subsequently with colloidal silica to remove near surface crystal defects (following the methodology of Watson et al., 2016Watson, E.B., Cherniak, D.J., Thomas, J.B., Hanchar, J.M., Wirth, R. (2016) Crystal surface integrity and diffusion measurements on Earth and planetary materials. Earth and Planetary Science Letters 450, 346–354. https://doi.org/10.1016/j.epsl.2016.06.043
). We examined each disc under a petrographic microscope to ensure these were inclusion- and crack-free (occasionally, crystals with small cracks that did not disturb the interface were deemed acceptable). We placed each SCO disc in a single (graphite only or Au90Pd10 only) or double (inner graphite liner + either Ni or Au90Pd10) capsule. We strategically selected the capsule materials to best preserve the original water content of the melt while simultaneously preventing capsule melting at high temperatures (Fig. S-1; see SI).We used reagent grade powdered oxides to make two synthesised powder mixes (melt) of basaltic andesite composition (Table S-2) at initial ∼4 wt. % and ∼6 wt. % dissolved H2O, respectively. All H2O was added as Al(OH)3. The powder mix was packed in the capsule, on top of the polished SCO. Each capsule was fit into a MgO pressure media, placed inside a graphite heater, and then into a ½” BaCO3 cell. We used similar capsule size and geometry for all experiments to optimise consistency at a given nominal temperature-pressure condition. The experiment temperatures spanned from 1125–1550 °C with variable times (Table S-1). The experimental assemblies were pressurised to 1 GPa. All samples were quenched by turning off the power. See SI for more details.
We mounted each sample in epoxy to expose and polish the experimental glass before chemical analysis. Major and minor element compositions of all experiments were measured by a Cameca SXFive electron microprobe (EPMA) at Syracuse University and/or a JSM-IT700HR scanning electron microscope at the Cornell Mass Spectrometry (CMaS) facilities in the Department of Earth and Atmospheric Sciences (EAS). Specific conditions and data collection routines used for each instrument are outlined in SI. A minimum of three glass transects (Tables S-5 to S-18) were taken from the flat olivine melt interface towards the end of the capsule. Collecting multiple transects optimised the precision of our reported data and allowed us to determine if recovered MgO gradients could be due to mass transport or by a process other than diffusion. If multiple transects in one single experiment were inconsistent, we labelled them as “failed experiments” and omitted those results. Backscatter electron (BSE) images were captured to observe textures and measure olivine dissolution from the olivine interface into the melt (Fig. 1).
Figure 1 Examples of experiment textures. Decompression cracks are present in all experiments. Quench crystals are largest in high temperature experiments. (a) BSE image of SCO9 at 1550 °C. Zoomed in panel shows crystals at the olivine melt interface that formed upon quench. (b) BSE image of SCO3 at 1350 °C illustrating dendritic quench crystals near the interface. (c) BSE image of SCO13 at 1175 °C showing clusters of smaller quench crystals near the interface.
Samples were prepared for Fourier transform infrared (FTIR) spectroscopy measurements in the Department of EAS at Cornell University to quantify the dissolved H2O content of each glass. Preparation included cutting thin wafers, grinding, and doubly polishing — following the methods of Dixon et al. (1995)
Dixon, J.E., Stolper, E.M., Holloway, J.R. (1995) An Experimental Study of Water and Carbon Dioxide Solubilities in Mid-Ocean Ridge Basaltic Liquids. Part I: Calibration and Solubility Models. Journal of Petrology 36, 1607–1631. https://doi.org/10.1093/oxfordjournals.petrology.a037267
. See SI for specific instrument settings and procedures.MgO concentration profiles were fitted using the ORIGIN™ software via the semi-infinite solution approach:
Eq. 1

where C(x,t) is the concentration of MgO at a given distance (x) and time (t), C0 is the concentration of MgO at the olivine melt interface, Cs is the initial MgO in the melt. The effective binary diffusivity of MgO, DMgO, was calculated based on the known variables described above (Fig. 2). Error calculations are explained in SI. Experimental durations were corrected following effective time calculation methods from Zhang and Behrens (2000)
Zhang, Y., Behrens, H. (2000) H2O diffusion in rhyolitic melts and glasses. Chemical Geology 169, 243–262. https://doi.org/10.1016/S0009-2541(99)00231-4
. An explicit finite difference method forward model was used to extract MgO diffusivities in five experiments that violated the infinite medium assumption. Measured MgO diffusivities were grouped by average of final dissolved water content (either ∼2.2 or ∼4.5 wt. %; Fig. 3) and fit with a linear regression to characterise the temperature dependence of diffusion according to the Arrhenius equation:Eq. 2
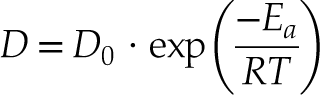
where D0 is the pre-exponential factor (m2/s), Ea is the activation energy (J/mol), R is the gas constant (J/K·mol), and T is temperature (Kelvin).
Figure 2 Diffusion profile and best fit. Measured MgO concentrations are shown as black circles. Coloured line corresponds to the semi-infinite model. Inset: BSE image for SCO20; black line shows location and direction (a to a′) of one of three traverses on this sample.
Figure 3 DMgO as a function of T at ∼2.2 and ∼4.5 wt. % water at 1 GPa, compared to DMgO in dry basalt at 1 atm (Kress and Ghiorso, 1995
Kress, V.C., Ghiorso, M.S. (1995) Multicomponent diffusion in basaltic melts. Geochimica et Cosmochimica Acta 59, 313–324. https://doi.org/10.1016/0016-7037(94)00286-U
), dry MORB at 0.47–1.42 GPa (Chen and Zhang, 2008Chen, Y., Zhang, Y. (2008) Olivine dissolution in basaltic melt. Geochimica et Cosmochimica Acta 72, 4756–4777. https://doi.org/10.1016/j.gca.2008.07.014
), and a hydrous DMgO data point (Newcombe et al., 2020Newcombe, M.E., Plank, T., Zhang, Y., Holycross, M., Barth, A., Lloyd, A.S., Ferguson, D., Houghton, B.F., Hauri, E. (2020) Magma Pressure-Temperature-Time Paths During Mafic Explosive Eruptions. Frontiers in Earth Science 8, 531911. https://doi.org/10.3389/feart.2020.531911
). Colour gradient shows measured water via FTIR.top
Results
All SCO crystals showed some degree of dissolution during the experiment — initially flat crystals now show curvatures on the olivine edges, and quench crystals are present along the interface (Fig. 1). Decompression fractures were evident in the glass and olivine after all experimental runs. Analyses of quench crystals and decompression cracks in the glass were excluded from diffusion modelling to prevent data scatter in MgO diffusion profiles. Uphill diffusion was observed in the concentration profiles of CaO, Al2O3, and Na2O; however, MgO exhibited no such behaviour and showed no other diffusion anomalies.
For experiments at 1175 °C to 1225 °C (Fig. 1c), the interface was minimally disturbed by the presence of quench crystals (individual size ≤10 μm). For experiments at 1350 °C (Fig. 1b), clusters of dendritic textures were observed up to 100 μm away from the interface. For experiments at >1400 °C (Fig. 1a), needle shaped crystals were observed near the interface and extended up to 200 μm into the glass. The observed textures and sizes of quench crystals were dependent on the experiment temperature, not the duration of the runs. This is in agreement with the findings of Chen and Zhang (2008)
Chen, Y., Zhang, Y. (2008) Olivine dissolution in basaltic melt. Geochimica et Cosmochimica Acta 72, 4756–4777. https://doi.org/10.1016/j.gca.2008.07.014
, and indicates that the crystals formed during experiment cooling (quenching). Higher temperature experiments (Fig. 1a) were subject to greater degrees of quench crystal growth because, at constant quench rate, they take longer to cool below the glass transition.The composition of these quench crystals could not be precisely measured via EPMA due to either their small size or acicular aspect ratios (all analyses were subject to secondary fluorescence from the melt). Our limited analyses suggested that the quench crystals are primarily olivine and clinopyroxene. In most cases, the presence of quench crystals did not alter the preservation of the broad error function shape of the MgO diffusion profiles. However, in three experiments at 1400–1550 °C, olivine overgrowth did disturb the compositional profiles, so the transects were split into two: (1) from the interface to the end of the overgrowth, and (2) 10 μm away from the end of the overgrowth to the end of the capsule (crystal-free glass). Fitting of such profiles was performed by omitting the first segment and exclusively using the second one.
FTIR analyses revealed our experimental glasses largely did not retain their initial water contents of 4 or 6 wt. % (Table S-1, Fig. S-1). This was expected, as noble metals and graphite are not perfect containers for H2O (or rather H2; e.g., Truckenbrodt and Johannes, 1999
Truckenbrodt, J., Johannes, W. (1999) H2O loss during piston-cylinder experiments. American Mineralogist 84, 1333–1335. https://doi.org/10.2138/am-1999-0909
). To mitigate H2O losses, we shortened the experiment run times and carefully selected capsule materials that were most effective at retaining H2 whilst preventing capsule melting at intermediate and high temperatures (see SI).The temperature dependence of MgO diffusion produced coherent Arrhenius relationships, which are grouped by average final dissolved water content of ∼2.2 and ∼4.5 wt. % (Fig. 3), and yielded distinct pre-exponential factors (D0, 2.2 = 4.04E−05 ± 1.39E−05 m2/s and D0, 4.5 = 7.26E−06 ± 5.73E−07 m2/s) and activation energy (Ea, 2.2 = 173,255 ± 4,891 J/mol and Ea, 4.5 = 143,977 ± 21,681 J/mol) (Table S-3). Grouping the MgO diffusion data by initial water content results in less congruent Arrhenius relationships for both groups (Fig. S-3). Additionally, we note that the datum of Newcombe et al. (2020)
Newcombe, M.E., Plank, T., Zhang, Y., Holycross, M., Barth, A., Lloyd, A.S., Ferguson, D., Houghton, B.F., Hauri, E. (2020) Magma Pressure-Temperature-Time Paths During Mafic Explosive Eruptions. Frontiers in Earth Science 8, 531911. https://doi.org/10.3389/feart.2020.531911
for MgO diffusion in a basaltic andesite melt of initial 3.8 wt. % H2O plots along our ∼2.2 wt. % Arrhenius relationship. Newcombe et al. (2020)Newcombe, M.E., Plank, T., Zhang, Y., Holycross, M., Barth, A., Lloyd, A.S., Ferguson, D., Houghton, B.F., Hauri, E. (2020) Magma Pressure-Temperature-Time Paths During Mafic Explosive Eruptions. Frontiers in Earth Science 8, 531911. https://doi.org/10.3389/feart.2020.531911
did not determine the post-experiment concentration of H2O in their melt, so it is possible that their sample did not maintain its initial H2O content.top
Discussion
Although our glasses did not retain their initial water contents, our results are highly relevant to natural diffusion scenarios where olivine growth occurs simultaneously with melt inclusion dehydration via H2 diffusion in olivine (e.g., Barth et al., 2019
Barth, A., Newcombe, M., Plank, T., Gonnermann, H., Hajimirza, S., Soto, G.J., Saballos, A., Hauri, E. (2019) Magma decompression rate correlates with explosivity at basaltic volcanoes — Constraints from water diffusion in olivine. Journal of Volcanology and Geothermal Research 387, 106664. https://doi.org/10.1016/j.jvolgeores.2019.106664
). We interpret the final measured dissolved water content of the glass to be representative of the conditions in which the bulk of MgO diffusion occurred. This interpretation is supported by the low standard deviations of multiple FTIR measurements on glass collected at various locations throughout the capsule (Table S-1), which show water loss was relatively uniform throughout the capsule at the spatial resolution of FTIR. The diffusion of H2O in melt is faster than the measured diffusion of MgO such that gradients in the chemical potential of H2O in melt will be equilibrated much more rapidly than that of MgO. For instance, using the H2O diffusivity parameterisation from Behrens et al. (2004)Behrens, H., Zhang, Y., Xu, Z. (2004) H2O diffusion in dacitic and andesitic melts. Geochimica et Cosmochimica Acta 68, 5139–5150. https://doi.org/10.1016/j.gca.2004.07.008
, we calculate the H2O diffusive length scale in experiment 21 using:Eq. 3
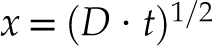
and it resulted to be ∼20 % longer than the MgO diffusive length scale at the same conditions.
Our measured DMgO values at ∼4.5 wt. % are roughly one order of magnitude higher than those reported in dry MORB at high pressures (Chen and Zhang, 2008
Chen, Y., Zhang, Y. (2008) Olivine dissolution in basaltic melt. Geochimica et Cosmochimica Acta 72, 4756–4777. https://doi.org/10.1016/j.gca.2008.07.014
) and up to two orders of magnitude higher than DMgO in dry basalt at 1 atm (Kress and Ghiorso, 1995Kress, V.C., Ghiorso, M.S. (1995) Multicomponent diffusion in basaltic melts. Geochimica et Cosmochimica Acta 59, 313–324. https://doi.org/10.1016/0016-7037(94)00286-U
) (Fig. 3). Our results demonstrate that element diffusion rates in silicate melts are positively correlated with dissolved water content, in agreement with many other studies (e.g., Mungall et al., 1999Mungall, J.E., Dingwell, D.B., Chaussidon, M. (1999) Chemical diffusivities of 18 trace elements in granitoid melts. Geochimica et Cosmochimica Acta 63, 2599–2610. https://doi.org/10.1016/S0016-7037(99)00209-4
; Holycross and Watson, 2018Holycross, M.E., Watson, E.B. (2018) Trace element diffusion and kinetic fractionation in wet rhyolitic melt. Geochimica et Cosmochimica Acta 232, 14–29. https://doi.org/10.1016/j.gca.2018.04.006
; Troch et al., 2024Troch, J., Huber, C., Kueter, N., Guillong, M., Ackerson, M., Ulmer, P., Bachmann, O. (2024) The effect of water on alkali trace element diffusion (Li, Rb, Cs) in silicic melts. Geochimica et Cosmochimica Acta 365, 101–113. https://doi.org/10.1016/j.gca.2023.11.031
). The positive relationship between element diffusivities in melt and dissolved water content is a result of melt depolymerisation — as H2O dissociates, it reacts with bridging oxygen in the melt by rupturing Si-O-Si linkages and forming hydroxyl groups (Stolper, 1982Stolper, E. (1982) The speciation of water in silicate melts. Geochimica et Cosmochimica Acta 46, 2609–2620. https://doi.org/10.1016/0016-7037(82)90381-7
).Above ∼3 wt. % dissolved H2O, the function of log10D and dissolved water content has previously shown to be asymptotic for most cations (Watson, 1981
Watson, E.B. (1981) Diffusion in magmas at depth in the Earth: The effects of pressure and dissolved H2O. Earth and Planetary Science Letters 52, 291–301. https://doi.org/10.1016/0012-821X(81)90184-9
). That is, log10D is dependent on the square root of dissolved water content, perhaps because the dissolution of molecular H2O in a glass at that point has a negligible impact on viscosity. In contrast, our data is best fit by a linear relationship between log10DMgO and dissolved water in the melt (Fig. S-4). Linear relationships between measured D and dissolved H2O are not uncommon and have been recorded for alkali diffusion in silicate melts (Watson, 1979Watson, E.B. (1979) Diffusion of Cesium Ions in H2O-Saturated Granitic Melt. Science 205, 1259–1260. https://doi.org/10.1126/science.205.4412.1259
; Troch et al., 2024Troch, J., Huber, C., Kueter, N., Guillong, M., Ackerson, M., Ulmer, P., Bachmann, O. (2024) The effect of water on alkali trace element diffusion (Li, Rb, Cs) in silicic melts. Geochimica et Cosmochimica Acta 365, 101–113. https://doi.org/10.1016/j.gca.2023.11.031
). Watson (1981)Watson, E.B. (1981) Diffusion in magmas at depth in the Earth: The effects of pressure and dissolved H2O. Earth and Planetary Science Letters 52, 291–301. https://doi.org/10.1016/0012-821X(81)90184-9
noted that diffusivities of very fast diffusing elements tend to be less inflated by the addition of dissolved water compared to slow diffusing elements, indicating there could be an upper limit to element diffusion speeds in melts. Zhang et al. (2010)Zhang, Y., Ni, H., Chen, Y. (2010) Diffusion Data in Silicate Melts. Reviews in Mineralogy and Geochemistry 72, 311–408. https://doi.org/10.2138/rmg.2010.72.8
also suggest that the log10D of neutral species varies linearly with melt water content. This could explain our observations if Mg is transported through the melt as MgO. Finally, we note that our results (Fig. S-4) align with theoretical predictions and the literature (Watson, 1981Watson, E.B. (1981) Diffusion in magmas at depth in the Earth: The effects of pressure and dissolved H2O. Earth and Planetary Science Letters 52, 291–301. https://doi.org/10.1016/0012-821X(81)90184-9
; Mungall, 2002Mungall, J.E. (2002) Empirical models relating viscosity and tracer diffusion in magmatic silicate melts. Geochimica et Cosmochimica Acta 66, 125–143. https://doi.org/10.1016/S0016-7037(01)00736-0
; Holycross et al., 2018Holycross, M.E., Watson, E.B., Richter, F.M., Villeneuve, J. (2018) Diffusive fractionation of Li isotopes in wet, highly silicic melts. Geochemical Perspectives Letters 6, 39–42. https://doi.org/10.7185/geochemlet.1807
) by showing that as dissolved water content increases, the activation energy of MgO diffusion decreases.The effects of H2O on MgO diffusion can be parameterised using:
Eq. 4

where DMgO is the MgO diffusion coefficient (m2/s), D0 is the pre-exponential factor calculated as 1.89E−05 m2/s (errors reported in Table S-3), the activation energy (Ea) is 167,674 ± 11,469 J/mol, R is the gas constant (J/K·mol), T is temperature (Kelvin), k is a coefficient that represents the observed linear relationship between logDMgO and H2O (Fig. S-4) and is calculated as 0.19 ± 0.06, and H2O is the measured water content in the melt (wt. %). Equation 4 is strongly supported by our dataset (r2 = 0.98) and enables reliable calculation of MgO diffusivity across a range of temperatures and varying H2O contents in basaltic andesite melts.
top
Implications
The diffusion of MgO in hydrous basaltic andesite will bracket the magmatic histories recorded by Fe-Mg exchange (Dohmen et al., 2007
Dohmen, R., Becker, H.-W., Chakraborty, S. (2007) Fe–Mg diffusion in olivine I: experimental determination between 700 and 1,200°C as a function of composition, crystal orientation and oxygen fugacity. Physics and Chemistry of Minerals 34, 389–407. https://doi.org/10.1007/s00269-007-0157-7
; Shea et al., 2023Shea, T., Ruth, D., Jollands, M., Ohtaki, K., Ishii, H., Bradley, J. (2023) The presence of silicate melt may enhance rates of cation diffusion in olivine. Earth and Planetary Science Letters 621, 118370. https://doi.org/10.1016/j.epsl.2023.118370
) and H+ diffusion in olivine (Barth et al., 2019Barth, A., Newcombe, M., Plank, T., Gonnermann, H., Hajimirza, S., Soto, G.J., Saballos, A., Hauri, E. (2019) Magma decompression rate correlates with explosivity at basaltic volcanoes — Constraints from water diffusion in olivine. Journal of Volcanology and Geothermal Research 387, 106664. https://doi.org/10.1016/j.jvolgeores.2019.106664
) (Fig. 4). MgO diffusion chronometry is uniquely poised to unlock community knowledge of magma ascent rates and the timescales of other syn-eruptive volcanic processes (Newcombe et al., 2014Newcombe, M.E., Fabbrizio, A., Zhang, Y., Ma, C., Le Voyer, M., Guan, Y., Eiler, J.M., Saal, A.E., Stolper, E.M. (2014) Chemical zonation in olivine-hosted melt inclusions. Contributions to Mineralogy and Petrology 168, 1030. https://doi.org/10.1007/s00410-014-1030-6
, 2020Newcombe, M.E., Plank, T., Zhang, Y., Holycross, M., Barth, A., Lloyd, A.S., Ferguson, D., Houghton, B.F., Hauri, E. (2020) Magma Pressure-Temperature-Time Paths During Mafic Explosive Eruptions. Frontiers in Earth Science 8, 531911. https://doi.org/10.3389/feart.2020.531911
; Saper and Stolper, 2020Saper, L.M., Stolper, E.M. (2020) Controlled Cooling‐Rate Experiments on Olivine‐Hosted Melt Inclusions: Chemical Diffusion and Quantification of Eruptive Cooling Rates on Hawaii and Mars. Geochemistry, Geophysics, Geosystems 21, e2019GC008772. https://doi.org/10.1029/2019GC008772
) because it is not orientation dependent and its diffusion behaviour appears to be relatively simple compared to other crystalline chronometers (e.g., Barth et al., 2023Barth, A., Plank, T., Towbin, H. (2023) Rates of dehydration in hydrous, high-Fo, magmatic olivines. Geochimica et Cosmochimica Acta 342, 62–73. https://doi.org/10.1016/j.gca.2022.11.009
). Our newly reported MgO diffusion coefficients show that dissolved water in melt exerts direct control on the speed of MgO transport during olivine growth or dissolution. For example, application of the dry DMgO diffusion data of Chen and Zhang (2008)Chen, Y., Zhang, Y. (2008) Olivine dissolution in basaltic melt. Geochimica et Cosmochimica Acta 72, 4756–4777. https://doi.org/10.1016/j.gca.2008.07.014
to a 20 μm MgO diffusion profile produced at 1100 °C yields a diffusive timescale of 3.6 min using Equation 3. Application of our new hydrous (∼4.5 wt. % H2O) data to this same profile will return a timescale of 18 s, nearly an order of magnitude shorter (Fig. 4). Hence, the effect of water on DMgO must not be overlooked; otherwise, it will lead to inaccurate calculations of the timescales associated with arc magmatic events.Figure 4 Timescales recorded by diffusion chronometers for mafic arc systems including Fe-Mg exchange in Fo80 (Dohmen et al., 2007
Dohmen, R., Becker, H.-W., Chakraborty, S. (2007) Fe–Mg diffusion in olivine I: experimental determination between 700 and 1,200°C as a function of composition, crystal orientation and oxygen fugacity. Physics and Chemistry of Minerals 34, 389–407. https://doi.org/10.1007/s00269-007-0157-7
), MgO in dry MORB (Chen and Zhang, 2008Chen, Y., Zhang, Y. (2008) Olivine dissolution in basaltic melt. Geochimica et Cosmochimica Acta 72, 4756–4777. https://doi.org/10.1016/j.gca.2008.07.014
), DMgO in hydrous basaltic andesite (this study, covering diffusivities at 2.2 and 4.5 wt. % H2O), and H in Fo80 olivine (Barth et al., 2019Barth, A., Newcombe, M., Plank, T., Gonnermann, H., Hajimirza, S., Soto, G.J., Saballos, A., Hauri, E. (2019) Magma decompression rate correlates with explosivity at basaltic volcanoes — Constraints from water diffusion in olivine. Journal of Volcanology and Geothermal Research 387, 106664. https://doi.org/10.1016/j.jvolgeores.2019.106664
). Timescales were modelled using inset equation with x = 20–300 μm and D was calculated at 1100 °C.top
Acknowledgements
We are grateful to K. Dayton for analytical help and B. Garvey for programming insight. This manuscript benefitted from feedback by M. Newcombe, an anonymous reviewer, and R. Fonseca (editor). This study was supported by Cornell University start up funds to MH.
Editor: Raul O.C. Fonseca
top
References
Barth, A., Newcombe, M., Plank, T., Gonnermann, H., Hajimirza, S., Soto, G.J., Saballos, A., Hauri, E. (2019) Magma decompression rate correlates with explosivity at basaltic volcanoes — Constraints from water diffusion in olivine. Journal of Volcanology and Geothermal Research 387, 106664. https://doi.org/10.1016/j.jvolgeores.2019.106664
 Show in context
 Calibrating MgO diffusion provides a unique opportunity to expand the chronometry recorded by Fe-Mg exchange (Dohmen et al., 2007) and H+ diffusion in olivine (Barth et al., 2019) because (1) it can track temperature sensitive changes over periods of minutes-to-hours, and (2) it is not orientation dependent.
View in article
Although our glasses did not retain their initial water contents, our results are highly relevant to natural diffusion scenarios where olivine growth occurs simultaneously with melt inclusion dehydration via H2 diffusion in olivine (e.g., Barth et al., 2019).
View in article
The diffusion of MgO in hydrous basaltic andesite will bracket the magmatic histories recorded by Fe-Mg exchange (Dohmen et al., 2007; Shea et al., 2023) and H+ diffusion in olivine (Barth et al., 2019) (Fig. 4).
View in article
Timescales recorded by diffusion chronometers for mafic arc systems including Fe-Mg exchange in Fo80 (Dohmen et al., 2007), MgO in dry MORB (Chen and Zhang, 2008), DMgO in hydrous basaltic andesite (this study, covering diffusivities at 2.2 and 4.5 wt. % H2O), and H in Fo80 olivine (Barth et al., 2019).
View in article
Barth, A., Plank, T., Towbin, H. (2023) Rates of dehydration in hydrous, high-Fo, magmatic olivines. Geochimica et Cosmochimica Acta 342, 62–73. https://doi.org/10.1016/j.gca.2022.11.009
Show in context MgO diffusion chronometry is uniquely poised to unlock community knowledge of magma ascent rates and the timescales of other syn-eruptive volcanic processes (Newcombe et al., 2014, 2020; Saper and Stolper, 2020) because it is not orientation dependent and its diffusion behaviour appears to be relatively simple compared to other crystalline chronometers (e.g., Barth et al., 2023).
View in article
Behrens, H., Zhang, Y., Xu, Z. (2004) H2O diffusion in dacitic and andesitic melts. Geochimica et Cosmochimica Acta 68, 5139–5150. https://doi.org/10.1016/j.gca.2004.07.008
Show in context For instance, using the H2O diffusivity parameterisation from Behrens et al. (2004), we calculate the H2O diffusive length scale in experiment 21 using:
Eq. 3.
and it resulted to be ∼20 % longer than the MgO diffusive length scale at the same conditions.
View in article
Chen, Y., Zhang, Y. (2008) Olivine dissolution in basaltic melt. Geochimica et Cosmochimica Acta 72, 4756–4777. https://doi.org/10.1016/j.gca.2008.07.014
Show in context MgO diffusion during olivine dissolution has been experimentally calibrated in nominally anhydrous (0.25–0.4 wt. % H2O) mid-ocean ridge basaltic melts (Chen and Zhang, 2008).
View in article
Newcombe et al. (2014, 2020) have investigated chemical gradients in olivine hosted MIs from ocean island and arc volcanoes by applying the data set of Chen and Zhang (2008) to calculate cooling rates and track the thermal histories of volcanic eruptions.
View in article
Finally, because MgO diffusion in the melt is considered to be the rate limiting step for olivine growth and dissolution (Chen and Zhang, 2008), accurate measurements of MgO diffusion in melts of varying composition are essential for quantifying kinetic controls on olivine saturation in magmas.
View in article
We conducted series of piston cylinder experiments in the experimental geochemistry lab at Cornell University following the approach of Chen and Zhang (2008).
View in article
DMgO as a function of T at ∼2.2 and ∼4.5 wt. % water at 1 GPa, compared to DMgO in dry basalt at 1 atm (Kress and Ghiorso, 1995), dry MORB at 0.47–1.42 GPa (Chen and Zhang, 2008), and a hydrous DMgO data point (Newcombe et al., 2020).
View in article
This is in agreement with the findings of Chen and Zhang (2008), and indicates that the crystals formed during experiment cooling (quenching).
View in article
Our measured DMgO values at ∼4.5 wt. % are roughly one order of magnitude higher than those reported in dry MORB at high pressures (Chen and Zhang, 2008) and up to two orders of magnitude higher than DMgO in dry basalt at 1 atm (Kress and Ghiorso, 1995) (Fig. 3).
View in article
For example, application of the dry DMgO diffusion data of Chen and Zhang (2008) to a 20 μm MgO diffusion profile produced at 1100 °C yields a diffusive timescale of 3.6 min using Equation 3.
View in article
Timescales recorded by diffusion chronometers for mafic arc systems including Fe-Mg exchange in Fo80 (Dohmen et al., 2007), MgO in dry MORB (Chen and Zhang, 2008), DMgO in hydrous basaltic andesite (this study, covering diffusivities at 2.2 and 4.5 wt. % H2O), and H in Fo80 olivine (Barth et al., 2019).
View in article
Costa, F., Chakraborty, S. (2004) Decadal time gaps between mafic intrusion and silicic eruption obtained from chemical zoning patterns in olivine. Earth and Planetary Science Letters 227, 517–530. https://doi.org/10.1016/j.epsl.2004.08.011
Show in context In contrast, chemical zonation profiles in olivine hosted MIs provide practical advantages to study the systematics of various magmatic settings on Earth (e.g., Watson and Baker, 1991; Costa and Chakraborty, 2004; Newcombe et al., 2014, 2020; Costa et al., 2020; Wallace et al., 2021) and Mars (e.g., Saper and Stolper, 2020) because they record the diffusion of MgO in the silicate melt during post-entrapment crystallisation of olivine on MIs walls.
View in article
Costa, F., Shea, T., Ubide, T. (2020) Diffusion chronometry and the timescales of magmatic processes. Nature Reviews Earth & Environment 1, 201–214. https://doi.org/10.1038/s43017-020-0038-x
Show in context In contrast, chemical zonation profiles in olivine hosted MIs provide practical advantages to study the systematics of various magmatic settings on Earth (e.g., Watson and Baker, 1991; Costa and Chakraborty, 2004; Newcombe et al., 2014, 2020; Costa et al., 2020; Wallace et al., 2021) and Mars (e.g., Saper and Stolper, 2020) because they record the diffusion of MgO in the silicate melt during post-entrapment crystallisation of olivine on MIs walls.
View in article
Danyushevsky, L.V., Della-Pasqua, F.N., Sokolov, S. (2000) Re-equilibration of melt inclusions trapped by magnesian olivine phenocrysts from subduction-related magmas: petrological implications. Contributions to Mineralogy and Petrology 138, 68–83. https://doi.org/10.1007/PL00007664
Show in context Melt inclusions (MIs) are useful to directly access magmatic conditions at the time of entrapment; however, post-entrapment crystallisation processes may complicate the reconstruction of initial melt compositions and volatile contents (e.g., Danyushevsky et al., 2000; Gaetani and Watson, 2000).
View in article
Previous studies have addressed this by applying bulk corrections under the assumption of chemical homogeneity (e.g., Danyushevsky et al., 2000; Gaetani and Watson, 2000) but are limited in resolving internal compositional gradients.
View in article
Dixon, J.E., Stolper, E.M., Holloway, J.R. (1995) An Experimental Study of Water and Carbon Dioxide Solubilities in Mid-Ocean Ridge Basaltic Liquids. Part I: Calibration and Solubility Models. Journal of Petrology 36, 1607–1631. https://doi.org/10.1093/oxfordjournals.petrology.a037267
Show in context Preparation included cutting thin wafers, grinding, and doubly polishing — following the methods of Dixon et al. (1995). See SI for specific instrument settings and procedures.
View in article
Dohmen, R., Becker, H.-W., Chakraborty, S. (2007) Fe–Mg diffusion in olivine I: experimental determination between 700 and 1,200°C as a function of composition, crystal orientation and oxygen fugacity. Physics and Chemistry of Minerals 34, 389–407. https://doi.org/10.1007/s00269-007-0157-7
Show in context Calibrating MgO diffusion provides a unique opportunity to expand the chronometry recorded by Fe-Mg exchange (Dohmen et al., 2007) and H+ diffusion in olivine (Barth et al., 2019) because (1) it can track temperature sensitive changes over periods of minutes-to-hours, and (2) it is not orientation dependent.
View in article
The diffusion of MgO in hydrous basaltic andesite will bracket the magmatic histories recorded by Fe-Mg exchange (Dohmen et al., 2007; Shea et al., 2023) and H+ diffusion in olivine (Barth et al., 2019) (Fig. 4).
View in article
Timescales recorded by diffusion chronometers for mafic arc systems including Fe-Mg exchange in Fo80 (Dohmen et al., 2007), MgO in dry MORB (Chen and Zhang, 2008), DMgO in hydrous basaltic andesite (this study, covering diffusivities at 2.2 and 4.5 wt. % H2O), and H in Fo80 olivine (Barth et al., 2019).
View in article
Gaetani, G.A., Watson, E.B. (2000) Open system behavior of olivine-hosted melt inclusions. Earth and Planetary Science Letters 183, 27–41. https://doi.org/10.1016/S0012-821X(00)00260-0
Show in context Melt inclusions (MIs) are useful to directly access magmatic conditions at the time of entrapment; however, post-entrapment crystallisation processes may complicate the reconstruction of initial melt compositions and volatile contents (e.g., Danyushevsky et al., 2000; Gaetani and Watson, 2000).
View in article
Previous studies have addressed this by applying bulk corrections under the assumption of chemical homogeneity (e.g., Danyushevsky et al., 2000; Gaetani and Watson, 2000) but are limited in resolving internal compositional gradients.
View in article
Holycross, M.E., Watson, E.B. (2018) Trace element diffusion and kinetic fractionation in wet rhyolitic melt. Geochimica et Cosmochimica Acta 232, 14–29. https://doi.org/10.1016/j.gca.2018.04.006
Show in context Our results demonstrate that element diffusion rates in silicate melts are positively correlated with dissolved water content, in agreement with many other studies (e.g., Mungall et al., 1999; Holycross and Watson, 2018; Troch et al., 2024).
View in article
Holycross, M.E., Watson, E.B., Richter, F.M., Villeneuve, J. (2018) Diffusive fractionation of Li isotopes in wet, highly silicic melts. Geochemical Perspectives Letters 6, 39–42. https://doi.org/10.7185/geochemlet.1807
Show in context This could explain our observations if Mg is transported through the melt as MgO. Finally, we note that our results (Fig. S-4) align with theoretical predictions and the literature (Watson, 1981; Mungall, 2002; Holycross et al., 2018) by showing that as dissolved water content increases, the activation energy of MgO diffusion decreases.
View in article
Kress, V.C., Ghiorso, M.S. (1995) Multicomponent diffusion in basaltic melts. Geochimica et Cosmochimica Acta 59, 313–324. https://doi.org/10.1016/0016-7037(94)00286-U
Show in context DMgO as a function of T at ∼2.2 and ∼4.5 wt. % water at 1 GPa, compared to DMgO in dry basalt at 1 atm (Kress and Ghiorso, 1995), dry MORB at 0.47–1.42 GPa (Chen and Zhang, 2008), and a hydrous DMgO data point (Newcombe et al., 2020).
View in article
Our measured DMgO values at ∼4.5 wt. % are roughly one order of magnitude higher than those reported in dry MORB at high pressures (Chen and Zhang, 2008) and up to two orders of magnitude higher than DMgO in dry basalt at 1 atm (Kress and Ghiorso, 1995) (Fig. 3).
View in article
Mungall, J.E. (2002) Empirical models relating viscosity and tracer diffusion in magmatic silicate melts. Geochimica et Cosmochimica Acta 66, 125–143. https://doi.org/10.1016/S0016-7037(01)00736-0
Show in context This could explain our observations if Mg is transported through the melt as MgO. Finally, we note that our results (Fig. S-4) align with theoretical predictions and the literature (Watson, 1981; Mungall, 2002; Holycross et al., 2018) by showing that as dissolved water content increases, the activation energy of MgO diffusion decreases.
View in article
Mungall, J.E., Dingwell, D.B., Chaussidon, M. (1999) Chemical diffusivities of 18 trace elements in granitoid melts. Geochimica et Cosmochimica Acta 63, 2599–2610. https://doi.org/10.1016/S0016-7037(99)00209-4
Show in context Our results demonstrate that element diffusion rates in silicate melts are positively correlated with dissolved water content, in agreement with many other studies (e.g., Mungall et al., 1999; Holycross and Watson, 2018; Troch et al., 2024).
View in article
Newcombe, M.E., Fabbrizio, A., Zhang, Y., Ma, C., Le Voyer, M., Guan, Y., Eiler, J.M., Saal, A.E., Stolper, E.M. (2014) Chemical zonation in olivine-hosted melt inclusions. Contributions to Mineralogy and Petrology 168, 1030. https://doi.org/10.1007/s00410-014-1030-6
Show in context In contrast, chemical zonation profiles in olivine hosted MIs provide practical advantages to study the systematics of various magmatic settings on Earth (e.g., Watson and Baker, 1991; Costa and Chakraborty, 2004; Newcombe et al., 2014, 2020; Costa et al., 2020; Wallace et al., 2021) and Mars (e.g., Saper and Stolper, 2020) because they record the diffusion of MgO in the silicate melt during post-entrapment crystallisation of olivine on MIs walls.
View in article
The resulting concentration gradients can be leveraged as a powerful chronometer for quantifying the timescales of magma ascent and other relatively rapid volcanic processes (e.g., Newcombe et al., 2014, 2020; Saper and Stolper, 2020).
View in article
Newcombe et al. (2014, 2020) have investigated chemical gradients in olivine hosted MIs from ocean island and arc volcanoes by applying the data set of Chen and Zhang (2008) to calculate cooling rates and track the thermal histories of volcanic eruptions.
View in article
MgO diffusion chronometry is uniquely poised to unlock community knowledge of magma ascent rates and the timescales of other syn-eruptive volcanic processes (Newcombe et al., 2014, 2020; Saper and Stolper, 2020) because it is not orientation dependent and its diffusion behaviour appears to be relatively simple compared to other crystalline chronometers (e.g., Barth et al., 2023).
View in article
Newcombe, M.E., Plank, T., Zhang, Y., Holycross, M., Barth, A., Lloyd, A.S., Ferguson, D., Houghton, B.F., Hauri, E. (2020) Magma Pressure-Temperature-Time Paths During Mafic Explosive Eruptions. Frontiers in Earth Science 8, 531911. https://doi.org/10.3389/feart.2020.531911
Show in context In contrast, chemical zonation profiles in olivine hosted MIs provide practical advantages to study the systematics of various magmatic settings on Earth (e.g., Watson and Baker, 1991; Costa and Chakraborty, 2004; Newcombe et al., 2014, 2020; Costa et al., 2020; Wallace et al., 2021) and Mars (e.g., Saper and Stolper, 2020) because they record the diffusion of MgO in the silicate melt during post-entrapment crystallisation of olivine on MIs walls.
View in article
The resulting concentration gradients can be leveraged as a powerful chronometer for quantifying the timescales of magma ascent and other relatively rapid volcanic processes (e.g., Newcombe et al., 2014, 2020; Saper and Stolper, 2020).
View in article
Newcombe et al. (2014, 2020) have investigated chemical gradients in olivine hosted MIs from ocean island and arc volcanoes by applying the data set of Chen and Zhang (2008) to calculate cooling rates and track the thermal histories of volcanic eruptions.
View in article
To account for the effects of H2O on MgO diffusion, Newcombe et al. (2020) conducted one additional experiment using a hydrous basaltic andesite melt at 1225 °C and 1 GPa.
View in article
DMgO as a function of T at ∼2.2 and ∼4.5 wt. % water at 1 GPa, compared to DMgO in dry basalt at 1 atm (Kress and Ghiorso, 1995), dry MORB at 0.47–1.42 GPa (Chen and Zhang, 2008), and a hydrous DMgO data point (Newcombe et al., 2020).
View in article
Additionally, we note that the datum of Newcombe et al. (2020) for MgO diffusion in a basaltic andesite melt of initial 3.8 wt. % H2O plots along our ∼2.2 wt. % Arrhenius relationship.
View in article
Newcombe et al. (2020) did not determine the post-experiment concentration of H2O in their melt, so it is possible that their sample did not maintain its initial H2O content.
View in article
MgO diffusion chronometry is uniquely poised to unlock community knowledge of magma ascent rates and the timescales of other syn-eruptive volcanic processes (Newcombe et al., 2014, 2020; Saper and Stolper, 2020) because it is not orientation dependent and its diffusion behaviour appears to be relatively simple compared to other crystalline chronometers (e.g., Barth et al., 2023).
View in article
Plank, T., Kelley, K.A., Zimmer, M.M., Hauri, E.H., Wallace, P.J. (2013) Why do mafic arc magmas contain ∼4 wt% water on average? Earth and Planetary Science Letters 364, 168–179. https://doi.org/10.1016/j.epsl.2012.11.044
Show in context Our results can be applied to model the thermal histories and eruptive styles of global arc magmas, which contain 4 wt. % H2O on average, but span from 1–6 wt. % (Plank et al., 2013).
View in article
Rasmussen, D.J., Plank, T.A., Wallace, P.J., Newcombe, M.E., Lowenstern, J.B. (2020) Vapor-bubble growth in olivine-hosted melt inclusions. American Mineralogist 105, 1898–1919. https://doi.org/10.2138/am-2020-7377
Show in context Our results may also be useful in evaluating post-entrapment processes (e.g., cooling, decompression, crystallisation) that lead to vapour bubble growth in MIs (Rasmussen et al., 2020).
View in article
Saper, L.M., Stolper, E.M. (2020) Controlled Cooling‐Rate Experiments on Olivine‐Hosted Melt Inclusions: Chemical Diffusion and Quantification of Eruptive Cooling Rates on Hawaii and Mars. Geochemistry, Geophysics, Geosystems 21, e2019GC008772. https://doi.org/10.1029/2019GC008772
Show in context In contrast, chemical zonation profiles in olivine hosted MIs provide practical advantages to study the systematics of various magmatic settings on Earth (e.g., Watson and Baker, 1991; Costa and Chakraborty, 2004; Newcombe et al., 2014, 2020; Costa et al., 2020; Wallace et al., 2021) and Mars (e.g., Saper and Stolper, 2020) because they record the diffusion of MgO in the silicate melt during post-entrapment crystallisation of olivine on MIs walls.
View in article
The resulting concentration gradients can be leveraged as a powerful chronometer for quantifying the timescales of magma ascent and other relatively rapid volcanic processes (e.g., Newcombe et al., 2014, 2020; Saper and Stolper, 2020).
View in article
MgO diffusion chronometry is uniquely poised to unlock community knowledge of magma ascent rates and the timescales of other syn-eruptive volcanic processes (Newcombe et al., 2014, 2020; Saper and Stolper, 2020) because it is not orientation dependent and its diffusion behaviour appears to be relatively simple compared to other crystalline chronometers (e.g., Barth et al., 2023).
View in article
Shea, T., Ruth, D., Jollands, M., Ohtaki, K., Ishii, H., Bradley, J. (2023) The presence of silicate melt may enhance rates of cation diffusion in olivine. Earth and Planetary Science Letters 621, 118370. https://doi.org/10.1016/j.epsl.2023.118370
Show in context The diffusion of MgO in hydrous basaltic andesite will bracket the magmatic histories recorded by Fe-Mg exchange (Dohmen et al., 2007; Shea et al., 2023) and H+ diffusion in olivine (Barth et al., 2019) (Fig. 4).
View in article
Stolper, E. (1982) The speciation of water in silicate melts. Geochimica et Cosmochimica Acta 46, 2609–2620. https://doi.org/10.1016/0016-7037(82)90381-7
Show in context The positive relationship between element diffusivities in melt and dissolved water content is a result of melt depolymerisation — as H2O dissociates, it reacts with bridging oxygen in the melt by rupturing Si-O-Si linkages and forming hydroxyl groups (Stolper, 1982).
View in article
Troch, J., Huber, C., Kueter, N., Guillong, M., Ackerson, M., Ulmer, P., Bachmann, O. (2024) The effect of water on alkali trace element diffusion (Li, Rb, Cs) in silicic melts. Geochimica et Cosmochimica Acta 365, 101–113. https://doi.org/10.1016/j.gca.2023.11.031
Show in context Our results demonstrate that element diffusion rates in silicate melts are positively correlated with dissolved water content, in agreement with many other studies (e.g., Mungall et al., 1999; Holycross and Watson, 2018; Troch et al., 2024).
View in article
Linear relationships between measured D and dissolved H2O are not uncommon and have been recorded for alkali diffusion in silicate melts (Watson, 1979; Troch et al., 2024).
View in article
Truckenbrodt, J., Johannes, W. (1999) H2O loss during piston-cylinder experiments. American Mineralogist 84, 1333–1335. https://doi.org/10.2138/am-1999-0909
Show in context This was expected, as noble metals and graphite are not perfect containers for H2O (or rather H2; e.g., Truckenbrodt and Johannes, 1999).
View in article
Wallace, P.J., Plank, T., Bodnar, R.J., Gaetani, G.A., Shea, T. (2021) Olivine-Hosted Melt Inclusions: A Microscopic Perspective on a Complex Magmatic World. Annual Review of Earth and Planetary Sciences 49, 465–494. https://doi.org/10.1146/annurev-earth-082420-060506
Show in context In contrast, chemical zonation profiles in olivine hosted MIs provide practical advantages to study the systematics of various magmatic settings on Earth (e.g., Watson and Baker, 1991; Costa and Chakraborty, 2004; Newcombe et al., 2014, 2020; Costa et al., 2020; Wallace et al., 2021) and Mars (e.g., Saper and Stolper, 2020) because they record the diffusion of MgO in the silicate melt during post-entrapment crystallisation of olivine on MIs walls.
View in article
Watson, E.B. (1979) Diffusion of Cesium Ions in H2O-Saturated Granitic Melt. Science 205, 1259–1260. https://doi.org/10.1126/science.205.4412.1259
Show in context Linear relationships between measured D and dissolved H2O are not uncommon and have been recorded for alkali diffusion in silicate melts (Watson, 1979; Troch et al., 2024).
View in article
Watson, E.B. (1981) Diffusion in magmas at depth in the Earth: The effects of pressure and dissolved H2O. Earth and Planetary Science Letters 52, 291–301. https://doi.org/10.1016/0012-821X(81)90184-9
Show in context The use of dry melt data to estimate the thermal histories of H2O-bearing magmas is not entirely appropriate because the presence of dissolved H2O enhances diffusion rates (e.g., Watson, 1981), resulting in rapidly increased diffusivity as more dissolved water is incorporated into the melt.
View in article
Above ∼3 wt. % dissolved H2O, the function of log10 D and dissolved water content has previously shown to be asymptotic for most cations (Watson, 1981).
View in article
Watson (1981) noted that diffusivities of very fast diffusing elements tend to be less inflated by the addition of dissolved water compared to slow diffusing elements, indicating there could be an upper limit to element diffusion speeds in melts.
View in article
This could explain our observations if Mg is transported through the melt as MgO. Finally, we note that our results (Fig. S-4) align with theoretical predictions and the literature (Watson, 1981; Mungall, 2002; Holycross et al., 2018) by showing that as dissolved water content increases, the activation energy of MgO diffusion decreases.
View in article
Watson, E.B., Baker, D.R. (1991) Chemical Diffusion in Magmas: An Overview of Experimental Results and Geochemical Applications. In: Perchuk, L.L., Kushiro, I. (Eds.) Physical Chemistry of Magmas. Springer, New York, 120–151. https://doi.org/10.1007/978-1-4612-3128-8_4
Show in context In contrast, chemical zonation profiles in olivine hosted MIs provide practical advantages to study the systematics of various magmatic settings on Earth (e.g., Watson and Baker, 1991; Costa and Chakraborty, 2004; Newcombe et al., 2014, 2020; Costa et al., 2020; Wallace et al., 2021) and Mars (e.g., Saper and Stolper, 2020) because they record the diffusion of MgO in the silicate melt during post-entrapment crystallisation of olivine on MIs walls.
View in article
Watson, E.B., Cherniak, D.J., Thomas, J.B., Hanchar, J.M., Wirth, R. (2016) Crystal surface integrity and diffusion measurements on Earth and planetary materials. Earth and Planetary Science Letters 450, 346–354. https://doi.org/10.1016/j.epsl.2016.06.043
Show in context San Carlos Olivine (SCO; Fo90) grains were: cored into 2.5 mm diameter rods, sliced into 0.3–0.5 mm thick discs, manually grounded with progressively finer SiC paper; then machine polished with alumina suspension and subsequently with colloidal silica to remove near surface crystal defects (following the methodology of Watson et al., 2016).
View in article
Zhang, Y., Behrens, H. (2000) H2O diffusion in rhyolitic melts and glasses. Chemical Geology 169, 243–262. https://doi.org/10.1016/S0009-2541(99)00231-4
Show in context Error calculations are explained in SI. Experimental durations were corrected following effective time calculation methods from Zhang and Behrens (2000).
View in article
Zhang, Y., Ni, H., Chen, Y. (2010) Diffusion Data in Silicate Melts. Reviews in Mineralogy and Geochemistry 72, 311–408. https://doi.org/10.2138/rmg.2010.72.8
Show in context Zhang et al. (2010) also suggest that the log10 D of neutral species varies linearly with melt water content.
View in article
top
Supplementary Information
The Supplementary Information includes:
- Tables S-1 to S-18
- Analytical Techniques
- MgO Diffusivity Constraints
- Arrhenius Relationships
- Relationships between log10DMgO and Dissolved H2O wt. %
- Supplementary Figures S-1 to S-4
- Supplementary Information References
Download the Supplementary Information (PDF)
Download Tables S-1 to S-18 (.xlsx)
Figures

Figure 1 Examples of experiment textures. Decompression cracks are present in all experiments. Quench crystals are largest in high temperature experiments. (a) BSE image of SCO9 at 1550 °C. Zoomed in panel shows crystals at the olivine melt interface that formed upon quench. (b) BSE image of SCO3 at 1350 °C illustrating dendritic quench crystals near the interface. (c) BSE image of SCO13 at 1175 °C showing clusters of smaller quench crystals near the interface.

Figure 2 Diffusion profile and best fit. Measured MgO concentrations are shown as black circles. Coloured line corresponds to the semi-infinite model. Inset: BSE image for SCO20; black line shows location and direction (a to a′) of one of three traverses on this sample.

Figure 3 DMgO as a function of T at ∼2.2 and ∼4.5 wt. % water at 1 GPa, compared to DMgO in dry basalt at 1 atm (Kress and Ghiorso, 1995
Kress, V.C., Ghiorso, M.S. (1995) Multicomponent diffusion in basaltic melts. Geochimica et Cosmochimica Acta 59, 313–324. https://doi.org/10.1016/0016-7037(94)00286-U
), dry MORB at 0.47–1.42 GPa (Chen and Zhang, 2008Chen, Y., Zhang, Y. (2008) Olivine dissolution in basaltic melt. Geochimica et Cosmochimica Acta 72, 4756–4777. https://doi.org/10.1016/j.gca.2008.07.014
), and a hydrous DMgO data point (Newcombe et al., 2020Newcombe, M.E., Plank, T., Zhang, Y., Holycross, M., Barth, A., Lloyd, A.S., Ferguson, D., Houghton, B.F., Hauri, E. (2020) Magma Pressure-Temperature-Time Paths During Mafic Explosive Eruptions. Frontiers in Earth Science 8, 531911. https://doi.org/10.3389/feart.2020.531911
). Colour gradient shows measured water via FTIR.
Figure 4 Timescales recorded by diffusion chronometers for mafic arc systems including Fe-Mg exchange in Fo80 (Dohmen et al., 2007
Dohmen, R., Becker, H.-W., Chakraborty, S. (2007) Fe–Mg diffusion in olivine I: experimental determination between 700 and 1,200°C as a function of composition, crystal orientation and oxygen fugacity. Physics and Chemistry of Minerals 34, 389–407. https://doi.org/10.1007/s00269-007-0157-7
), MgO in dry MORB (Chen and Zhang, 2008Chen, Y., Zhang, Y. (2008) Olivine dissolution in basaltic melt. Geochimica et Cosmochimica Acta 72, 4756–4777. https://doi.org/10.1016/j.gca.2008.07.014
), DMgO in hydrous basaltic andesite (this study, covering diffusivities at 2.2 and 4.5 wt. % H2O), and H in Fo80 olivine (Barth et al., 2019Barth, A., Newcombe, M., Plank, T., Gonnermann, H., Hajimirza, S., Soto, G.J., Saballos, A., Hauri, E. (2019) Magma decompression rate correlates with explosivity at basaltic volcanoes — Constraints from water diffusion in olivine. Journal of Volcanology and Geothermal Research 387, 106664. https://doi.org/10.1016/j.jvolgeores.2019.106664
). Timescales were modelled using inset equation with x = 20–300 μm and D was calculated at 1100 °C.