Environmental pressure from the 2014–15 eruption of Bárðarbunga volcano, Iceland
Affiliations | Corresponding Author | Cite asKeywords: volcanic gases, Holuhraun lava, emission budget, atmospheric pollution, acid rain, environmental impact
- Share this article


- Article views:15,624
Cumulative count of HTML views and PDF downloads.
- Download Citation
- Rights & Permissions
top
Abstract
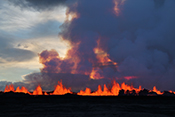
Figures and Tables
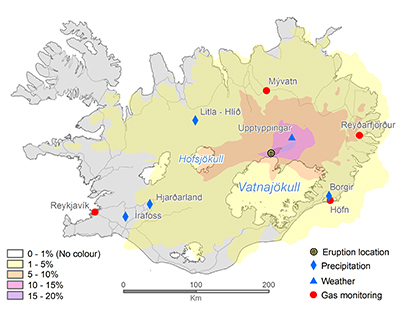 Figure 1 The modelled SO2 dispersion during the eruption, presented as the frequency of hourly concentrations higher than the 350 µg m−3 health limit. The monitoring stations mentioned in the text are also shown. | 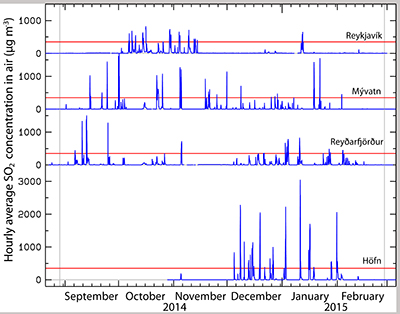 Figure 2 The SO2 concentration in air at four of the permanent gas monitoring stations presented in Figure 1. The 350 µg m−3 health limit is shown by the red horizontal line. The grey vertical lines mark the eruption period. Permanent SO2 monitoring started at Höfn 28 October 2014. | 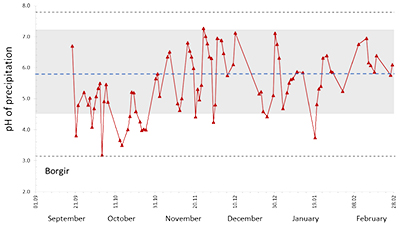 Figure 3 The pH of precipitation at Borgir during the eruption (Figs. 1 and S-1). The blue dashed line represents the average pH (5.8) and the shaded background the pH range for the eruption free period 2005-2009 at the Írafoss monitoring station (Figs. 1 and S-1). The two grey dashed lines depict the variation in pH during the eruption from the monitoring stations shown in Figure S-1. |  Figure 4 The Cl, SO4, F, and Al concentration in melted snow (Fig. S-1) versus in situ pH (0.1 °C). The black dot represents the pH (5.54) of pure water equilibrated with 395 ppmv of CO2 at 0.1 °C. |
| Figure 1 | Figure 2 | Figure 3 | Figure 4 |
Supplementary Figures and Tables
 Figure S-1 Location of the various monitoring stations in Iceland. The stations mentioned in text are shown in Figure 1. | 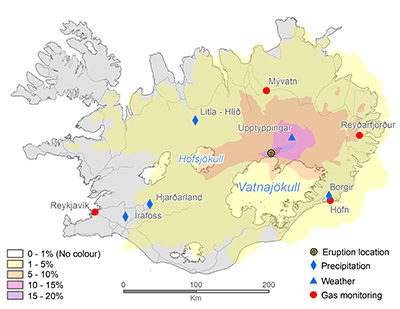 Figure S-2 The SO2 dispersion during the eruption modelled by CALPUFF including the effect of wet deposition presented as frequency of hourly concentrations higher than the 350 µg m−3 health limit. The monitoring stations mentioned in the text are also shown. | 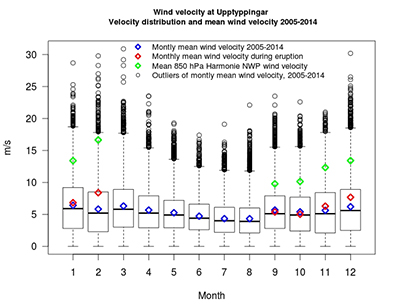 Figure S-3 The wind velocity distribution measured at 10.5 m height from the ground at the Upptyppingar weather station (Fig. S-2). The box plots show the median, lower and upper quartiles (25 % and 75 %) as well as minimum, maximum and outliers. The blue diamonds depict the calculated monthly average wind velocity for the long term time series (1 March 2005 ‒ 28 February 2014), the red diamonds the calculated monthly average wind velocity during the eruption period (1 September 2014 ‒ 27 February 2015) and the green diamonds the Harmonie 850 hPa Numerical Weather Prediction (NWP) wind velocity at about 1200- 1500 m a.s.l. over Upptyppingar during the eruption. |  Table S-1 Total magma effusion and gas emissions, average rates, first weeks’ rates, and December‒January rates. |  Table S-2 SO2 ground‒level gas concentrations in air in Europe. |
| Figure S-1 | Figure S-2 | Figure S-3 | Table S-1 | Table S-2 |
top
Introduction
Iceland is one of the most active volcanic regions on Earth, with more than 30 active volcanic systems erupting about 20 times, and producing more than 5 km3 magma per century (Thordarson and Hoskuldsson, 2008
Thordarson, T., Hoskuldsson, A. (2008) Postglacial volcanism in Iceland. Jökull 58, 197–228.
). These eruptions can have significant effects upon the natural and human environment. Many of the volcanoes are covered with glaciers and often generate volcanic ash and occasionally, "Amazonian" sized floods (~200,000 m3 s−1). Because of Iceland’s location and prevailing winds, volcanic ash and gases can pollute the atmosphere and disturb air traffic over Western Europe (EC, 2010EC (2010) Volcano crisis report, online report, 30 June. European Commission, Brussels. http://ec.europa.eu/transport/ ash_cloud_crisis_en.htm.
). The ash fallout and floods can both fertilise and pollute surface waters (Flaathen and Gislason, 2007Flaathen, T.K., Gislason S.R. (2007) The effect of volcanic eruptions on the chemistry of surface waters: The 1991 and 2000 eruptions of Mt. Hekla, Iceland. Journal of Volcanology and Geothermal Research 164, 293–316.
).The 2014‒2015 eruption within the Bárðarbunga volcanic system began in the morning of 31 August 2014 following a minor eruption at the same site (<0.001 km3) that lasted only a few hours, two days earlier. The eruption ended on 27 February 2015 after six months of continuous activity, generated minute amounts of volcanic ash, large emissions of gases, and a basaltic lava flow referred to here as the Holuhraun lava (the largest by volume in Iceland since the 1783‒1784 Laki eruption).
The Laki eruption produced in eight months about ten times more lava and SO2 (120 Mt) than Holuhraun (Thordarson and Self, 2003
Thordarson, T., Self, S. (2003) Atmospheric and environmental effects of the 1783–1784 Laki eruption: a review and reassessment. Journal of Geophysical Research 108, NO. D1, 4011.
). The environmental pressure of the Laki eruption was enormous: in Iceland about 60 % of the grazing livestock and 20 % of the human population died (Thordarson and Self, 2003Thordarson, T., Self, S. (2003) Atmospheric and environmental effects of the 1783–1784 Laki eruption: a review and reassessment. Journal of Geophysical Research 108, NO. D1, 4011.
). The average monthly emission rates were greater than the peak global anthropogenic SO2 emission rate in 1970-1980 (133 Mt yr-1) and twice that from the combined USA, Canada, Western and Central Europe at the peak emissions in the 1970s (76 Mt yr-1; Smith et al., 2011Smith, S.J., Van Aardenne, J., Klimont, Z., Andres, R.J., Volke, A., Delgado Arias, S. (2011) Anthropogenic sulfur dioxide emissions: 1850–2005. Atmospheric Chemistry and Physics 11, 1101–1116.
). These peak man-made emissions caused severe environmental impacts including acid rain and the mobilisation of aluminium from rocks and soil, degrading aquatic and terrestrial ecosystems (Gensemer and Playle, 1999Gensemer, R.W., Playle, R.C. (1999) The bioavailability and toxicity of aluminium in aquatic environments. Critical Reviews in Environmental Science and Technology 29, 315–450.
). Since the peak, all these emissions have been declining and were down to 14.7 Mt yr-1 from USA, Canada, Western and Central Europe in 2011 (Klimont et al., 2013Klimont, Z., Smith, S.J., Cofala, J. (2013) The last decade of global anthropogenic sulfur dioxide: 2000–2011 emissions. Environmental Research Letters 8, 014003.
). This decline is confirmed by long term precipitation and air quality monitoring in South Iceland, with higher annual pH and decreasing variability, and fewer extreme incidents, in years without volcanic eruptions (Sigurdsson and Thorlacius, 2014Sigurdsson, A., Thorlacius, J.M. (2014) Niðurstöður efnagreininga á daglegum loft og úrkomusýnum frá Írafossi 2008–2011. Icelandic Meteorological Office Technical report ÁSig/JMTh/2014–01, 18 p.
). Furthermore, the average dissolved river water sulphur concentration was reduced by 40 % from 1970 to 2004 (Gislason and Torssander, 2006Gislason, S.R., Torssander, P. (2006) The response of Icelandic river sulfate concentration and isotope composition, to the decline in global atmospheric SO2 emission to the North Atlantic region. Environmental Science and Technology 40, 680–686.
).The 2014‒2015 Bárðarbunga eruption provides an opportunity to study the environmental pressure from a relatively large emission source. Direct gas measurements and petrologic gas estimates along with detailed field observations and modelling allow this eruption to be compared with large historical eruptions that caused major environmental problems. Here we report on the effusion rate, gas emissions, and the environmental pressure from this eruption.
top
Results
Methods are described in the Supplementary Information and include: location of the monitoring stations in Iceland (Fig. S-1), gas emission measurements (Table S-1), ground-level SO2 gas concentrations in Europe (Table S-2), SO2 dispersion during the eruption including the effect of precipitation (Fig. S-2) and wind‒speed distribution over the year at the eruption site (Fig. S-3).
The lava and effusion rate. Apart from modest fire fountaining in the first few weeks, the volcanic activity was effusive, forming a lava flow that advanced 17 km towards NNE in 15 days. As time progressed, further lobes of lava developed and grew rapidly in surface area. During December and January thickening by inflation was prominent with a much slower areal growth rate (Fig. S-1). At the end of the eruption, the lava covered an area of 84.1 ± 0.6 km2 and its volume was 1.6 ± 0.3 km3. Using a bulk lava density of 2600 kg m–3, the total mass erupted was (4.2 ± 0.8) × 1012 kg. The average magma flow rate for the 181 days of eruption was 100 m3 s–1 and mass flow rate 2.7 × 10⁵ kg s–1. During the first weeks, the flow rate was two to three times the average, while flow rates of 50‒80 m3 s–1 occurred in December and January followed by gradual decline in February leading to the termination on 27 February 2015.
The erupted lava is olivine tholeiite and its composition was constant during the eruption. The rock is poor in macrocrystals, and is mainly plagioclase but olivine and clinopyroxene occur in minor amounts. The groundmass is composed of silicate glass and microcrystals of plagioclase, clinopyroxene, and olivine. The sulphur-rich nature of the lava is reflected by Fe-rich sulphide globules in the groundmass. The H2O content of melt inclusions is as high as 0.5 wt. % whereas CO2 reaches 900 ppm. Groundmass glass contains 0.1 wt. % H2O and no CO2. The pure CO2 inclusions, associated with melt inclusions, indicate that the basalt was CO2 saturated when the inclusions were trapped from partially degassed basalt before, and deeper than, the onset of H2O and S degassing. The CO2 saturation occurred at approximately 3 kbar pressure (~9 km depth).
Petrologic estimates of gas emission. Taking into account the average extrusion rate, the total H2O and CO2 outputs were 16.8 ± 3.6 and 6.33 ± 1.7 Mt respectively, giving average emission rates of 1074 ± 231 and 405 ± 106 kg s-1. The integrated SO2 emission was 10.7 ± 3.0 Mt and average emission rate was 684 ± 193 kg s-1. Chlorine degassing was uncertain but a maximum atmospheric load was estimated as 0.1 Mt HCl, yielding an average flux of 6.4 kg s-1. No HF degassing can be inferred from the lava. All of these fluxes changed over time as shown in Table S-1 in the Supplementary Information.
Direct measurements of gas emissions. The emission rate of SO2 was monitored from the beginning of the eruption with ground–based DOAS (Differential Optical Absorption Spectroscopy) and the ratio of SO2 to CO2, H2S, H2 and H2O were measured with MultiGAS. Ten complete DOAS traverses were made 80–240 km from the vent (Fig. S-1) between 21 September and 4 February. These show a temporal decrease in SO2 emissions 1400–100 kg s-1. Applying a linear fit to the data (r2 = 0.76), yields 11.8 ± 4.1 Mt of SO2 emission during the eruption. Eleven MultiGAS acquisitions of sufficient quality were made during 30 August–21 January. The eleven CO2/SO2 ratios and five H2O/SO2 ratios decrease over time. The measured eruption plume became enriched in SO2 relative to CO2 and H2O, even though the total emission of SO2 decreased. This reflects changes at the vent, less glacier melting with time, and the increasing distance from vent to sampling stations as the lava field extended (Fig. S-1). Knowing that 11.8 ± 4.1 Mt of SO2 were emitted, and the MultiGAS ratios, the total emissions of CO2 and H2O were 5.6 ± 3.6 and 284 ± 193 Mt respectively. The emissions are not exclusively magmatic in origin, particularly in the beginning of the eruption when there was a large contribution from meteoric water.
Air quality simulations and measurements. Variable wind conditions have played a major role in gas distribution over Iceland. The CALPUFF air quality model, initialised with emission rates estimated from the DOAS measurements, has been used to simulate the dispersal of the SO2 cloud and its surface concentration. The results are presented in Figure 1 as the frequency of hourly concentrations higher than the 350 µgm‒3 limit (Icelandic Health Regulation, 2002
Icelandic Health Regulation 251/2002 (2002) http://www.reglugerd.is/interpro/dkm/WebGuard.nsf/key2/251–2002).
). The values corresponding to each contour show how many times this concentration has been exceeded at each location during this period. Gas pollution has been extensive across all of Iceland. The NE part of the country has suffered the highest impact from the eruption. The model suggests that an area 50 km NE of the eruption site exceeded 350 µg m‒3 for up to 20 % of the time (about 30 days in total). The northern part of Vatnajökull and the eastern part of Hofsjökull glaciers have frequently been exposed to high ground-level concentrations of SO2 for up to 15 days.
Figure 1 The modelled SO2 dispersion during the eruption, presented as the frequency of hourly concentrations higher than the 350 µg m−3 health limit. The monitoring stations mentioned in the text are also shown.
Prior to the Holuhraun eruption, the ground–level concentration of atmospheric SO2 in Iceland had never been recorded as exceeding the 350 µg m–3 hourly limit. The first permanent monitoring station was installed in 1968. During the eruption, predicted and measured values repeatedly surpassed this limit (Figs. 1 and 2). Much higher instantaneous SO2 peaks were frequently measured on all mobile stations (Fig. S-1), the highest being 21,000 µg m–3 in Höfn. Continuous measurements started 28 October 2014 in Höfn as shown in Figure 2. There the hourly averaged concentration reached a maximum of 3050 µg m‒3 on 11 January 2015. Over the monitoring periods shown in Figure 2, SO2 exceeded the 350 µg m–3 threshold 2.0 % of the time at Mývatn (for 17 consecutive hours and a total of 86 hours), 1.4 % in Reyðarfjörður (for 10 consecutive hours and a total of 58 hours), 1.4 % in Reykjavík (for 8 consecutive hours and a total of 59 hours) and 4.2 % of the time in Höfn (for 16 consecutive hours and a total of 124 hours). The last unambiguous detection of the volcanic plume was at the Mývatn station on February 18. Gas emissions from Holuhraun increased ground-level SO2 concentrations in Europe in September 2014 (Schmidt et al., 2015
Schmidt, A., Witham, C., Leadbetter, S., Theys, N., Hort, M., Thordarson, T., Stevenson J., Shepherd, J., Sinnott, R., Kenny, P., Barsotti, S. (2015) Long range transport and air quality impacts of SO2 emissions from Holuhraun (Bárdarbunga, Iceland). Geophysical Research Abstracts 17, EGU 2015–14866‒1.
, Tables S-1 and S-2), when the eruption intensity was high.
Figure 2 The SO2 concentration in air at four of the permanent gas monitoring stations presented in Figure 1. The 350 µg m−3 health limit is shown by the red horizontal line. The grey vertical lines mark the eruption period. Permanent SO2 monitoring started at Höfn 28 October 2014.
Dissolved constituents in precipitation. During the eruption, 648 precipitation samples were collected from 21 stations (Fig. S-1). Low pH values were mainly observed in Southern Iceland, the lowest was 3.2, at Borgir near Höfn (Figs. 3, 1 and S-1). At Írafoss, a long term air quality and precipitation monitoring station in the SW, the average pH was 5.4 (4.0–6.6) with 25 % of the samples having a pH lower than 5, during the eruption. This value is lower than that recorded in years not influenced by volcanic eruptions (2005–2009) when the pH was 5.8 (4.5–7.7). Many of the pH measurements done during the eruption were high due to dust-water interactions as detailed in the Supplementary Information. At Írafoss, during the eruption, the average concentration of SO4 was 426 µM (range 1.8–12,270) and F 17.7 µM (range <0.2–444). These values are 39 and 68 times greater than those recorded in previous years (11 µM, range 2.5–27) and (0.26 µM, range 0.01–1.7) for SO4 and F respectively. The stations with the most elevated SO4 and F concentrations were Litla‒Hlíð and Hjarðarland (Fig. 1).

Figure 3 The pH of precipitation at Borgir during the eruption (Figs. 1 and S-1). The blue dashed line represents the average pH (5.8) and the shaded background the pH range for the eruption free period 2005-2009 at the Írafoss monitoring station (Figs. 1 and S-1). The two grey dashed lines depict the variation in pH during the eruption from the monitoring stations shown in Figure S-1.
The conductivity and pH of the melted snow collected in the vicinity of the Holuhraun lava ranged over 5–234 µS cm-1 and 3.34−4.85 respectively. The snow was acidified by H2SO4, HCl, and HF (Fig. 4). About half of the anions were balanced by protons (H+) and the rest by cations such as Al3+, Fe3+, Fe2+, Na+, Ca2+, and Mg2+ derived from water soluble metal salts. The overall sea spray concentration addition was less than 5.15 µM for Cl. The concentrations of F, Al, Fe, Mn, Cd, Cu, and Pb in the snow surpassed drinking-water standards (European Community, 1998
European Community (1998) Council directive 98/83. Official Journal of the European Communities.
).
Figure 4 The Cl, SO4, F, and Al concentration in melted snow (Fig. S-1) versus in situ pH (0.1 °C). The black dot represents the pH (5.54) of pure water equilibrated with 395 ppmv of CO2 at 0.1 °C.
top
Discussion
The eruption intensity declined continuously from start to finish (Table S-1). In that period gas pollution affected most of Iceland (Fig. 1) and occasionally reached Europe (Table S-2; Schmidt et al., 2015
Schmidt, A., Witham, C., Leadbetter, S., Theys, N., Hort, M., Thordarson, T., Stevenson J., Shepherd, J., Sinnott, R., Kenny, P., Barsotti, S. (2015) Long range transport and air quality impacts of SO2 emissions from Holuhraun (Bárdarbunga, Iceland). Geophysical Research Abstracts 17, EGU 2015–14866‒1.
). Although Northern Iceland more frequently experienced high SO2 concentrations, the lowest pH of precipitation was measured in the south. This could be due to differences in exposure time to light and humidity between relatively the high and low latitude travel paths of the plume, resulting in discrepancies in the oxidation rate of SO2 and rain acidification (Lelieveld 1993Lelieveld, J. (1993) Multi–phase processes in the atmospheric sulphur cycle. In: Wollast, R., Mackenzie, F.T., Chou, L. (Eds.) Interactions of C, N, P and S Biogeochemical Cycles and Global Change , Springer–Verlag, Berlin–Heidelberg, 305-331.
; Schmidt et al., 2010Schmidt, A., Carslaw, K.S., Mann, G.W., Wilson, M., Breider, T.J., Pickering, S.J., Thodarson, T. (2010) The impact of the 1783–1784 AD Laki eruption on global aerosol formation processes and cloud condensation nuclei. Atmosheric Chemistry and Physics 10, 6025–6041.
). Furthermore suspension of dust, and the resulting water‒particle interactions could raise pH (Gislason and Eugster 1987Gislason, S.R., Eugster, H.P. (1987) Meteoric water–basalt interactions: I. A laboratory study. Geochimica et Cosmochimica Acta 51, 2827–2840.
), reducing the solubility of most polluting metals. Iceland is one of the most active dust sources on Earth with dust flux of 30–40 Mt per year (Arnalds et al., 2014Arnalds, O., Olafsson, H., Dagsson‒Waldhauserova, P. (2014) Quantification of iron–rich volcanogenic dust emissions and deposition over ocean from Icelandic dust sources. Biogeosciences Discussion 11, 5941–5967.
) mainly coming from the glacier outwash planes.The concentration of dissolved metal salts in the melted snow was equal to that of the acids. These metals are soluble at low pH and can both pollute and fertilise surface waters. For example, the highest Al concentration in Figure 4 is about 5 times greater than the Al concentration that decreases the life expectancy of salmon fry by 50 % (Gensemer and Playle, 1999
Gensemer, R.W., Playle, R.C. (1999) The bioavailability and toxicity of aluminium in aquatic environments. Critical Reviews in Environmental Science and Technology 29, 315–450.
). The frequent low pressure systems passing over Iceland provided strong winds (Fig. S-3), fast dispersion of the eruption plume, dust suspension, and thaw periods, preventing build‒up of pollutants in the snow pack at low altitude. However, pollutants may have accumulated in the snow at high altitude. The first fraction of meltwater in the spring can contain more than five times the average snowpack concentration of pollutants, and may enter streams and lakes without contact with soil (Johannessen and Hendriksen, 1978Johannessen, M., Hendriksen, A. (1978) Chemistry of snow meltwater: changes in concentration during melting. Water Resources Research 14, 615‒619.
).Petrologic estimates and direct measurements of SO2 and CO2 emission from Holuhraun are in agreement. This lends credence to the petrologic emission rates estimated for historical eruptions (e.g., Thordarson and Self, 2003
Thordarson, T., Self, S. (2003) Atmospheric and environmental effects of the 1783–1784 Laki eruption: a review and reassessment. Journal of Geophysical Research 108, NO. D1, 4011.
). Based on this evidence, the Holuhraun emissions were an order of magnitude lower than the Laki emissions that started 8 June 1783. The average wind speed is higher in winter than summer (Fig. S-3), thus the Holuhraun eruption produced faster-dispersing plumes. Because of reduced autumn-winter sunlight hours, a smaller per cent of emitted SO2 had the potential to be oxidised under dry conditions to H2SO4 in the Holuhraun eruption compared with the Laki eruption (Schmidt et al., 2010Schmidt, A., Carslaw, K.S., Mann, G.W., Wilson, M., Breider, T.J., Pickering, S.J., Thodarson, T. (2010) The impact of the 1783–1784 AD Laki eruption on global aerosol formation processes and cloud condensation nuclei. Atmosheric Chemistry and Physics 10, 6025–6041.
). During winter there is perhaps greater environmental and human health risk from SO2 than from sulphate aerosol particles due to reduced conversion efficiency, whereas in summer the aerosol particle effects may dominate.top
Conclusions
The location and timing of the Holuhraun eruption in many ways minimised its impact on humans and the environment. It was located: 1) far away from inhabited parts of the island, 2) just north of the Vatnajökull glacier edge which narrowly escaped volcanic ash deposition and ensuing floods, 3) in the glacier’s rain shadow leading to relatively low H2SO4 formation since oxidation of SO2 is slow in dry air compared to humid (Lelieveld 1993
Lelieveld, J. (1993) Multi–phase processes in the atmospheric sulphur cycle. In: Wollast, R., Mackenzie, F.T., Chou, L. (Eds.) Interactions of C, N, P and S Biogeochemical Cycles and Global Change , Springer–Verlag, Berlin–Heidelberg, 305-331.
), 4) in an abundant, acid–neutralising dust source. The eruption occurred at a time when: 5) vegetation growth was at its minimum, 6) grazing animals were moving towards lower altitudes, 7) SO2 oxidation in dry air was minimised due to limited sunlight in autumn‒winter, and 8) average wind speeds were high, dispersing the plume and mobilising dust.Because of these factors, the environmental pressure of the Holuhraun eruption is expected to be moderate, while large enough to be measurable because the rate of SO2 emitted from this point source was considerably greater than current anthropogenic emission rate in Europe.
top
Acknowledgements
Funding for the research came from the Icelandic government via the Icelandic Civil Protection Agency, the EC FP7 Framework programme via the Futurevolc project, the Swedish Research Council FORMAS supported the DOAS measurements and The French centre of excellence "Clervolc" programme financed the microprobe analysis. We are grateful to the Environmental Protection Agency in Ireland, the National Institute for Public Health and the Environment in the Netherlands, the Belgian Interregional Environment Agency, the Department for Environment Food & Rural Affairs in UK, and the Environment Agency of Austria for ground–level SO2 concentration data in air in the respective countries. Thanks to Svava B. Thorlaksdóttir, Gudmunda M. Sigurdardóttir, Vilhjálmur Kjartansson, Thorgils Ingvarsson, Bergur H. Bergsson, Sandra Ó. Snæbjörnsdóttir, and Nahum Clements for making various measurements. We are grateful to Bogi B. Björnsson for graphic support, Rebecca Neely for text editing, Anja Schmidt, Evgenia Ilyinskaya and an anonymous reviewer for constructive reviews and finally Liane G. Benning for editing the paper.
Editor: Liane G. Benning
top
References
Arnalds, O., Olafsson, H., Dagsson‒Waldhauserova, P. (2014) Quantification of iron–rich volcanogenic dust emissions and deposition over ocean from Icelandic dust sources. Biogeosciences Discussion 11, 5941–5967.
 Show in context
 Iceland is one of the most active dust sources on Earth with dust flux of 30–40 Mt per year (Arnalds et al., 2014) mainly coming from the glacier outwash planes.
View in article
EC (2010) Volcano crisis report, online report, 30 June. European Commission, Brussels. http://ec.europa.eu/transport/ ash_cloud_crisis_en.htm.
 Show in context
 Because of Iceland’s location and prevailing winds, volcanic ash and gases can pollute the atmosphere and disturb air traffic over Western Europe (EC, 2010).
View in article
European Community (1998) Council directive 98/83. Official Journal of the European Communities.
 Show in context
 The concentrations of F, Al, Fe, Mn, Cd, Cu, and Pb in the snow surpassed drinking-water standards (European Community, 1998).
View in article
Flaathen, T.K., Gislason S.R. (2007) The effect of volcanic eruptions on the chemistry of surface waters: The 1991 and 2000 eruptions of Mt. Hekla, Iceland. Journal of Volcanology and Geothermal Research 164, 293–316.
 Show in context
 The ash fallout and floods can both fertilise and pollute surface waters (Flaathen and Gislason, 2007).
View in article
Gensemer, R.W., Playle, R.C. (1999) The bioavailability and toxicity of aluminium in aquatic environments. Critical Reviews in Environmental Science and Technology 29, 315–450.
 Show in context
 These peak man-made emissions caused severe environmental impacts including acid rain and the mobilisation of aluminium from rocks and soil, degrading aquatic and terrestrial ecosystems (Gensemer and Playle, 1999).
View in article
For example, the highest Al concentration in Figure 4 is about 5 times greater than the Al concentration that decreases the life expectancy of salmon fry by 50 % (Gensemer and Playle, 1999).
View in article
Gislason, S.R., Eugster, H.P. (1987) Meteoric water–basalt interactions: I. A laboratory study. Geochimica et Cosmochimica Acta 51, 2827–2840.
 Show in context
 Furthermore suspension of dust, and the resulting water‒particle interactions could raise pH (Gislason and Eugster 1987), reducing the solubility of most polluting metals.
View in article
Gislason, S.R., Torssander, P. (2006) The response of Icelandic river sulfate concentration and isotope composition, to the decline in global atmospheric SO2 emission to the North Atlantic region. Environmental Science and Technology 40, 680–686.
 Show in context
 Furthermore, the average dissolved river water sulphur concentration was reduced by 40 % from 1970 to 2004 (Gislason and Torssander, 2006).
View in article
Icelandic Health Regulation 251/2002 (2002) http://www.reglugerd.is/interpro/dkm/WebGuard.nsf/key2/251–2002.
 Show in context
 The results are presented in Figure 1 as the frequency of hourly concentrations higher than the 350 µgm‒3 limit (Icelandic Health Regulation, 2002).
View in article
Johannessen, M., Hendriksen, A. (1978) Chemistry of snow meltwater: changes in concentration during melting. Water Resources Research 14, 615‒619.
 Show in context
 The first fraction of meltwater in the spring can contain more than five times the average snowpack concentration of pollutants, and may enter streams and lakes without contact with soil (Johannessen and Hendriksen, 1978).
View in article
Klimont, Z., Smith, S.J., Cofala, J. (2013) The last decade of global anthropogenic sulfur dioxide: 2000–2011 emissions. Environmental Research Letters 8, 014003.
 Show in context
 Since the peak, all these emissions have been declining and were down to 14.7 Mt yr-1 from USA, Canada, Western and Central Europe in 2011 (Klimont et al., 2013).
View in article
Lelieveld, J. (1993) Multi–phase processes in the atmospheric sulphur cycle. In: Wollast, R., Mackenzie, F.T., Chou, L. (Eds.) Interactions of C, N, P and S Biogeochemical Cycles and Global Change , Springer–Verlag, Berlin–Heidelberg, 305-331.
 Show in context
 This could be due to differences in exposure time to light and humidity between relatively the high and low latitude travel paths of the plume, resulting in discrepancies in the oxidation rate of SO2 and rain acidification (Lelieveld 1993; Schmidt et al., 2010).
View in article
It was located: 1) far away from inhabited parts of the island, 2) just north of the Vatnajökull glacier edge which narrowly escaped volcanic ash deposition and ensuing floods, 3) in the glacier’s rain shadow leading to relatively low H2SO4 formation since oxidation of SO2 is slow in dry air compared to humid (Lelieveld, 1993), 4) in an abundant, acid–neutralising dust source.
View in article
Schmidt, A., Carslaw, K.S., Mann, G.W., Wilson, M., Breider, T.J., Pickering, S.J., Thodarson, T. (2010) The impact of the 1783–1784 AD Laki eruption on global aerosol formation processes and cloud condensation nuclei. Atmosheric Chemistry and Physics 10, 6025–6041.
 Show in context
 This could be due to differences in exposure time to light and humidity between relatively the high and low latitude travel paths of the plume, resulting in discrepancies in the oxidation rate of SO2 and rain acidification (Lelieveld 1993; Schmidt et al., 2010).
View in article
Because of reduced autumn-winter sunlight hours, a smaller per cent of emitted SO2 had the potential to be oxidised under dry conditions to H2SO4 in the Holuhraun eruption compared with the Laki eruption (Schmidt et al., 2010).
View in article
Schmidt, A., Witham, C., Leadbetter, S., Theys, N., Hort, M., Thordarson, T., Stevenson J., Shepherd, J., Sinnott, R., Kenny, P., Barsotti, S. (2015) Long range transport and air quality impacts of SO2 emissions from Holuhraun (Bárdarbunga, Iceland). Geophysical Research Abstracts 17, EGU 2015–14866‒1.
 Show in context
 Gas emissions from Holuhraun increased ground-level SO2 concentrations in Europe in September 2014 (Schmidt et al., 2015, Tables S-1 and S-2), when the eruption intensity was high.
View in article
In that period gas pollution affected most of Iceland (Fig. 1) and occasionally reached Europe (Table S-2; Schmidt et al., 2015).
View in article
Sigurdsson, A., Thorlacius, J.M. (2014) Niðurstöður efnagreininga á daglegum loft og úrkomusýnum frá Írafossi 2008–2011. Icelandic Meteorological Office Technical report ÁSig/JMTh/2014–01, 18 p.
 Show in context
 This decline is confirmed by long term precipitation and air quality monitoring in South Iceland, with higher annual pH and decreasing variability, and fewer extreme incidents, in years without volcanic eruptions (Sigurdsson and Thorlacius, 2014).
View in article
Smith, S.J., Van Aardenne, J., Klimont, Z., Andres, R.J., Volke, A., Delgado Arias, S. (2011) Anthropogenic sulfur dioxide emissions: 1850–2005. Atmospheric Chemistry and Physics 11, 1101–1116.
 Show in context
 The average monthly emission rates were greater than the peak global anthropogenic SO2 emission rate in 1970-1980 (133 Mt yr-1) and twice that from the combined USA, Canada, Western and Central Europe at the peak emissions in the 1970s (76 Mt yr-1; Smith et al., 2011).
View in article
Thordarson, T., Self, S. (2003) Atmospheric and environmental effects of the 1783–1784 Laki eruption: a review and reassessment. Journal of Geophysical Research 108, NO. D1, 4011.
 Show in context
 The Laki eruption produced in eight months about ten times more lava and SO2 (120 Mt) than Holuhraun (Thordarson and Self, 2003).
View in article
The environmental pressure of the Laki eruption was enormous: in Iceland about 60 % of the grazing livestock and 20 % of the human population died (Thordarson and Self, 2003).
View in article
This lends credence to the petrologic emission rates estimated for historical eruptions (e.g., Thordarson and Self, 2003).
View in article
Thordarson, T., Hoskuldsson, A. (2008) Postglacial volcanism in Iceland. Jökull 58, 197–228.
 Show in context
 Iceland is one of the most active volcanic regions on Earth, with more than 30 active volcanic systems erupting about 20 times, producing more than 5 km3 magma per century (Thordarson and Hoskuldsson, 2008).
View in article
top
Supplementary Information
Methods
Lava. Estimates of the volume of lava are based on measurements of both area and thickness.
Lava area. The spatial growth of the lava has been monitored using remote sensing data, from an aircraft of the Icelandic Coast Guard which is equipped with a synthetic aperture radar (SAR), and from signals given by various satellites. The SAR images have been particularly useful as the rough surface of the lava contrasts sharply with the alluvial plains on which most of the lava is emplaced. These remote sensing images have been georeferenced using distinct topographical features at known locations. The errors in the area determination are considered less than 1 km2 (~1 %).
Lava volume. The thickness of lava has been estimated using surface height determinations of the lava at several locations. The lava field surface has been measured repeatedly using an aircraft–based system (Gudmundsson et al., 2007
Gudmundsson, M.T., Högnadóttir, Th., Kristinsson, A.B., Gudbjörnsson, S. (2007) Geothermal activity in the subglacial Katla caldera, Iceland, 1999–2005, studied with radar altimetry. Annals of Glaciology 45, 66–72.
) of combined submeter differential GPS and ground clearance radar of the survey aircraft of Isavia (the Icelandic civil aviation service). Survey lines have been flown at about 1 km spacing with a ground clearance height of 70–120 m, giving the surface height at about 15 m spacing along each line. The aircraft data have been supplemented with ground measurements of lava edge height at multiple locations and limited kinematic GPS profiling near the edges. The ground data have been used to correct systematic shifts of 2–4 m observed in the radar data. The resulting heights have an error of 2–4 m locally with the uncertainty in the estimated average thickness of the lava of 2–3 m (10–15 %). A digital elevation model (DEM) of the lava surface is generated from a hand-drawn map obtained from interpolation of lava surface elevation between survey lines. A DEM of the pre–eruption topography (a TerraSarX map generated by DLR) is then subtracted from the lava surface DEM to obtain thickness. By integrating the thickness over the area of the lava, a total volume is obtained.Rock composition and petrologic estimation of gas emission rates. The mineralogy and composition of the lava have been described by Gudfinnsson et al. (2015)
Gudfinnsson, G.H., Halldórsson, S.A, Bali, E., Jakobsson, S., Sverrisdóttir, G., Höskuldsson A., Riishuus, M.S., Thordarsson, Th. (2015) Geochemistry of the Nornahraun eruption of the Bárðarbunga volcanic system, Iceland. Geophysical Research Abstracts 17, EGU 2015–12309-1.
, Halldórsson et al. (2015)Halldórsson, S.A., Gudfinnsson, G.H., Bindeman, Y., Sverirsdóttir, G., Bali, E., Jakobbsson, S., Höskuldsson A., Riishuus, M.S., Sigurdsson G., Thordarsson, Th. (2015) Geochemistry of the Nornahraun eruption of the Bárðarbunga volcanic system, Iceland. Geophysical Research Abstracts 17, EGU 2015–11542‒1.
and Bali et al. (2015)Bali, E., Sigmarsson, O., Jakobsson, S., Gunnarsson, H. (2015) Volatile budget of the Nornahraun eruption of the Bárðarbunga system, Iceland. Geophysical Research Abstracts 17, EGU 2015–5757‒1.
. Thirty polished rock samples from throughout the eruption were analysed in detail by optical and scanning electron microscopy. The H2O and CO2–contents of glasses were determined by Fourier Transform Infrared (FTIR) spectroscopy on tephra samples collected between 31 August and 11 November 2014. The fluid phase and individual fluid inclusions were analysed by Raman Spectroscopy. For these analyses, phenocrysts and groundmass glass were handpicked and doubly polished. Melt inclusions in the phenocrysts were left unexposed and glass thickness was measured optically with the help of a universal stage. The FTIR measurements were carried out using a Bruker IFS 66 FTIR spectrometer at the University of Iceland and a Bruker IFS 120 HR spectrometer at the Bayerisches Geoinstitut, Bayreuth, Germany. Both spectrometers were equipped with an infrared microscope. The resolution of each measurement was 4 cm–1 and the spot size varied from 30 to 100 µm. Four hundred scans were collected for each spectrum. Fluid inclusions within the minerals and fluid bubbles in the melt inclusions were studied by confocal Raman spectroscopy, Horiba Jobin Yvon LabRAM HR800, 514 nm Ar laser with 200 mW output power, 1800 mm grating, 500 µm confocal pinhole, and 50x long–distance objective at the Bayerisches Geoinstitut, Bayreuth, Germany. The uncertainty of the H2O concentration measurement is 8 %, the CO2 17 %, and the lava mass 20 %. Thus the associated error on the H2O fluxes is 22 %, and the CO2 flux 26 %.The well-known relationship between sulphur saturation and iron concentrations in tholeiitic basalt glass was used to estimate the sulphur yield (ΔS) from sulphide–saturated flood basalts (Blake et al., 2010
Blake, S., Self, S., Sharma, K., Sephton S. (2010) Sulfur release from the Columbia River Basalt and other flood lava eruptions constrained by a model of sulfide saturation. Earth and Planetary Science Letters 299, 328–338.
). The ΔS is related to total FeOtotal concentration in a melt saturated with sulphides by:Eq. S-1
The iron concentration was measured by electron microprobe as detailed in Sigmarsson (2015)
Sigmarsson, O. (2015) Shallow lateral magma migration or not during the Bárðarbunga 2014 activity and preceding the Flæðahraun eruption: the geochemical perspective. Geophysical Research Abstracts 17, EGU2015‒9624‒1.
. Sixteen glass analyses gave an average FeOtotal of 13.7 wt. %. The total atmospheric SO2 mass loading can then be estimated by scaling the sulphur yield to the mass of magma erupted. The integrated SO2 atmospheric mass loading over the time of the eruption was calculated as follows:Eq. S-2
where MM denotes molecular mass of the sulphur species and ΔS the sulphur yield. Error on the lava mass and ΔS are estimated as 20 % in both cases. Thus the associated error on the SO2 yield is 28 %. The SO2 flux estimate concurs with independent estimates based on melt inclusions (Haddadi et al., 2015
Haddadi, B., Moune, S., Sigmarsson, O.,Gauthier, P.‒J., Gouhier, M. (2015) Pre-eruptive volatile and erupted gas phase characterization of the 2014 basalt of Bárðarbunga volcanic system, Iceland. Geophysical Research Abstracts 17, EGU 2015–9572‒1.
), satellite data (Gouhier et al., 2015Gouhier, M., Gauthier, P.‒J., Haddadi, B., Moune, M., Sigmarsson, O. (2015) Retrieval of lava and SO2 fluxes during long‒lived effusive eruptions using MSG-SEVIRI: the case of Bárdarbunga 2014 activity. Geophysical Research Abstracts 17, EGU 2015‒9955‒1.
), and the DOAS measurements reported in the current study. Haddadi et al. (2015)Haddadi, B., Moune, S., Sigmarsson, O.,Gauthier, P.‒J., Gouhier, M. (2015) Pre-eruptive volatile and erupted gas phase characterization of the 2014 basalt of Bárðarbunga volcanic system, Iceland. Geophysical Research Abstracts 17, EGU 2015–9572‒1.
show that electron microprobe (EMP) volatile analyses of the melt inclusions (MI) yield fluorine below the detection limit but chlorine concentrations as high as 178 ppm. The pre-eruptive volatile concentrations are estimated from the average concentrations in the clinopyroxene-hosted MI. A crude estimate of potential chlorine degassing can be made by assuming that the lowest concentration in the groundmass glass represents the final residual content. In this assumption, the highest concentrations in groundmass glass reflect uncompleted degassing. Although the petrologic method of estimating F fluxes is not very sensitive, the effect of a relatively small volatile F magmatic flux on precipitation is easily detected compared to SO2 and Cl magmatic fluxes, since F- is a trace anion in most precipitation while Cl- and SO42- are the major anions.Direct measurements of gas emission rates. The emission rate of SO2 was monitored during the eruption with ground–based DOAS (Differential Optical Absorption Spectroscopy) and the ratio of SO2 to CO2, H2S, H2, and H2O was measured with MultiGAS. The conditions for carrying out ground–based gas measurements are particularly challenging: a remote location, an optically dense plume with high SO2 and H2O column amounts, low UV intensity, frequent clouds and precipitation, an extensive and hot lava field, and infrequent grounding of the plume near–source. To accommodate these challenges, three different DOAS techniques were used: 1) continuously scanning NOVAC (Network for Observation of Volcanic and Atmospheric Change) DOAS instruments which operate within 15 km of the main vent, 2) near–source campaign DOAS measurements carried out close to the main plume, and 3) far–field campaign DOAS traverses made along the main ring–road at 80–240 km distance from the main vent as shown in Figure S-1. Results obtained using this third approach are presented here.

Figure S-1 Location of the various monitoring stations in Iceland. The stations mentioned in text are shown in Figure 1.
DOAS traverses. An Ocean Optics MayaPro2000 spectrometer was connected to a telescope via a quartz fibre which was mounted on the roof of a car. The car speed and direction was obtained by GPS. Seventeen traverses were made when the winds were appropriate for producing a cohesive plume and there was no precipitation. The advantages of the far–field traverse method include: less condensed water in the atmospheric column, thereby reducing the impact of scattering on the instrument retrievals; the column amount of SO2 is diluted as the plume ages and moves downwind, so the shorter wavelengths are not saturated in SO2; and traverses are not directly dependent on an estimate of plume height to calculate emission rate, knowledge of the plume height is however indirectly needed to determine the wind speed for the calculations. The disadvantages of this method include that these measurements can only be made when winds transport a coherent plume to intersect with the ring road and it is not precipitating; the plume at these distances from the vent is so wide that over the time it takes to complete one traverse, the plume may have moved; and at the same time the short day light during winter restricts the number of traverses that can be made during one day. The data was analysed using the MobileDOAS software developed at Chalmers University of Technology, following standard DOAS procedures (Galle et al., 2003
Galle, B., Oppenheimer, C., Geyer, A., McGonigle, A., Edmonds, M., Horrocks, L. (2003) A miniaturised ultraviolet spectrometer for remote sensing of SO2 fluxes: a new tool for volcano surveillance. Journal of Volcanology and Geothermal Research 119, 241–254.
; Johansson et al., 2008Johansson, M., Galle, B., Yu, T., Tang, L., Chen, D. Li, H., Jin, H., Li, X., Zhang, Y. (2008) Quantification of total emission of air pollutants from Beijing using ground based optical remote sensing. Atmospheric Environment 42, 6926–6933.
). Of these 17 traverses, only 10 passed completely through the plume and were of high enough quality to be used (three completed in the first weeks and seven more in the period December–February). These traverses were made between 21 September 2014 and 4 February 2015. The wind direction was calculated by the software based on the location of the greatest measured SO2 peak and the main vent in Holuhraun ‘Baugur’. The height of the plume was determined using the best–fit of wind direction measured by the DOAS traverse and the winds simulated by the HARMONIE meteorological model (Pálmason et al., 2013Pálmason, B., Petersen, G.N., Thorsteinsson, H., Thorsteinsson, S. (2013) Experiences of Harmonie at IMO. ALADIN – HIRLAM Newsletter 1, 52–63.
) with model level elevations between 1000 and 500 hPa (corresponding to the surface and 5600 m a.s.l considering a standard atmosphere). The HARMONIE wind speed at the time and location of the highest measured SO2 peak and the determined plume height was used to calculate the emission rate from the measured SO2 columns. The average error over the whole eruption is estimated to be 38 % based on a linear fit to the time series.Gas ratios measured with MultiGAS. Eleven MultiGAS acquisitions were obtained between 30 August 2014 and 21 January 2015 when the measured SO2 concentration was greater than 8500 µg m−3, the minimum threshold for reliable data. Eight acquisitions were taken in the first weeks and three more were completed in January 2015. The MultiGAS (Aiuppa et al., 2005
Aiuppa, A., Federico, C., Giudice, G. Gurrieri, S. (2005) Chemical mapping of a fumarolic field: La Fossa Crater, Vulcano Island (Aeolian Islands, Italy). Geophysical Research Letters 32, L13309.
) is built of three electrochemical sensors recording SO2, H2S, and H2 from City Technology, an infrared IR CO2 sensor provided by Edinburgh Instruments and a humidity and temperature sensor. The instrument is operated for half an hour inside the gas plume, preceded by at least a 10 minute warm up cycle. After acquisition, the data was detrended and analysed for ratios between the measured gases and the calculated H2O concentration. The water concentration in the gas was calculated indirectly by measuring the relative humidity, pressure, and temperature (Tamburello, 2015Tamburello, G. (2015) Ratiocalc: Software for processing data from multicomponent volcanic gas analyzers, doi:10.1016/j.cageo.2015.05.004.
). Ratios are determined as reliable if the r2 value was greater than 0.5. The measurements were only possible when the plume was grounded near source. Thirteen days spent in the field yielded 11 ratios between CO2 and SO2 and five ratios between H2O and SO2. There is a distinct change in ratios after the beginning of the eruption. The values measured within the first four days are averaged to represent the beginning of the eruption (molar ratios CO2/SO 2 = 4.2 and H2O/SO2 = 278) and the later values are averaged to represent the rest of the eruption (molar ratios CO2/SO2 = 0.5 and H2O/SO2 = 75). The average error over the whole eruption is calculated to be 53 % for CO2/SO2 and 58 % for H2O/SO2 using the ratio and r2 values. The associated error for CO2 and H2O emission measured by the combination of DOAS and MultiGas is 65 % and 69 % respectively.Predicted gas distribution. The CALPUFF modelling system (Scire et al., 2000
Scire, J.S., Strimaitis, D.G., Yamartino, R.J. (2000) A User’s Guide for the CALPUFF Dispersion Model, Earth Tech, Inc., Concord, Mass (available at http://www.src.com/calpuff/download/CALPUFF_UsersGuide.pdf).
) was used to simulate the dispersal and deposition of the volcanic gas plume in the atmosphere. The model describes the release of specific amounts of gases, discretised as a series of packets, and their temporal advection and deposition within a 3D computational domain. To forecast the SO2 plume produced by the eruption at Holuhraun, CALPUFF has been run on a 175 x 125 grid with a spatial resolution of 4 km and a temporal resolution of one hour. Meteorological forecast data, provided by the European Centre for Medium–Range Weather Forecasts (ECMWF), with a resolution of 0.125°, have been used to initialise the simulations. In order to properly describe the ongoing eruption, and estimate its potential impact on the ground, SO2 emission rates have been based on DOAS measurements and on a best fit with the concentration measured at the gas monitoring stations shown in Figure S-1 in the Supplementary Information. Across the considered time period the average fluxes, used as input to the model to forecast the impact on a regional scale, have decreased from 240 kg s-1 in September–October, to 115 kg s-1 November to January, and finally to 30 kg s-1 in February. Indeed CALPUFF inversion simulations suggest that only the fraction of SO2 released up to 500 m above the ground (10–20 % of total) is affecting the surface concentration at distances up to hundreds of km from the eruption site. As a consequence the fluxes reported here refer only to the amount of gas released below this altitude. The simulation outcomes are very sensitive to the gas flux used to initialise the model, as a consequence an uncertainty within the flux estimation will affect the model accuracy.In order to evaluate the effect of wet precipitation on deposition process a second set of simulations has been done. The new results (Fig. S-2) differ in a minor way from those obtained including only dry deposition (Fig. 1) and confirm the same areal extension of gas pollution across Iceland. In addition, continuous monitoring of SO2 concentration in the air confirms most of these predictions with agreements equal to 72 % at Mývatn, 83 % in Reyðarfjörður, 82 % in Höfn, and 91 % Reykjavík (Figs. 1 and 2).
Simulation results have been used by the Icelandic Meteorological Office (IMO) to produce three-day long forecast maps of SO2 ground concentration over Iceland twice a day. They have been publically available on the IMO’s website: http://en.vedur.is/weather/forecasts/gas–model/. The simulations have also been used, applying a MonteCarlo approach, to assess the hazard due to a prolonged eruption and to help define the area most vulnerable to high gas concentrations surrounding the eruption site.

Figure S-2 The SO2 dispersion during the eruption modelled by CALPUFF including the effect of wet deposition presented as frequency of hourly concentrations higher than the 350 µg m−3 health limit. The monitoring stations mentioned in the text are also shown.
Wind velocity at the Upptyppingar weather station and velocity distribution before and during the eruption. Wind velocity was measured before and during the eruption at the Upptyppingar station located 38 km north‒east of the eruption site at 563 m a.s.l (65°03.639' N, 16°12.624' W Figs. 1 and S-2). The wind velocity was measured by standard Young anemometer, with accuracy of ±0.3 m s−1 and detection limit of 1.1 m s−1. Figure S-3 shows wind velocity distribution measured 10.5 m above the ground at Upptyppingar. The box plots show the median and lower and upper quartiles (25 % and 75 %) as well as minimum, maximum, and outliers. The blue diamonds depict the calculated monthly average wind velocity for the long term time series (1 March 2005–28 February 2014), the red diamonds the calculated monthly average wind velocity during the eruption period (1 September 2014–27 February 2015) and the green diamonds the Harmonie 850 hPa Numerical Weather Prediction (NWP) wind velocity at about 1200–1500 m a.s.l. over the Holuhraun craters during the eruption. The eruption site is at about 740 m a.s.l. This figure underscores the fact that the average wind velocity at 10.5 m from the ground and extreme wind speeds are higher and more common in the winter than in the summer. Furthermore, the mean predicted wind speed at 650–850 m above the eruption site increases nearly continuously from September to February.

Figure S-3 The wind velocity distribution measured at 10.5 m height from the ground at the Upptyppingar weather station (Fig. S-2). The box plots show the median, lower and upper quartiles (25 % and 75 %) as well as minimum, maximum and outliers. The blue diamonds depict the calculated monthly average wind velocity for the long term time series (1 March 2005‒28 February 2014), the red diamonds the calculated monthly average wind velocity during the eruption period (1 September 2014‒27 February 2015) and the green diamonds the Harmonie 850 hPa Numerical Weather Prediction (NWP) wind velocity at about 1200‒1500 m a.s.l. over Upptyppingar during the eruption.
Direct measurements of atmospheric SO2 concentration in Iceland and Europe before and during the eruption. At the beginning of the eruption the ambient air concentration of SO2 was measured at 11 permanent stations across Iceland recording 10 and 60 minutes average concentration. Seven of the stations continuously streamed the results to the website of the Environmental Agency of Iceland (EAI) http://airquality.is. By late January 2015 the number of these stations had risen to 21. Their locations are shown by the red dots in Figure S-1 in the Supplementary Information. Several monitoring stations, run mostly by the local police using hand held meters, have been operated throughout the eruption and are shown by red half-filled circles in Figure S-1. Examples of the results collected from four of the permanent stations at Mývatn, Reyðarfjörður, Höfn, and Reykjavík are shown in Figure 2. The locations of these four stations are shown by red dots in Figure 1. The station furthest to the east at Reyðarfjördur can be affected by a nearby located aluminium smelter, resulting in three small peaks before the eruption (Fig. 2). All permanent instruments are trace level (ppb) SO2 analysers equipped with pulsed fluoresence spectroscopy meters (Mývatn: Recordum Airpointer SO2 analyser. Reyðarfjörður: Thermo 43i SO2 analyser. Höfn Thermo 450 SO2/H2S analyser. Grensásvegur Reykjavík: Horiba APSA–360A SO2/H2S analyser). All of the analysers are calibrated at six month intervals, the detection limit is at 2 µg m-3 and the uncertainty is 5 %. The stations at Mývatn, Reyðarfjörður, and Reykjavík (Fig. 1) were all in operation before the onset of the eruption, some of them with years of operational time. The first permanent monitoring station in Iceland was installed south of Reykjavík in 1968. That station collected samples on filters yielding daily average concentrations. The first online SO2 station was deployed in Reykjavík 1991. The station in Höfn was installed after this eruption started on 28 October 2014. Prior to that, the SO2 concentration in Höfn was monitored with a mobile Tango TX1 gas detector. The mobile detectors are not as accurate as the permanent SO2 analysers. The uncertainty of the mobile Tango sensors might be as high as ±300 µg m-3.
Gas emissions from the Holuhraun eruption resulted in an increase in ground‒level SO2 concentrations in the UK and Ireland during two occasions in September 2014 (Schmidt et al., 2015
Schmidt, A., Witham, C., Leadbetter, S., Theys, N., Hort, M., Thordarson, T., Stevenson J., Shepherd, J., Sinnott, R., Kenny, P., Barsotti, S. (2015) Long range transport and air quality impacts of SO2 emissions from Holuhraun (Bárdarbunga, Iceland). Geophysical Research Abstracts 17, EGU 2015–14866‒1.
). Examples of the highest peaks during these events are shown from two monitoring stations in Table S-2, along with examples from monitoring stations in the Netherlands, Belgium, and Austria. These stations are equipped with pulsed fluorescence spectrometers with similar detection limits and uncertainty as the Icelandic stations. During 22 September the ground-level concentrations were highest in Austria at 235µg m-3. The Masenberg station in Austria is a background station at a high elevation and far away from local emission sources and rarely records SO2 concentrations in excess of 30 µg m-3. On this day unusually high concentrations were measured at most of the 30 monitoring stations in Austria.Composition of precipitation. Precipitation was sampled from about 21 stations run by the Icelandic Meteorological Office (IMO) weather station network using traditional precipitation gauges. Their locations are depicted by the blue diamonds in Figure S-1. In addition, historical data available for specific sites have been used to identify divergence between samples affected by the Holuhraun eruption and the background. The pH was measured with a WTW pH meter 330/SET–1 equipped with a SenTix 41 combined electrode at 23 ± 2 °C. Samples for F, Cl, and SO4 were filtered and analysed by ion chromatography using an IC–2000 (Dionex/Thermo Fisher). Detection limits were 1, 3, and 1 µM for F, Cl, and SO4 respectively and the relative error for a concentration higher than ten times the detection limit was 5 %. The sample collection and analysis methods are based on an emergency response strategy and therefore the sampling method may have some weaknesses; 1) the frequency and constancy of sampling differs from site to site, 2) the samplers are open during the preceding dry–period so samples may be affected by dry deposition including basaltic glass, the most common dust material in Iceland (Arnalds et al., 2014
Arnalds, O., Olafsson, H., Dagsson‒Waldhauserova, P. (2014) Quantification of iron–rich volcanogenic dust emissions and deposition over ocean from Icelandic dust sources. Biogeosciences Discussion 11, 5941–5967.
) and, 3) most samples were sent to Reykjavík for analysis, in some cases with a delay of few days often caused by adverse local environmental conditions. Therefore, it is likely that the pH measured in the laboratory is on average higher than the in situ pH. Basaltic glass-water interaction will raise the pH of the precipitation, but to a much lesser degree the Cl, F, and SO4 concentrations, since their concentration is relatively low in basaltic glass (Gislason and Eugster, 1987Gislason, S.R., Eugster, H.P. (1987) Meteoric water–basalt interactions: I. A laboratory study. Geochimica et Cosmochimica Acta 51, 2827– 2840.
; and this paper). Despite these weaknesses the sampling process fulfilled the requirement of a fast response, adequate coverage of the country, and to some extent mimics the very first precipitation-dust (basaltic glass) interactions within the river catchments.Composition of snow. Fresh snow samples were collected around the Holuhraun lava field (Fig. S-1) into 1 M HCl acid and deionised water cleaned heavy-walled 30 L low density polyethylene bags. At each sampling site 1–10 kg of snow was collected and the sample bags were then covered with large bags of snow to prevent melting of the samples during transit. Samples were kept frozen at -18 °C until they were melted by immersing the plastic bags into hot water at 60 °C for 20–40 minutes depending on amount of snow. Once all the snow was melted at temperature close to 0 °C, the sample bag was immediately pulled out of the hot water and the meltwater filtrated through 0.2 µm Millipore cellulose acetate membranes using a peristaltic pump, pre−cleaned silicone tubing, and a 140 mm Sartorius® polytetrafluoropropylene filter holder. At least 1 L of meltwater was pumped through the filtration unit before the samples were collected. Acid washed high−density polypropylene bottles or vials (depending on the volume of sampled water) were used to collect samples for cation and trace metal analyses. Low and high−density polyethylene bottles or vials were used to collect samples for the other dissolved element measurements. All of the sampling bottles were pre-contaminated several times with the meltwater. Meltwater samples collected for major‒ and trace metal analysis were acidified using Suprapur® 0.5 % (v/v) HNO3. Air tight amber glass bottles were used to collect filtered samples for pH and dissolved inorganic carbon (DIC) measurements. These samples were stored in the dark at 4 °C until measured. The pH was determined within 48 hours of melting the snow using an Oakton pH electrode. The IC–2000 Dionex ion chromatograph was used to measure DIC, F−, Cl− and SO42−. The cations and trace metals were measured using the in−house Spectro Cirus Vision inductively coupled plasma, optical emission spectrometer (ICP−OES), with an in–house standard, and checked against the SPEX Certified Reference Standard. All samples were also analysed by ICP−OES and inductively coupled plasma sector field mass spectrometer (ICP−SFMS) at ALS Scandinavia, Luleå, Sweden. Chemical speciation, charge imbalance, and in situ pH were calculated using the PHREEQC computer code (Parkhurst and Appelo, 1999
Parkhurst, D.L., Appelo, C.A.J. (1999) User’s guide to PHREEQC (Version 2)—a computer program for speciation, batch–reaction, one–dimensional transport, and inverse geochemical calculations. U.S. Geological Survey Water–Resources Investigations Report 99–4259, 312 p.
). The partial pressure of CO2 in unpolluted atmosphere was assumed to be 395 ppmv. The pH of pure water in equilibrium with this atmospheric CO2 is 5.54 at 0.1 °C and 5.61 at 25 °C. The average charge imbalance of the meltwater was -5.4 %. The low Si concentration, ≤14 µM, suggests insignificant dissolution of basalt particles during melting of the snow.Table S-1 Total magma effusion and gas emissions, average rates, first weeks’ rates, and December‒January rates.
| Total | Average | First weeks (2.5 times average) | December-January | |||||||||
| Magma | Petrologic | DOAS | Magma | Petrologic | DOAS | Magma | Petrologic | DOAS | Magma | Petrologic | DOAS | |
| MultiGAS | MultiGAS | MultiGAS | MultiGAS | |||||||||
| Mt | Mt | Mt | kg s-1 | kg s-1 | kg s-1 | kg s-1 | kg s-1 | kg s-1 | kg s-1 | kg s-1 | kg s-1 | |
| Magma | 4200 | 2.69E+05 | 6.71E+05 | 1.75E+05 | ||||||||
| H2O | 16.8 | 284 | 1070 | 1.81E+04 | 2690 | 5.21E+04 | 698 | 1.15E+04 | ||||
| SO2 | 10.7 | 11.8 | 684 | 754 | 1710 | 1380 | 445 | 546 | ||||
| CO2 | 6.33 | 5.60 | 405 | 358 | 1010 | 1500 | 263 | 187 | ||||
| HCl | 0.10 | 6.4 | 16.0 | 4.2 | ||||||||
| HF | BD | BD | ||||||||||
Total magma volume, 1.6 ± 0.3 km3, density; 2600 kg m-3, the total mass erupted during the eruption, after 181 effusion days was (4.2 ± 0.8) · 1012kg. The average magma flow rate for the 181 days was 100 m3 s-1 with the corresponding mass flow rate being 2.7 · 105 kg s-1. During the first weeks, the flow rate was two to three times the average (2.5), while 50-80 m3 s-1 occurred in December and January (0.65 times the average), followed by gradual decline in February leading to the termination on 27 February. The error on the effusion rate is 20 %, for the petrologic gas fluxes it is; H2O 22 %, SO2 28 %, CO2 26 %, HCl ~100 % and HF was below detection (BD). The error of SO2 measured by DOAS is 38 % and the one for CO2 and H2O measured by the combination of DOAS and MultiGas is 65 % and 69 % respectively.
Download in ExcelTable S-2 SO2 ground‒level gas concentrations in air in Europe.
| Country | Station name | Latitude | Longitude | Height above sea level | Date | Distance from the eruption | Highest one hour SO2 peak |
| Ireland1 | Ennis | 52.84 | -9 | 16 m | 06.09.2014 | 1407 km | 498 µg/m3 |
| Ireland1 | Portlaoise | 53.04 | -7.29 | 98 m | 06.09.2014 | 1420 km | 343 µg/m3 |
| Netherlands2 | Philippine | 51.29 | 3.75 | 5 m | 22.09.2014 | 1905 km | 82 µg/m3 |
| Belgium3 | Ghent region | 51.15 | 3.81 | 12 m | 22.09.2014 | 1931 km | 87 µg/m3 |
| Britain4 | Wicken Fen | 52.3 | 0.29 | 3 m | 22.09.2014 | 1701 km | 96 µg/m3 |
| Austria5 | Masenberg | 47.35 | 15.89 | 1210 m | 22.09.2014 | 2754 km | 235 µg/m3 |
1Preliminary data from the Irish Environmental Protection Agency.
2Preliminary data from the National Institute for Public Health and the Environment.
3Preliminary data from the Belgian Interregional Environment Agency.
4Preliminary data from the Department for Environment Food & Rural Affairs.
5Preliminary data from the Environment Agency Austria.
Supplementary Information References
Aiuppa, A., Federico, C., Giudice, G. Gurrieri, S. (2005) Chemical mapping of a fumarolic field: La Fossa Crater, Vulcano Island (Aeolian Islands, Italy). Geophysical Research Letters 32, L13309.
 Show in context
 The MultiGAS (Aiuppa et al., 2005) is built of three electrochemical sensors recording SO2, H2S, and H2 from City Technology, an infrared IR CO2 sensor provided by Edinburgh Instruments and a humidity and temperature sensor.
View in supplementary information
Arnalds, O., Olafsson, H., Dagsson‒Waldhauserova, P. (2014) Quantification of iron–rich volcanogenic dust emissions and deposition over ocean from Icelandic dust sources. Biogeosciences Discussion 11, 5941–5967.
 Show in context
 The sample collection and analysis methods are based on an emergency response strategy and therefore the sampling method may have some weaknesses; 1) the frequency and constancy of sampling differs from site to site, 2) the samplers are open during the preceding dry–period so samples may be affected by dry deposition including basaltic glass, the most common dust material in Iceland (Arnalds et al., 2014) and, 3) most samples were sent to Reykjavík for analysis, in some cases with a delay of few days often caused by adverse local environmental conditions.
View in supplementary information
Bali, E., Sigmarsson, O., Jakobsson, S., Gunnarsson, H. (2015) Volatile budget of the Nornahraun eruption of the Bárðarbunga system, Iceland. Geophysical Research Abstracts 17, EGU 2015–5757‒1.
 Show in context
 The mineralogy and composition of the lava have been described by Gudfinnsson et al. (2015), Halldórsson et al. (2015) and Bali et al. (2015).
View in supplementary information
Blake, S., Self, S., Sharma, K., Sephton S. (2010) Sulfur release from the Columbia River Basalt and other flood lava eruptions constrained by a model of sulfide saturation. Earth and Planetary Science Letters 299, 328–338.
 Show in context
 The well-known relationship between sulphur saturation and iron concentrations in tholeiitic basalt glass was used to estimate the sulphur yield (ΔS) from sulphide–saturated flood basalts (Blake et al., 2010).
View in supplementary information
Galle, B., Oppenheimer, C., Geyer, A., McGonigle, A., Edmonds, M., Horrocks, L. (2003) A miniaturised ultraviolet spectrometer for remote sensing of SO2 fluxes: a new tool for volcano surveillance. Journal of Volcanology and Geothermal Research 119, 241–254.
 Show in context
 The data was analysed using the MobileDOAS software developed at Chalmers University of Technology, following standard DOAS procedures (Galle et al., 2003; Johansson et al., 2008).
View in supplementary information
Gislason, S.R., Eugster, H.P. (1987) Meteoric water–basalt interactions: I. A laboratory study. Geochimica et Cosmochimica Acta 51, 2827– 2840.
 Show in context
 Basaltic glass-water interaction will raise the pH of the precipitation, but to a much lesser degree the Cl, F, and SO4 concentrations, since their concentration is relatively low in basaltic glass (Gislason and Eugster, 1987; and this paper).
View in supplementary information
Gouhier, M., Gauthier, P.‒J., Haddadi, B., Moune, M., Sigmarsson, O. (2015) Retrieval of lava and SO2 fluxes during long‒lived effusive eruptions using MSG-SEVIRI: the case of Bárdarbunga 2014 activity. Geophysical Research Abstracts 17, EGU 2015‒9955‒1.
 Show in context
 The SO2 flux estimate concurs with independent estimates based on melt inclusions (Haddadi et al., 2015), satellite data (Gouhier et al., 2015), and the DOAS measurements reported in the current study.
View in supplementary information
Gudfinnsson, G.H., Halldórsson, S.A, Bali, E., Jakobsson, S., Sverrisdóttir, G., Höskuldsson A., Riishuus, M.S., Thordarsson, Th. (2015) Geochemistry of the Nornahraun eruption of the Bárðarbunga volcanic system, Iceland. Geophysical Research Abstracts 17, EGU 2015–12309-1.
 Show in context
The mineralogy and composition of the lava have been described by Gudfinnsson et al. (2015), Halldórsson et al. (2015) and Bali et al. (2015).
View in supplementary information
Gudmundsson, M.T., Högnadóttir, Th., Kristinsson, A.B., Gudbjörnsson, S. (2007) Geothermal activity in the subglacial Katla caldera, Iceland, 1999–2005, studied with radar altimetry. Annals of Glaciology 45, 66–72.
 Show in context
 The lava field surface has been measured repeatedly using an aircraft–based system (Gudmundsson et al., 2007) of combined submeter differential GPS and ground clearance radar of the survey aircraft of Isavia (the Icelandic civil aviation service).
View in supplementary information
Haddadi, B., Moune, S., Sigmarsson, O.,Gauthier, P.‒J., Gouhier, M. (2015) Pre-eruptive volatile and erupted gas phase characterization of the 2014 basalt of Bárðarbunga volcanic system, Iceland. Geophysical Research Abstracts 17, EGU 2015–9572‒1.
 Show in context
 The SO2 flux estimate concurs with independent estimates based on melt inclusions (Haddadi et al., 2015), satellite data (Gouhier et al., 2015), and the DOAS measurements reported in the current study.
View in supplementary information
Haddadi et al. (2015) show that electron microprobe (EMP) volatile analyses of the melt inclusions (MI) yield fluorine below the detection limit but chlorine concentrations as high as 178 ppm.
View in supplementary information
Halldórsson, S.A., Gudfinnsson, G.H., Bindeman, Y., Sverirsdóttir, G., Bali, E., Jakobbsson, S., Höskuldsson A., Riishuus, M.S., Sigurdsson G., Thordarsson, Th. (2015) Geochemistry of the Nornahraun eruption of the Bárðarbunga volcanic system, Iceland. Geophysical Research Abstracts 17, EGU 2015–11542‒1.
 Show in context
The mineralogy and composition of the lava have been described by Gudfinnsson et al. (2015), Halldórsson et al. (2015) and Bali et al. (2015).
View in supplementary information
Johansson, M., Galle, B., Yu, T., Tang, L., Chen, D. Li, H., Jin, H., Li, X., Zhang, Y. (2008) Quantification of total emission of air pollutants from Beijing using ground based optical remote sensing. Atmospheric Environment 42, 6926–6933.
 Show in context
The data was analysed using the MobileDOAS software developed at Chalmers University of Technology, following standard DOAS procedures (Galle et al., 2003; Johansson et al., 2008).
View in supplementary information
Pálmason, B., Petersen, G.N., Thorsteinsson, H., Thorsteinsson, S. (2013) Experiences of Harmonie at IMO. ALADIN – HIRLAM Newsletter 1, 52–63.
 Show in context
 The height of the plume was determined using the best–fit of wind direction measured by the DOAS traverse and the winds simulated by the HARMONIE meteorological model (Pálmason et al., 2013) with model level elevations between 1000 and 500 hPa (corresponding to the surface and 5600 m a.s.l considering a standard atmosphere).
View in supplementary information
Parkhurst, D.L., Appelo, C.A.J. (1999) User’s guide to PHREEQC (Version 2)—a computer program for speciation, batch–reaction, one–dimensional transport, and inverse geochemical calculations. U.S. Geological Survey Water–Resources Investigations Report 99–4259, 312 p.
 Show in context
 Chemical speciation, charge imbalance, and in situ pH were calculated using the PHREEQC computer code (Parkhurst and Appelo, 1999).
View in supplementary information
Schmidt, A., Witham, C., Leadbetter, S., Theys, N., Hort, M., Thordarson, T., Stevenson J., Shepherd, J., Sinnott, R., Kenny, P., Barsotti, S. (2015) Long range transport and air quality impacts of SO2 emissions from Holuhraun (Bárdarbunga, Iceland). Geophysical Research Abstracts 17, EGU 2015–14866‒1.
 Show in context
 Gas emissions from the Holuhraun eruption resulted in an increase in ground‒level SO2 concentrations in the UK and Ireland during two occasions in September 2014 (Schmidt et al., 2015).
View in supplementary information
Scire, J.S., Strimaitis, D.G., Yamartino, R.J. (2000) A User’s Guide for the CALPUFF Dispersion Model, Earth Tech, Inc., Concord, Mass (available at http://www.src.com/calpuff/download/CALPUFF_UsersGuide.pdf).
 Show in context
 The CALPUFF modelling system (Scire et al., 2000) was used to simulate the dispersal and deposition of the volcanic gas plume in the atmosphere.
View in supplementary information
Sigmarsson, O. (2015) Shallow lateral magma migration or not during the Bárðarbunga 2014 activity and preceding the Flæðahraun eruption: the geochemical perspective. Geophysical Research Abstracts 17, EGU2015‒9624‒1.
 Show in context
 The iron concentration was measured by electron microprobe as detailed in Sigmarsson (2015).
View in supplementary information
Tamburello, G. (2015) Ratiocalc: Software for processing data from multicomponent volcanic gas analyzers, doi:10.1016/j.cageo.2015.05.004.
 Show in context
 The water concentration in the gas was calculated indirectly by measuring the relative humidity, pressure, and temperature (Tamburello, 2015).
View in supplementary information
Figures and Tables
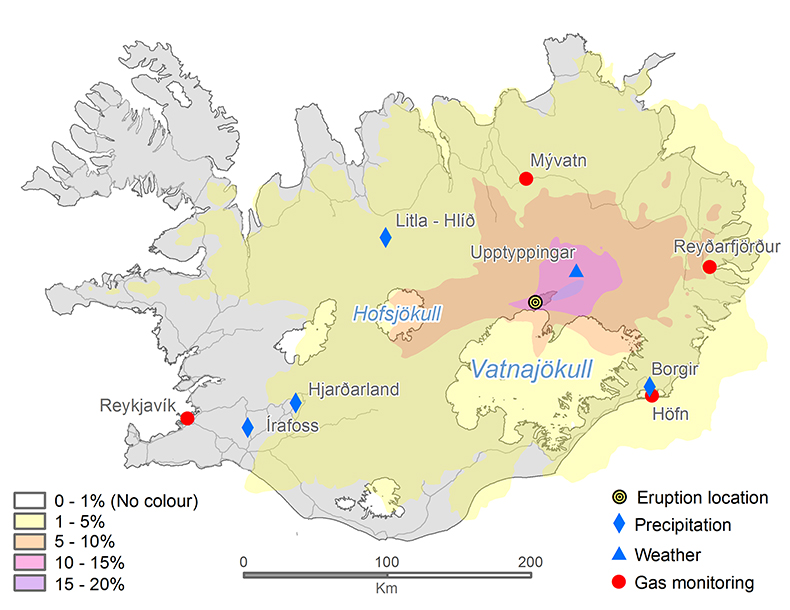
Figure 1 The modelled SO2 dispersion during the eruption, presented as the frequency of hourly concentrations higher than the 350 µg m−3 health limit. The monitoring stations mentioned in the text are also shown.
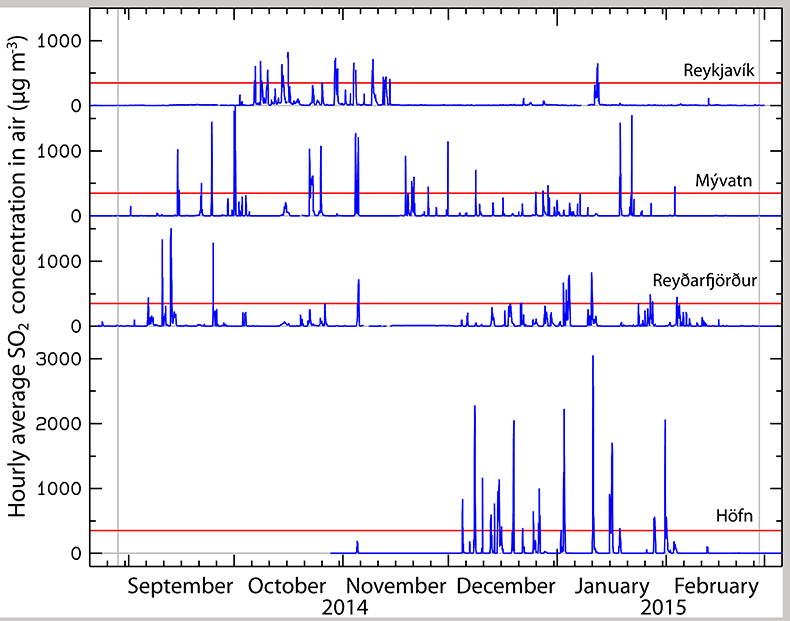
Figure 2 The SO2 concentration in air at four of the permanent gas monitoring stations presented in Figure 1. The 350 µg m−3 health limit is shown by the red horizontal line. The grey vertical lines mark the eruption period. Permanent SO2 monitoring started at Höfn 28 October 2014.
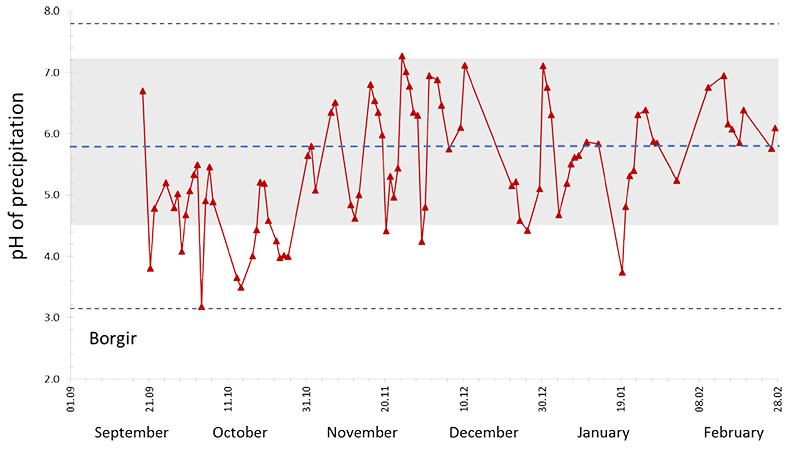
Figure 3 The pH of precipitation at Borgir during the eruption (Figs. 1 and S-1). The blue dashed line represents the average pH (5.8) and the shaded background the pH range for the eruption free period 2005-2009 at the Írafoss monitoring station (Figs. 1 and S-1). The two grey dashed lines depict the variation in pH during the eruption from the monitoring stations shown in Figure S-1.
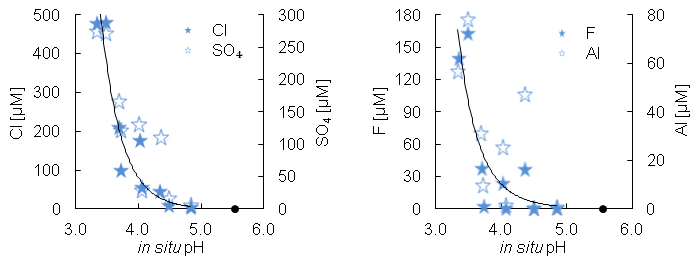
Figure 4 The Cl, SO4, F, and Al concentration in melted snow (Fig. S-1) versus in situ pH (0.1 °C). The black dot represents the pH (5.54) of pure water equilibrated with 395 ppmv of CO2 at 0.1 °C.
Back to article
Supplementary Figures and Tables
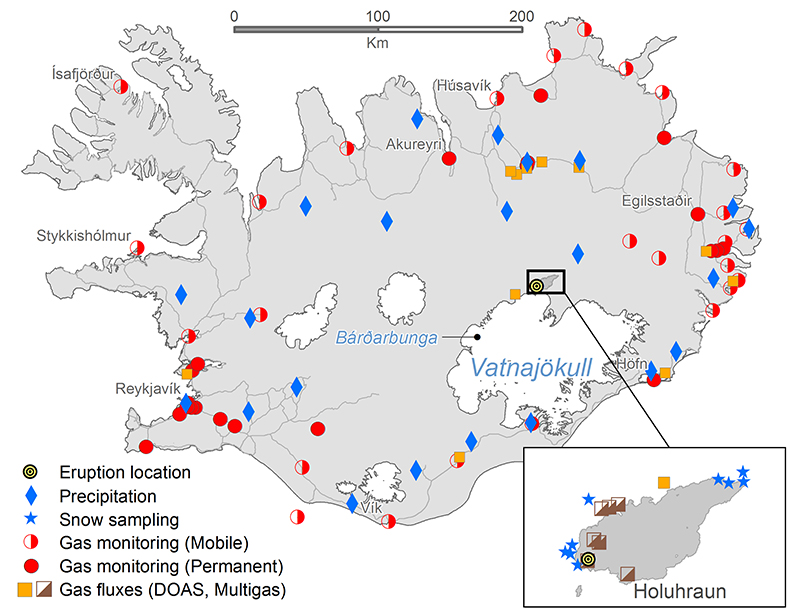
Figure S-1 Location of the various monitoring stations in Iceland. The stations mentioned in text are shown in Figure 1.
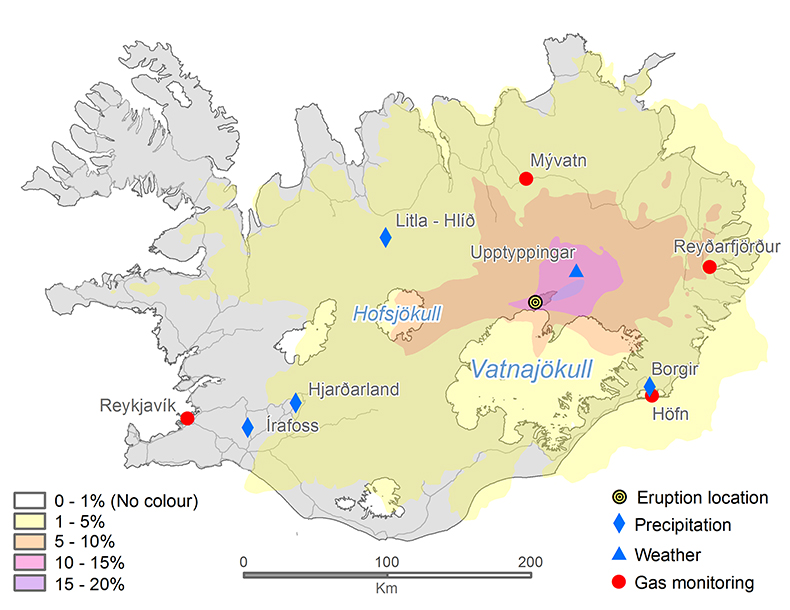
Figure S-2 The SO2 dispersion during the eruption modelled by CALPUFF including the effect of wet deposition presented as frequency of hourly concentrations higher than the 350 µg m−3 health limit. The monitoring stations mentioned in the text are also shown.
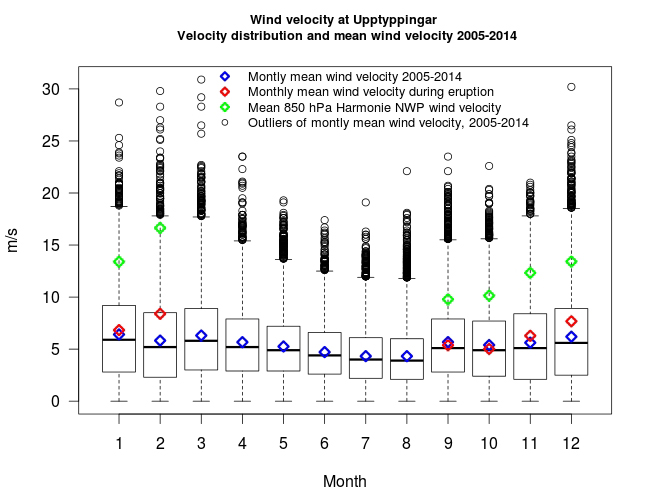
Figure S-3 The wind velocity distribution measured at 10.5 m height from the ground at the Upptyppingar weather station (Fig. S-2). The box plots show the median, lower and upper quartiles (25 % and 75 %) as well as minimum, maximum and outliers. The blue diamonds depict the calculated monthly average wind velocity for the long term time series (1 March 2005‒28 February 2014), the red diamonds the calculated monthly average wind velocity during the eruption period (1 September 2014‒27 February 2015) and the green diamonds the Harmonie 850 hPa Numerical Weather Prediction (NWP) wind velocity at about 1200‒1500 m a.s.l. over Upptyppingar during the eruption.
Table S-1 Total magma effusion and gas emissions, average rates, first weeks’ rates, and December‒January rates.
| Total | Average | First weeks (2.5 times average) | December-January | |||||||||
| Magma | Petrologic | DOAS | Magma | Petrologic | DOAS | Magma | Petrologic | DOAS | Magma | Petrologic | DOAS | |
| MultiGAS | MultiGAS | MultiGAS | MultiGAS | |||||||||
| Mt | Mt | Mt | kg s-1 | kg s-1 | kg s-1 | kg s-1 | kg s-1 | kg s-1 | kg s-1 | kg s-1 | kg s-1 | |
| Magma | 4200 | 2.69E+05 | 6.71E+05 | 1.75E+05 | ||||||||
| H2O | 16.8 | 284 | 1070 | 1.81E+04 | 2690 | 5.21E+04 | 698 | 1.15E+04 | ||||
| SO2 | 10.7 | 11.8 | 684 | 754 | 1710 | 1380 | 445 | 546 | ||||
| CO2 | 6.33 | 5.60 | 405 | 358 | 1010 | 1500 | 263 | 187 | ||||
| HCl | 0.10 | 6.4 | 16.0 | 4.2 | ||||||||
| HF | BD | BD | ||||||||||
Total magma volume, 1.6 ± 0.3 km3, density; 2600 kg m-3, the total mass erupted during the eruption, after 181 effusion days was (4.2 ± 0.8) · 1012kg. The average magma flow rate for the 181 days was 100 m3 s-1 with the corresponding mass flow rate being 2.7 · 105 kg s-1. During the first weeks, the flow rate was two to three times the average (2.5), while 50-80 m3 s-1 occurred in December and January (0.65 times the average), followed by gradual decline in February leading to the termination on 27 February. The error on the effusion rate is 20 %, for the petrologic gas fluxes it is; H2O 22 %, SO2 28 %, CO2 26 %, HCl ~100 % and HF was below detection (BD). The error of SO2 measured by DOAS is 38 % and the one for CO2 and H2O measured by the combination of DOAS and MultiGas is 65 % and 69 % respectively.
Back to article | Download in ExcelTable S-2 SO2 ground‒level gas concentrations in air in Europe.
| Country | Station name | Latitude | Longitude | Height above sea level | Date | Distance from the eruption | Highest one hour SO2 peak |
| Ireland1 | Ennis | 52.84 | -9 | 16 m | 06.09.2014 | 1407 km | 498 µg/m3 |
| Ireland1 | Portlaoise | 53.04 | -7.29 | 98 m | 06.09.2014 | 1420 km | 343 µg/m3 |
| Netherlands2 | Philippine | 51.29 | 3.75 | 5 m | 22.09.2014 | 1905 km | 82 µg/m3 |
| Belgium3 | Ghent region | 51.15 | 3.81 | 12 m | 22.09.2014 | 1931 km | 87 µg/m3 |
| Britain4 | Wicken Fen | 52.3 | 0.29 | 3 m | 22.09.2014 | 1701 km | 96 µg/m3 |
| Austria5 | Masenberg | 47.35 | 15.89 | 1210 m | 22.09.2014 | 2754 km | 235 µg/m3 |
1Preliminary data from the Irish Environmental Protection Agency.
2Preliminary data from the National Institute for Public Health and the Environment.
3Preliminary data from the Belgian Interregional Environment Agency.
4Preliminary data from the Department for Environment Food & Rural Affairs.
5Preliminary data from the Environment Agency Austria.


