


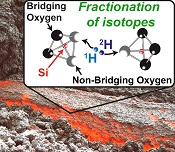
Intramolecular fractionation of hydrogen isotopes in silicate quenched melts
Affiliations | Corresponding Author | Cite as

- Share this article


Article views:10,408Cumulative count of HTML views and PDF downloads.
- Download Citation
- Rights & Permissions

Abstract
Figures and Tables
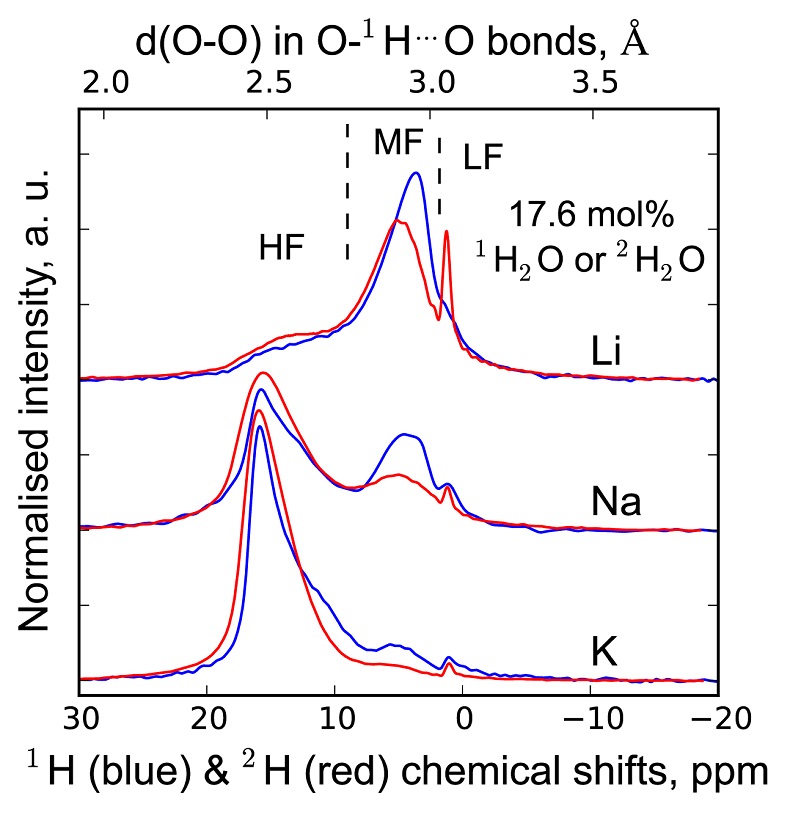
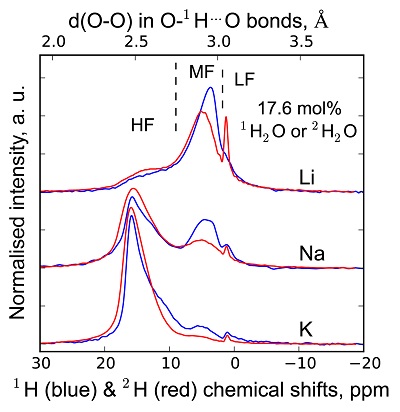 Figure 1 1H and 2H isotropic MAS NMR spectra of the alkali tetrasilicate glasses containing 17.6 mol % of pure 1H2O or 2H2O. O-O distances along O-H…O bonds have been determined from the 1H chemical shifts following Xue and Kanzaki (2009). |  Figure 2 αHF-MF (= (2H/1H)HF / (2H/1H)MF) intramolecular fractionation factors between the environments linked to the HF and MF regions in the 1H and 2H NMR spectra (Supplementary Information). Inverted triangles, circles and squares: determined from the NMR data of “endmembers” glasses containing pure 1H2O and pure 2H2O; diamonds: determined from the NMR data of the glasses with mixed 1H2O-2H2O (1:1 ratio; no fractionation factor is provided at 144 pm as the NMR data for K-bearing glass were too noisy to provide an accurate estimation). Alkali bonded radii are from Gibbs et al. (2014), assuming 6 fold coordinated alkalis. | 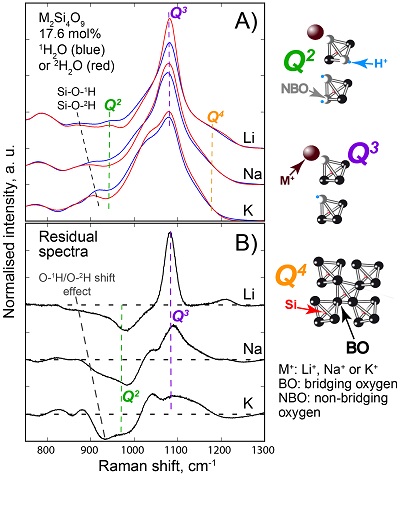 Figure 3 (a) 750-1300 cm-1 portion of Raman spectra of the alkali silicate glasses containing 17.6 mol % of pure 1H2O (blue lines) or 2H2O (red lines). (b) Residual spectra from the subtraction of the Raman spectra of the 1H2O-bearing glasses from those of the 2H2O-bearing glasses. The contributions between 850 and 930 cm-1 are artifacts resulting from the frequency shift of the Si-O-H stretching vibration upon 2H/1H substitution. On the right part of this figure are presented schemes of the Qn SiO4 tetrahedral units, containing n bridging and 4-n non-bridging oxygen atoms, that form the molecular disordered backbone of silicate melts. |
| Figure 1 | Figure 2 | Figure 3 |
Supplementary Figures and Tables
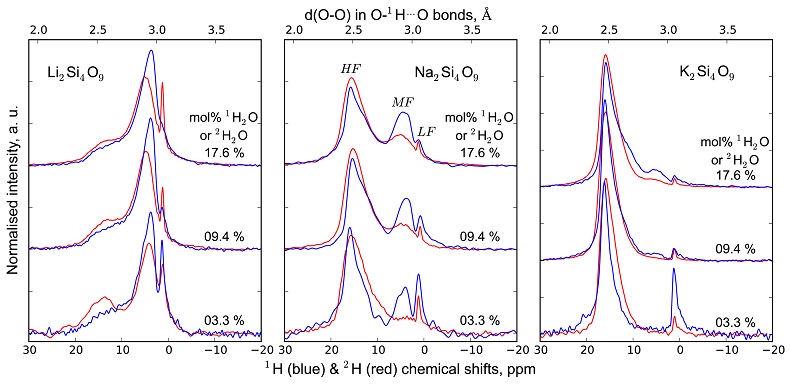
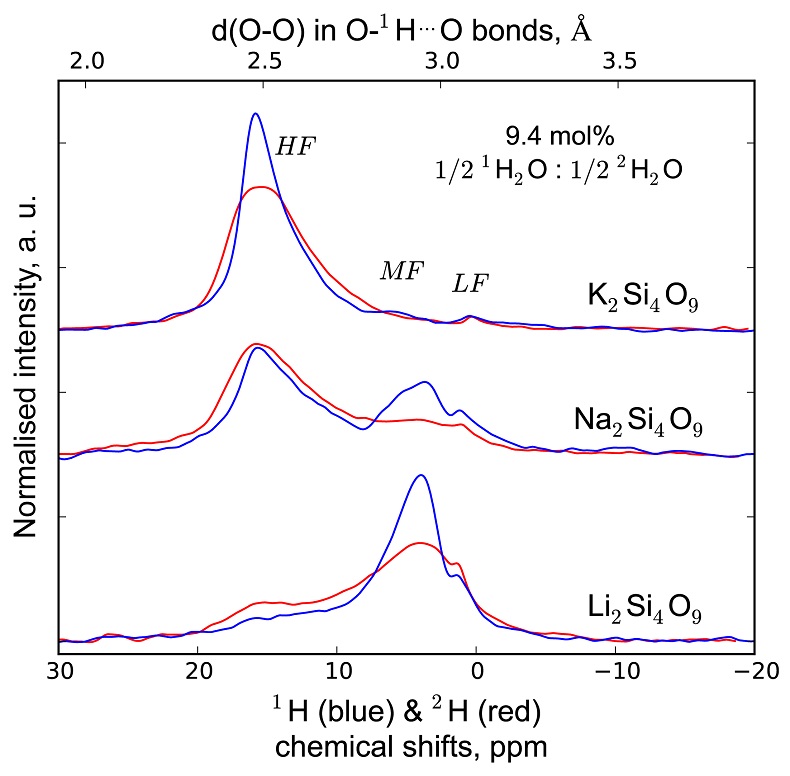
 Table S-1 Water concentration and synthesis conditions of the quenched melts. Nom. water refers to the nominal 1H2O or 2H2O concentrations. Endmembers and Mixed respectively refer to the products containing only 1H2O or 2H2O, and to those prepared with the 50:50 mixture of 2H2O + 1H2O. 1H2O concentrations of endmembers are from Le Losq et al. (2015a,b). The Raman-based technique of Le Losq et al. (2015b) was used to determine the concentration of 1H2O, 2H2O or of 1H2O+2H2O in the glasses. However, as it has not been cross-validated with another technique for the 2H2O and 1H2O+2H2O concentrations, no error bars are provided. Other errors are given at the 1σ confidence interval. | 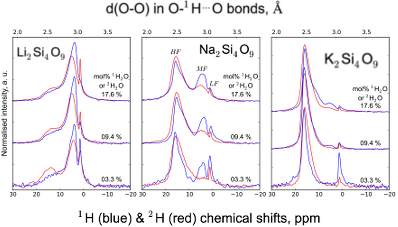 Figure S-1 Superposition of 1H and 2H isotropic MAS NMR spectra of the silicate glasses containing pure 1H2O or 2H2O for different 1H2O and 2H2O concentrations as indicated on individual spectra (mol %). Blue and red lines are the 1H and 2H NMR signals, respectively. The O-O distances of O-H...O bonds (with – an ionic-covalent bond and ...a hydrogen bond) determined from the 1H chemical shift (equation from Xue and Kanzaki, 2009) are shown on the upper horizontal axis. | 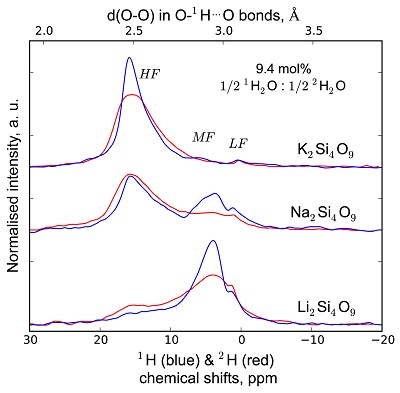 Figure S-2 1H and 2H isotropic MAS NMR spectra of the alkali tetrasilicate glasses with 1H2O and 2H2O in a 1:1 molar ratio (total 1H2O + 2H2O molar content of 9.4 mol %). Blue lines and red lines are the 1H and 2H NMR signals, respectively. The O-O distances of O-H…O bonds determined from the 1H chemical shift (equation from Xue and Kanzaki, 2009) are shown on the upper horizontal axis. | 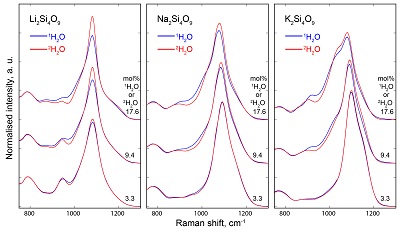 Figure S-3 750-1300 cm-1 portion of all the Raman spectra of the alkali silicate glasses containing pure 1H2O (blue lines) or 2H2O (red lines). 1H2O / 2H2O mol % concentrations are indicated at the right end of each spectrum. See text for discussion and attributions. | 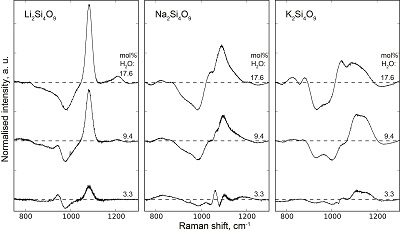 Figure S-4 Residual Raman signals after subtraction of the Raman spectra of 1H2O-bearing glasses from those of 2H2O-bearing glasses. Dashed horizontal lines indicate the 0 value for each residual spectrum. Water concentrations, as mol % 1H2O or 2H2O, are indicated at the right end of each residual signal. Positive peaks indicate increasing intensity with substitution of 1H by 2H, and negative peaks the opposite case. Systematic increase of intensity near 1100 cm-1 is observed, while intensity systematically decreases near 950-1000 cm-1. Those changes reflect increasing and decreasing contributions of Q3 and Q2 units to the Raman signal, respectively, with substitution of 1H by 2H. The contributions between 850 and 930 cm-1 are artifacts resulting from the frequency shift of the Si-O-H stretching vibration upon 2H/1H substitution. |
| Table S-1 | Figure S-1 | Figure S-2 | Figure S-3 | Figure S-4 |
top
Introduction
Silicate melts played a determining role in the segregation and evolution of the Earth’s crust, mantle and core (Wood et al., 2006
Wood, B.J., Walter, M.J., Wade, J. (2006) Accretion of the Earth and segregation of its core. Nature 441, 825-833.
; Labrosse et al., 2007Labrosse, S., Hernlund, J.W., Coltice, N. (2007) A crystallizing dense magma ocean at the base of the Earth’s mantle. Nature 450, 866-869.
). Characterisation of their structure is central to understanding those processes. The silicate melt structure comprises network forming ions (Si4+, Al3+, Fe3+…) in interconnected oxygen polyhedra, forming a network that can be disrupted by network modifiers ions, e.g., Mg2+, Ca2+, K+, Na+. The latter may also act as charge compensators of the O2- bonded to network forming trivalent cations. Additional complexity arises from large variations in Si-O-Si / Si-O-Al bond angles and cationic coordination numbers, and non-random mixing and partitioning of the cations (Mysen and Richet, 2005Mysen, B., Richet, P. (2005) Silicate glasses and melts: properties and structure. Vol. 10, Elsevier, Amsterdam, The Netherlands.
; Greaves and Sen, 2007Greaves, G.N., Sen, S. (2007) Inorganic glasses, glass-forming liquids and amorphizing solids. Advances in Physics 56, 1-166.
).From this structural complexity may arise peculiar effects on the partitioning of isotopes between silicate melts, minerals, and aqueous fluids. For example, the partitioning of 15N/14N, of 13C/12C, and of 2H/1H between sodium silicate melts and aqueous fluids depends on the melt structure (Mysen et al., 2009
Mysen, B.O., Fogel, M.L., Morrill, P.L., Cody, G.D. (2009) Solution behavior of reduced C O H volatiles in silicate melts at high pressure and temperature. Geochimica et Cosmochimica Acta 73, 1696-1710.
; Mysen and Fogel, 2010Mysen, B.O., Fogel, M.L. (2010) Nitrogen and hydrogen isotope compositions and solubility in silicate melts in equilibrium with reduced (N+H)-bearing fluids at high pressure and temperature: effects of melt structure. American Mineralogist 95, 987-999.
). The 34S/32S fractionation between aluminosilicate melts and metals also depends on the proportion of network formers Al3+ or B3+ in the melts (Labidi et al., 2016Labidi, J., Shahar, A., Le Losq, C., Hillgren, V.J., Mysen, B.O., Farquhar, J. (2016) Experimentally determined sulfur isotope fractionation between metal and silicate and implications for planetary differentiation. Geochimica et Cosmochimica Acta 175, 181-194.
). Further, the behaviour of Fe isotopes in silicate melts is affected by the effects of melt composition on the Fe environment (Dauphas et al., 2014Dauphas, N., Roskosz, M., Alp, E.E., Neuville, D.R., Hu, M.Y., Sio, C.K., Cordier, C. (2014) Magma redox and structural controls on iron isotope variations in Earth's mantle and crust. Earth and Planetary Science Letters 398, 127-140.
).The 2H and 1H isotopes may be particularly strongly affected by intramolecular processes in silicate melts because of their large difference in mass. Results from 1H and 2H Rotor-synchronised Magic-Angle Spinning (MAS) Nuclear Magnetic Resonance (NMR) spectroscopy of hydrous sodium tetrasilicate and MORB-like glasses indicate that 2H tends to populate environments with shorter O-O distances compared to 1H in quenched melts (Wang et al., 2015
Wang, Y., Cody, S.X., Foustoukos, D., Mysen, B.O., Cody, G.D. (2015) Very large differences in intramolecular D-H partitioning in hydrated silicate melts synthesized at upper mantle pressures and temperatures. American Mineralogist 100, 1182-1189.
). Therefore, 2H and 1H seem to fractionate between the various molecular environments in silicate melts.Such 2H/1H intramolecular fractionation may help understanding the large 2H/1H isotopic fractionation observed between silicate melts and aqueous fluids. Indeed, in situ Raman observations in diamond cells show that
 may reach hundreds of ‰ at temperatures and pressures as high as 700 °C and 1.5 GPa (Mysen, 2013a
Mysen, B. (2013a) Hydrogen isotope fractionation between coexisting hydrous melt and silicate-saturated aqueous fluid: An experimental study in situ at high pressure and temperature. American Mineralogist 98, 376-386.
,bMysen, B. (2013b) Effects of fluid and melt density and structure on high-pressure and high-temperature experimental studies of hydrogen isotope partitioning between coexisting melt and aqueous fluid. American Mineralogist 98, 1754-1764.
; Dalou et al., 2015Dalou, C., Le Losq, C., Mysen, B.O. (2015) In situ study of the fractionation of hydrogen isotopes between aluminosilicate melts and coexisting aqueous fluids at high pressure and high temperature–Implications for the δD in magmatic processes. Earth and Planetary Science Letters 426, 158-166.
). Such values are higher than typical αfluid-mineral in the tens of ‰ level (Chacko et al., 2001Chacko, T., Cole, D.R., Horita, J. (2001) Equilibrium oxygen, hydrogen and carbon isotope fractionation factors applicable to geologic systems. Reviews in mineralogy and geochemistry 43, 1-81.
). According to the results of Wang et al. (2015)Wang, Y., Cody, S.X., Foustoukos, D., Mysen, B.O., Cody, G.D. (2015) Very large differences in intramolecular D-H partitioning in hydrated silicate melts synthesized at upper mantle pressures and temperatures. American Mineralogist 100, 1182-1189.
, the intramolecular fractionation of 2H and 1H in silicate melts results in differences between the mean O-1H and O-2H bond lengths. Therefore, it may enhance the differences of O-1H and O-2H bond strengths between silicate melts and aqueous fluids, and, as a result, promote a strong fractionation of both isotopes between those substances (Schauble, 2004Schauble, E.A. (2004) Applying stable isotope fractionation theory to new systems. Reviews in Mineralogy and Geochemistry 55, 65-111.
and references therein).To gain further understanding of such process, we performed Raman spectroscopy and 1H and 2H Rotor-synchronised MAS NMR observations of Li2Si4O9, Na2Si4O9 and K2Si4O9 melts quenched from high temperature and pressure, and containing 1H2O, 2H2O, or a mixture of both (Table S-1). Experimental methods are described in Supplementary Information and all acquired NMR and Raman spectra are provided in Supplementary Figures S-1, S-2, S-3 and S-4.
top
Results
1H and 2H isotropic NMR spectra of the hydrous alkali quenched melts present three main peaks near 16, 5 and 1.8 ppm in three frequency regions, HF, MF and LF (Fig. 1, Supplementary Information). The 2H signal is systematically more intense in the HF region and less intense in the MF region relative to that of 1H at any water content and glass composition (Fig. 1). The intensity in the LF region of the 1H and 2H NMR spectra also differs, but in a non systematic way such that it is difficult to ascribe those changes to an isotopic effect. Furthermore, the area of the LF peak constitutes a small (<5 %) fraction of the total integrated NMR intensity. For those reasons, we will not consider it further.
Figure 1 1H and 2H isotropic MAS NMR spectra of the alkali tetrasilicate glasses containing 17.6 mol % of pure 1H2O or 2H2O. O-O distances along O-H…O bonds have been determined from the 1H chemical shifts following Xue and Kanzaki (2009)
Xue, X., Kanzaki, M. (2009) Proton distributions and hydrogen bonding in crystalline and glassy hydrous silicates and related inorganic materials: insights from high-resolution solid-state Nuclear Magnetic Resonance spectroscopy. Journal of the American Ceramic Society 92, 2803-2830.
.The differences in 2H and 1H isotropic NMR spectra indicate that 2H and 1H fractionate between different environments in the silicate melt structure, with 2H preferentially populating environments with small O-O distances (Fig. 1). This effect can be quantified by calculating the fractionation factor between the HF and MF spectral regions, αHF-MF (Fig. 2). αHF-MF depends primarily on the alkali ionic radius, as shown by a ~65 % variation between the Li and K glasses, and secondarily on the glass water content. The latter influence probably originates from the fact that increasing the water content increases the fraction of molecular water, which gives a weak signal in the MF portion of 2H and 1H NMR spectra.
Figure 2 αHF-MF (= (2H/1H)HF / (2H/1H)MF) intramolecular fractionation factors between the environments linked to the HF and MF regions in the 1H and 2H NMR spectra (Supplementary Information). Inverted triangles, circles and squares: determined from the NMR data of “endmembers” glasses containing pure 1H2O and pure 2H2O; diamonds: determined from the NMR data of the glasses with mixed 1H2O-2H2O (1:1 ratio; no fractionation factor is provided at 144 pm as the NMR data for K-bearing glass were too noisy to provide an accurate estimation). Alkali bonded radii are from Gibbs et al. (2014)
Gibbs, G.V., Ross, N.L., Cox, D.F., Rosso, K.M. (2014) Insights into the crystal chemistry of Earth materials rendered by electron density distributions: Pauling’s rules revisited. American Mineralogist 99, 1071-1084.
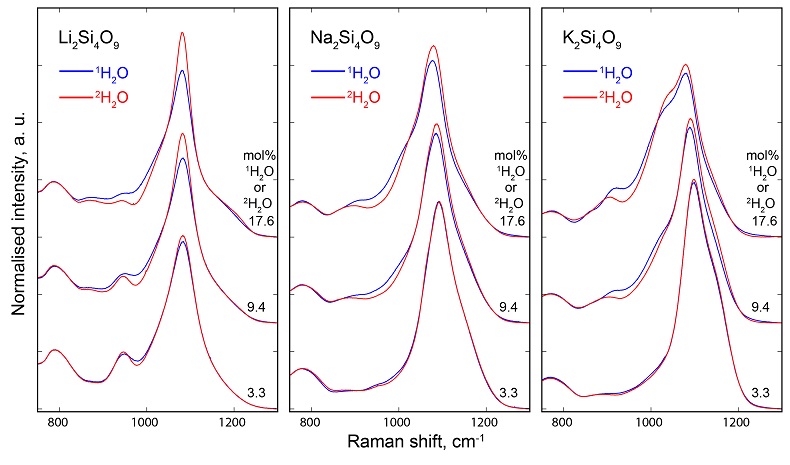
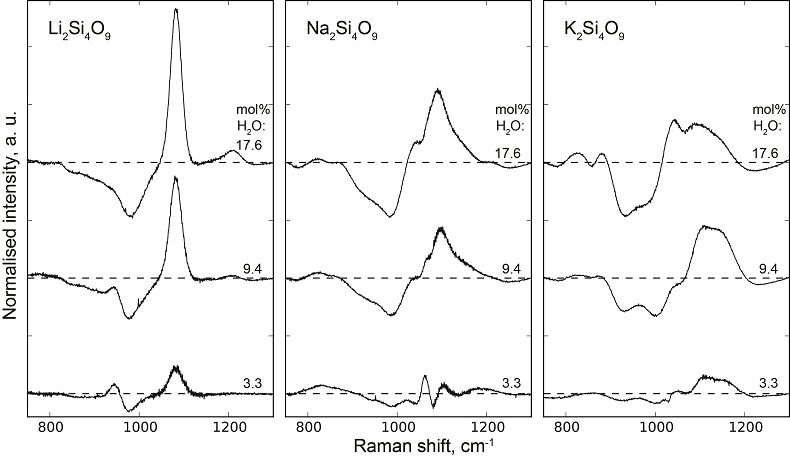
, assuming 6 fold coordinated alkalis.The signals in the 850-1300 cm-1 portion of the Raman spectra of glasses with comparable composition and water content, but containing either pure 1H2O or pure 2H2O, systematically differ from each other (Fig. 3). The intensity of the signal assigned to Si-O stretching in Q3 units (~1100 cm-1) is enhanced by the presence of 2H2O, whereas that assigned to Si-O stretching in Q2 units (~950 cm-1) is lowered (Supplementary Information for additional detail). This observation is confirmed by subtraction of the Raman spectra of the 1H2O-bearing glasses from those of the 2H2O-bearing glasses (Fig. 3b). The variations of the intensity near 1150-1200 cm-1, where the signal from Si-O stretching in Q4 units occurs, are negligible compared with those of the ~950 and ~1100 cm-1 signals.
Figure 3 (a) 750-1300 cm-1 portion of Raman spectra of the alkali silicate glasses containing 17.6 mol % of pure 1H2O (blue lines) or 2H2O (red lines). (b) Residual spectra from the subtraction of the Raman spectra of the 1H2O-bearing glasses from those of the 2H2O-bearing glasses. The contributions between 850 and 930 cm-1 are artifacts resulting from the frequency shift of the Si-O-H stretching vibration upon 2H/1H substitution. On the right part of this figure are presented schemes of the Qn SiO4 tetrahedral units, containing n bridging and 4-n non-bridging oxygen atoms, that form the molecular disordered backbone of silicate melts.
top
Discussion
The decrease of the Q2 abundance and the increase of the Q3 abundance by substitution of 1H for 2H seen in the Raman spectra of the glasses explain the variations of the 1H and 2H NMR signals. Indeed, from {1H}-29Si HETCOR NMR data of Na2Si4O9 hydrous glasses (Robert et al., 2001
Robert, E., Whittington, A., Fayon, F., Pichavant, M., Massiot, D. (2001) Structural characterization of water-bearing silicate and aluminosilicate glasses by high-resolution solid-state NMR. Chemical Geology 174, 291-305.
), the 1H 16 ppm NMR signal is strongly correlated with the 29Si NMR signal from Q3 units, and is only weakly correlated with that of Q2 units. An increase of Q3 abundance with substitution of 1H by 2H in the glasses thus explains the higher 2H NMR signal near 16 ppm (Figs. 1, S-1, S-2). Therefore, we conclude that, compared to 1H, 2H preferentially bonds with non-bridging oxygens in Q3 units relative to Q2 units. From the variations in the Raman signal intensity, the differences range between 0.5 and 4 %.This intramolecular fractionation of 2H and 1H between the Qn units explains the variations of αHF-MF as a function of composition (Fig. 2). Indeed, with increasing alkali ionic radius, both the distribution of Qn species and the proton environment change (Le Losq et al., 2015
Le Losq, C., Mysen, B.O., Cody, G.D. (2015) Water and magmas: insights about the water solution mechanisms in alkali silicate melts from infrared, Raman, and 29Si solid-state NMR spectroscopies. Progress in Earth and Planetary Sciences 2, 22, doi: 10.1186/s40645-015-0052-7.
). These factors affect the 2H/1H intramolecular fractionation. The latter probably occurs at high temperature in the molten state, far from the melt glass transition temperature, Tg. This hypothesis is supported by the fact that the quench rate affects the Tg and the water speciation (e.g., Behrens and Yamashita, 2008Behrens, H., Yamashita, S. (2008) Water speciation in hydrous sodium tetrasilicate and hexasilicate melts: Constraint from high temperature NIR spectroscopy. Chemical Geology 256, 306-315.
), but has no effect on the 2H/1H intramolecular fractionation (Wang et al., 2015Wang, Y., Cody, S.X., Foustoukos, D., Mysen, B.O., Cody, G.D. (2015) Very large differences in intramolecular D-H partitioning in hydrated silicate melts synthesized at upper mantle pressures and temperatures. American Mineralogist 100, 1182-1189.
).Wang et al. (2015)
Wang, Y., Cody, S.X., Foustoukos, D., Mysen, B.O., Cody, G.D. (2015) Very large differences in intramolecular D-H partitioning in hydrated silicate melts synthesized at upper mantle pressures and temperatures. American Mineralogist 100, 1182-1189.
proposed that the intramolecular fractionation of 1H and 2H observed in the glasses arises from a molar volume isotope effect (e.g., Driesner, 1997Driesner, T. (1997) The effect of pressure on deuterium-hydrogen fractionation in high-temperature water. Science 277, 791-794.
), which may be analogous to that observed in the brucite-water system (Horita et al., 1999Horita, J., Driesner, T., Cole, D.R. (1999) Pressure effect on hydrogen isotope fractionation between brucite and water at elevated temperatures. Science 286, 1545-1547.
, 2002Horita, J., Cole, D.R., Polyakov, V.B., Driesner, T. (2002) Experimental and theoretical study of pressure effects on hydrogen isotope fractionation in the system brucite-water at elevated temperatures. Geochimica et Cosmochimica Acta 66, 3769-3788.
, 2010Horita, J., Dos Santos, A.M., Tulk, C.A., Chakoumakos, B.C., Polyakov, V.B. (2010) High-pressure neutron diffraction study on H–D isotope effects in brucite. Physics and Chemistry of Minerals 37, 741-749.
). Following Wang et al. (2015)Wang, Y., Cody, S.X., Foustoukos, D., Mysen, B.O., Cody, G.D. (2015) Very large differences in intramolecular D-H partitioning in hydrated silicate melts synthesized at upper mantle pressures and temperatures. American Mineralogist 100, 1182-1189.
, 2H would preferentially occupy environments in silicate melts with smaller O-O distances, and hence volumes compared to 1H, explaining the 2H and 1H NMR data (Fig. 1). The present Raman data offer further understanding by showing the bonding preferences of 2H and 1H for different silicate units in the glasses. Such bonding preferences may result from different “effective” ionic radii of 1H and 2H in silicate melts, induced by their different quantum mechanical properties. This is analogous to the alkali ionic radius effect on the Qn units distribution in silicate melts (e.g., Maekawa et al., 1991Maekawa, H., Maekawa, T., Kawamura, K., Yokohama, T. (1991) The structural groups of alkali silicate glasses determined from 29Si MAS-NMR. Journal of Non-Crystalline Solids 127, 53-64.
).The equilibrium fractionation of isotopes between different substances is governed by the different strengths of the bonds that the isotopes form in the substances (Schauble, 2004
Schauble, E.A. (2004) Applying stable isotope fractionation theory to new systems. Reviews in Mineralogy and Geochemistry 55, 65-111.
and references therein). In silicate melts at high temperature, water is mostly present as OH groups (e.g., Behrens and Yamashita, 2008Behrens, H., Yamashita, S. (2008) Water speciation in hydrous sodium tetrasilicate and hexasilicate melts: Constraint from high temperature NIR spectroscopy. Chemical Geology 256, 306-315.
), with protons interacting with the Qn units. The present data indicate that, in such conditions, 2H populates the environments characterised by short O-O distances, and, hence long O-H bonds, slightly more than does 1H (Fig. 1, the shortening of O-O bonds around protons enhances hydrogen bonding, pulling away the protons from the “primary” O, see Novak, 1974Novak, A. (1974) Hydrogen bonding in solids correlation of spectroscopic and crystallographic data. In: Large Molecules. Springer Berlin Heidelberg, 177-216.
). As a result, the mean O-2H bond strength will be less than the mean O-1H bond strength in the melt. Such phenomena may affect the differences in O-2H bond strength between silicate melts and aqueous fluids. Therefore, these structural features can control the isotopic fractionation of 2H and 1H between the melts and the fluids. This theory might explain the large fractionation of 2H and 1H between those substances (Mysen, 2013aMysen, B. (2013a) Hydrogen isotope fractionation between coexisting hydrous melt and silicate-saturated aqueous fluid: An experimental study in situ at high pressure and temperature. American Mineralogist 98, 376-386.
,bMysen, B. (2013b) Effects of fluid and melt density and structure on high-pressure and high-temperature experimental studies of hydrogen isotope partitioning between coexisting melt and aqueous fluid. American Mineralogist 98, 1754-1764.
; Dalou et al., 2015Dalou, C., Le Losq, C., Mysen, B.O. (2015) In situ study of the fractionation of hydrogen isotopes between aluminosilicate melts and coexisting aqueous fluids at high pressure and high temperature–Implications for the δD in magmatic processes. Earth and Planetary Science Letters 426, 158-166.
).The link between the chemical composition and the speciation of Qn units (e.g., Mysen and Richet, 2005
Mysen, B., Richet, P. (2005) Silicate glasses and melts: properties and structure. Vol. 10, Elsevier, Amsterdam, The Netherlands.
) implies that the intramolecular fractionation of 2H and 1H depends on the melt composition (Fig. 2). This may result in compositionally-dependent αfluid-melt, αvapour-melt and αmineral-melt fractionation factors, correlated with magmatic differentiation. Moreover, the intramolecular fractionation effect affects the fraction of water that interacts structurally with the silicate network, i.e. the so-called hydroxyl groups. Therefore, the influence of this effect on the αfluid-melt, αvapour-melt and αmineral-melt fractionation factors can also depend on water speciation. This may not be crucial at high temperatures where most of the water resides as OH groups in the melt, but it might play a determining role at temperatures corresponding to superficial volcanism, where magma degassing occurs. Such an idea agrees with an αvapour-melt that depends on water speciation (De Hoog et al., 2009De Hoog, J.C., Taylor, B.E., Van Bergen, M.J. (2009) Hydrogen-isotope systematics in degassing basaltic magma and application to Indonesian arc basalts. Chemical Geology 266, 256-266.
and references therein).The discussion above emphasises the centrally important principles that affect 2H/1H fractionation with implications for a range of geochemical problems. However, quantitative characterisation of how intramolecular fractionation of 2H and 1H in silicate melts governs hydrogen isotope fractionation processes in nature remain to be assessed. This fractionation of 2H and 1H between the Qn units of silicate melts likely reflects different extents of steric hindrance. This is analogous to the different distribution of alkali metals among structural units, for example (Maekawa et al., 1991
Maekawa, H., Maekawa, T., Kawamura, K., Yokohama, T. (1991) The structural groups of alkali silicate glasses determined from 29Si MAS-NMR. Journal of Non-Crystalline Solids 127, 53-64.
). Such structural complexity, in turn, may affect other isotopic systems for which the isotopes interact with the Qn units as reported, for example, for 15N/14N (Mysen and Fogel, 2010Mysen, B.O., Fogel, M.L. (2010) Nitrogen and hydrogen isotope compositions and solubility in silicate melts in equilibrium with reduced (N+H)-bearing fluids at high pressure and temperature: effects of melt structure. American Mineralogist 95, 987-999.
), for 13C/12C (Mysen et al., 2009Mysen, B.O., Fogel, M.L., Morrill, P.L., Cody, G.D. (2009) Solution behavior of reduced C O H volatiles in silicate melts at high pressure and temperature. Geochimica et Cosmochimica Acta 73, 1696-1710.
), or for the isotopes of S (Labidi et al., 2016Labidi, J., Shahar, A., Le Losq, C., Hillgren, V.J., Mysen, B.O., Farquhar, J. (2016) Experimentally determined sulfur isotope fractionation between metal and silicate and implications for planetary differentiation. Geochimica et Cosmochimica Acta 175, 181-194.
). Therefore, it might have played an important influence on the geochemical isotopic record used to reconstruct the history of the Earth and other silicate planets.top
Acknowledgements
All NMR experiments were performed at the W.M. Keck Solid State NMR Facility at the Geophysical Laboratory, supported in part by the W.M. Keck Foundation. This research was supported in part by NSF grants EAR 121754 and EAR12504491, NASA Astrobiology and by the Carnegie Institution of Washington. The authors thank Jabrane Labidi and Anat Shahar (GL-CIW) for discussions on the present subject and their comments and corrections on the present manuscript, and Dionysis Foustoukos (GL-CIW) for helpful discussions and comments.
Editor: Bruce Watson
top
References
Behrens, H., Yamashita, S. (2008) Water speciation in hydrous sodium tetrasilicate and hexasilicate melts: Constraint from high temperature NIR spectroscopy. Chemical Geology 256, 306-315.
 Show in context
 This hypothesis is supported by the fact that the quench rate affects the Tg and the water speciation (e.g., Behrens and Yamashita, 2008), but has no effect on the 2H/1H intramolecular fractionation (Wang et al., 2015).
View in article
In silicate melts at high temperature, water is mostly present as OH groups (e.g., Behrens and Yamashita, 2008), with protons interacting with the Qn units.
View in article
Chacko, T., Cole, D.R., Horita, J. (2001) Equilibrium oxygen, hydrogen and carbon isotope fractionation factors applicable to geologic systems. Reviews in mineralogy and geochemistry 43, 1-81.
Show in context Such values are higher than typical αfluid-mineral in the tens of ‰ level (Chacko et al., 2001).
View in article
Dalou, C., Le Losq, C., Mysen, B.O. (2015) In situ study of the fractionation of hydrogen isotopes between aluminosilicate melts and coexisting aqueous fluids at high pressure and high temperature–Implications for the δD in magmatic processes. Earth and Planetary Science Letters 426, 158-166.
Show in context Indeed, in situ Raman observations in diamond cells show that EQUATION may reach hundreds of ‰ at temperatures and pressures as high as 700 °C and 1.5 GPa (Mysen, 2013a,b; Dalou et al., 2015).
View in article
This theory might explain the large fractionation of 2H and 1H between those substances (Mysen, 2013a,b; Dalou et al., 2015).
View in article
Dauphas, N., Roskosz, M., Alp, E.E., Neuville, D.R., Hu, M.Y., Sio, C.K., Cordier, C. (2014) Magma redox and structural controls on iron isotope variations in Earth's mantle and crust. Earth and Planetary Science Letters 398, 127-140.
Show in context Further, the behaviour of Fe isotopes in silicate melts is affected by the effects of melt composition on the Fe environment (Dauphas et al., 2014).
View in article
De Hoog, J.C., Taylor, B.E., Van Bergen, M.J. (2009) Hydrogen-isotope systematics in degassing basaltic magma and application to Indonesian arc basalts. Chemical Geology 266, 256-266.
Show in context Such an idea agrees with an αvapour-melt that depends on water speciation (De Hoog et al., 2009 and references therein).
View in article
Driesner, T. (1997) The effect of pressure on deuterium-hydrogen fractionation in high-temperature water. Science 277, 791-794.
Show in context Wang et al. (2015) proposed that the intramolecular fractionation of 1H and 2H observed in the glasses arises from a molar volume isotope effect (e.g., Driesner, 1997), which may be analogous to that observed in the brucite-water system (Horita et al., 1999, 2002, 2010).
View in article
Gibbs, G.V., Ross, N.L., Cox, D.F., Rosso, K.M. (2014) Insights into the crystal chemistry of Earth materials rendered by electron density distributions: Pauling’s rules revisited. American Mineralogist 99, 1071-1084.
Show in context Figure 2 [...] Alkali bonded radii are from Gibbs et al. (2014), assuming 6 fold coordinated alkalis.
View in article
Greaves, G.N., Sen, S. (2007) Inorganic glasses, glass-forming liquids and amorphizing solids. Advances in Physics 56, 1-166.
Show in context Additional complexity arises from large variations in Si-O-Si / Si-O-Al bond angles and cationic coordination numbers, and non-random mixing and partitioning of the cations (Mysen and Richet, 2005; Greaves and Sen, 2007).
View in article
Horita, J., Driesner, T., Cole, D.R. (1999) Pressure effect on hydrogen isotope fractionation between brucite and water at elevated temperatures. Science 286, 1545-1547.
Show in context Wang et al. (2015) proposed that the intramolecular fractionation of 1H and 2H observed in the glasses arises from a molar volume isotope effect (e.g., Driesner, 1997), which may be analogous to that observed in the brucite-water system (Horita et al., 1999, 2002, 2010).
View in article
Horita, J., Cole, D.R., Polyakov, V.B., Driesner, T. (2002) Experimental and theoretical study of pressure effects on hydrogen isotope fractionation in the system brucite-water at elevated temperatures. Geochimica et Cosmochimica Acta 66, 3769-3788.
Show in context Wang et al. (2015) proposed that the intramolecular fractionation of 1H and 2H observed in the glasses arises from a molar volume isotope effect (e.g., Driesner, 1997), which may be analogous to that observed in the brucite-water system (Horita et al., 1999, 2002, 2010).
View in article
Horita, J., Dos Santos, A.M., Tulk, C.A., Chakoumakos, B.C., Polyakov, V.B. (2010) High-pressure neutron diffraction study on H–D isotope effects in brucite. Physics and Chemistry of Minerals 37, 741-749.
Show in context Wang et al. (2015) proposed that the intramolecular fractionation of 1H and 2H observed in the glasses arises from a molar volume isotope effect (e.g., Driesner, 1997), which may be analogous to that observed in the brucite-water system (Horita et al., 1999, 2002, 2010).
View in article
Labidi, J., Shahar, A., Le Losq, C., Hillgren, V.J., Mysen, B.O., Farquhar, J. (2016) Experimentally determined sulfur isotope fractionation between metal and silicate and implications for planetary differentiation. Geochimica et Cosmochimica Acta 175, 181-194.
Show in context The 34S/32S fractionation between aluminosilicate melts and metals also depends on the proportion of network formers Al3+ or B3+ in the melts (Labidi et al., 2016).
View in article
Such structural complexity, in turn, may affect other isotopic systems for which the isotopes interact with the Qn units as reported, for example, for 15N/14N (Mysen and Fogel, 2010), for 13C/12C (Mysen et al., 2009), or for the isotopes of S (Labidi et al., 2016).
View in article
Labrosse, S., Hernlund, J.W., Coltice, N. (2007) A crystallizing dense magma ocean at the base of the Earth’s mantle. Nature 450, 866-869.
Show in context Silicate melts played a determining role in the segregation and evolution of the Earth’s crust, mantle and core (e.g., Wood et al., 2006; Labrosse et al., 2007).
View in article
Le Losq, C., Mysen, B.O., Cody, G.D. (2015) Water and magmas: insights about the water solution mechanisms in alkali silicate melts from infrared, Raman, and 29Si solid-state NMR spectroscopies. Progress in Earth and Planetary Sciences 2, 22, doi: 10.1186/s40645-015-0052-7.
Show in context Indeed, with increasing alkali ionic radius, both the distribution of Qn species and the proton environment change (Le Losq et al., 2015).
View in article
Maekawa, H., Maekawa, T., Kawamura, K., Yokohama, T. (1991) The structural groups of alkali silicate glasses determined from 29Si MAS-NMR. Journal of Non-Crystalline Solids 127, 53-64.
Show in context This is analogous to the alkali ionic radius effect on the Qn units distribution in silicate melts (e.g., Maekawa et al., 1991).
View in article
This is analogous to the different distribution of alkali metals among structural units, for example (Maekawa et al., 1991).
View in article
Mysen, B. (2013a) Hydrogen isotope fractionation between coexisting hydrous melt and silicate-saturated aqueous fluid: An experimental study in situ at high pressure and temperature. American Mineralogist 98, 376-386.
Show in context Indeed, in situ Raman observations in diamond cells show that EQUATION may reach hundreds of ‰ at temperatures and pressures as high as 700 °C and 1.5 GPa (Mysen, 2013a,b; Dalou et al., 2015).
View in article
This theory might explain the large fractionation of 2H and 1H between those substances (Mysen, 2013a,b; Dalou et al., 2015).
View in article
Mysen, B. (2013b) Effects of fluid and melt density and structure on high-pressure and high-temperature experimental studies of hydrogen isotope partitioning between coexisting melt and aqueous fluid. American Mineralogist 98, 1754-1764.
Show in context Indeed, in situ Raman observations in diamond cells show that EQUATION may reach hundreds of ‰ at temperatures and pressures as high as 700 °C and 1.5 GPa (Mysen, 2013a,b; Dalou et al., 2015).
View in article
This theory might explain the large fractionation of 2H and 1H between those substances (Mysen, 2013a,b; Dalou et al., 2015).
View in article
Mysen, B., Richet, P. (2005) Silicate glasses and melts: properties and structure. Vol. 10, Elsevier, Amsterdam, The Netherlands.
Show in context Additional complexity arises from large variations in Si-O-Si / Si-O-Al bond angles and cationic coordination numbers, and non-random mixing and partitioning of the cations (Mysen and Richet, 2005; Greaves and Sen, 2007).
View in article
The link between the chemical composition and the speciation of Qn units (e.g., Mysen and Richet, 2005) implies that the intramolecular fractionation of 2H and 1H depends on the melt composition (Fig. 2).
View in article
Mysen, B.O., Fogel, M.L. (2010) Nitrogen and hydrogen isotope compositions and solubility in silicate melts in equilibrium with reduced (N+H)-bearing fluids at high pressure and temperature: effects of melt structure. American Mineralogist 95, 987-999.
Show in context For example, the partitioning of 15N/14N, of 13C/12C, and of 2H/1H between sodium silicate melts and aqueous fluids depends on the melt structure (Mysen et al., 2009; Mysen and Fogel, 2010).
View in article
Such structural complexity, in turn, may affect other isotopic systems for which the isotopes interact with the Qn units as reported, for example, for 15N/14N (Mysen and Fogel, 2010), for 13C/12C (Mysen et al., 2009), or for the isotopes of S (Labidi et al., 2016).
View in article
Mysen, B.O., Fogel, M.L., Morrill, P.L., Cody, G.D. (2009) Solution behavior of reduced C O H volatiles in silicate melts at high pressure and temperature. Geochimica et Cosmochimica Acta 73, 1696-1710.
Show in context For example, the partitioning of 15N/14N, of 13C/12C, and of 2H/1H between sodium silicate melts and aqueous fluids depends on the melt structure (Mysen et al., 2009; Mysen and Fogel, 2010).
View in article
Such structural complexity, in turn, may affect other isotopic systems for which the isotopes interact with the Qn units as reported, for example, for 15N/14N (Mysen and Fogel, 2010), for 13C/12C (Mysen et al., 2009), or for the isotopes of S (Labidi et al., 2016).
View in article
Novak, A. (1974) Hydrogen bonding in solids correlation of spectroscopic and crystallographic data. In: Large Molecules. Springer Berlin Heidelberg, 177-216.
Show in context The present data indicate that, in such conditions, 2H populates the environments characterised by short O-O distances, and, hence long O-H bonds, slightly more than does 1H (Fig. 1, the shortening of O-O bonds around protons enhances hydrogen bonding, pulling away the protons from the “primary” O, see Novak, 1974).
View in article
Robert, E., Whittington, A., Fayon, F., Pichavant, M., Massiot, D. (2001) Structural characterization of water-bearing silicate and aluminosilicate glasses by high-resolution solid-state NMR. Chemical Geology 174, 291-305.
Show in context The decrease of the Q2 abundance and the increase of the Q3 abundance by substitution of 1H for 2H seen in the Raman spectra of the glasses explain the variations of the 1H and 2H NMR signals. Indeed, from {1H}-29Si HETCOR NMR data of Na2Si4O9 hydrous glasses (Robert et al., 2001), the 1H 16 ppm NMR signal is strongly correlated with the 29Si NMR signal from Q3 units, and is only weakly correlated with that of Q2 units.
View in article
Schauble, E.A. (2004) Applying stable isotope fractionation theory to new systems. Reviews in Mineralogy and Geochemistry 55, 65-111.
Show in context Therefore, it may enhance the differences of O-1H and O-2H bond strengths between silicate melts and aqueous fluids, and, as a result, promote a strong fractionation of both isotopes between those substances (Schauble, 2004 and references therein).
View in article
The equilibrium fractionation of isotopes between different substances is governed by the different strengths of the bonds that the isotopes form in the substances (Schauble, 2004 and references therein).
View in article
Wang, Y., Cody, S.X., Foustoukos, D., Mysen, B.O., Cody, G.D. (2015) Very large differences in intramolecular D-H partitioning in hydrated silicate melts synthesized at upper mantle pressures and temperatures. American Mineralogist 100, 1182-1189.
Show in context Results from 1H and 2H Rotor-synchronised Magic-Angle Spinning (MAS) Nuclear Magnetic Resonance (NMR) spectroscopy of hydrous sodium tetrasilicate and MORB-like glasses indicate that 2H tends to populate environments with shorter O-O distances compared to 1H in quenched melts (Wang et al., 2015).
View in article
According to the results of Wang et al. (2015), the intramolecular fractionation of 2H and 1H in silicate melts results in differences between the mean O-1H and O-2H bond lengths.
View in article
This hypothesis is supported by the fact that the quench rate affects the Tg and the water speciation (e.g., Behrens and Yamashita, 2008), but has no effect on the 2H/1H intramolecular fractionation (Wang et al., 2015).
View in article
Wang et al. (2015) proposed that the intramolecular fractionation of 1H and 2H observed in the glasses arises from a molar volume isotope effect (e.g., Driesner, 1997), which may be analogous to that observed in the brucite-water system (Horita et al., 1999, 2002, 2010).
View in article
Following Wang et al. (2015), 2H would preferentially occupy environments in silicate melts with smaller O-O distances, and hence volumes compared to 1H, explaining the 2H and 1H NMR data (Fig. 1).
View in article
Wood, B.J., Walter, M.J., Wade, J. (2006) Accretion of the Earth and segregation of its core. Nature 441, 825-833.
Show in context Silicate melts played a determining role in the segregation and evolution of the Earth’s crust, mantle and core (e.g., Wood et al., 2006; Labrosse et al., 2007).
View in article
Xue, X., Kanzaki, M. (2009) Proton distributions and hydrogen bonding in crystalline and glassy hydrous silicates and related inorganic materials: insights from high-resolution solid-state Nuclear Magnetic Resonance spectroscopy. Journal of the American Ceramic Society 92, 2803-2830.
Show in context Figure 1 1H and 2H isotropic MAS NMR spectra of the alkali tetrasilicate glasses containing 17.6 mol % of pure 1H2O or 2H2O. O-O distances along O-H…O bonds have been determined from the 1H chemical shifts following Xue and Kanzaki (2009).
View in article
top
Supplementary Information
Supplementary Methods and Results
Sample preparation
Anhydrous Li2Si4O9 (LS4), Na2Si4O9 (NS4) and K2Si4O9 (KS4) glass starting materials used here are the same as those described in Le Losq et al. (2015a
Le Losq, C., Mysen, B.O., Cody, G.D. (2015a) Water and magmas: insights about the water solution mechanisms in alkali silicate melts from infrared, Raman, and 29Si solid-state NMR spectroscopies. Progress in Earth and Planetary Sciences 2, 22, doi: 10.1186/s40645-015-0052-7.
,bLe Losq, C., Cody, G.D., Mysen, B.O. (2015b) Alkali influence on the water speciation and the environment of protons in silicate glasses revealed by 1H MAS NMR spectroscopy. American Mineralogist 100, 466-473.
,cLe Losq, C., Cody, G.D., Mysen, B.O. (2015c) Complex stretching signal of OH groups in silicate glasses: implication for the use of the 4500 cm-1 IR peak as a marker of OH- groups concentration. American Mineralogist 100, 945-950.
). Hydrous glasses, containing pure 1H2O, pure 2H2O or a 50:50 mixture of 1H2O-2H2O, were formed by temperature-quenching melts hydrated at high pressure and temperature in platinum capsules by using a piston-cylinder apparatus, following the protocol described in Le Losq et al. (2015aLe Losq, C., Mysen, B.O., Cody, G.D. (2015a) Water and magmas: insights about the water solution mechanisms in alkali silicate melts from infrared, Raman, and 29Si solid-state NMR spectroscopies. Progress in Earth and Planetary Sciences 2, 22, doi: 10.1186/s40645-015-0052-7.
,bLe Losq, C., Cody, G.D., Mysen, B.O. (2015b) Alkali influence on the water speciation and the environment of protons in silicate glasses revealed by 1H MAS NMR spectroscopy. American Mineralogist 100, 466-473.
,cLe Losq, C., Cody, G.D., Mysen, B.O. (2015c) Complex stretching signal of OH groups in silicate glasses: implication for the use of the 4500 cm-1 IR peak as a marker of OH- groups concentration. American Mineralogist 100, 945-950.
; see Table S-1 for water content measurements and experimental conditions).Table S-1 Water concentration and synthesis conditions of the quenched melts. Nom. water refers to the nominal 1H2O or 2H2O concentrations. Endmembers and Mixed respectively refer to the products containing only 1H2O or 2H2O, and to those prepared with the 50:50 mixture of 2H2O + 1H2O. 1H2O concentrations of endmembers are from Le Losq et al. (2015a
Le Losq, C., Mysen, B.O., Cody, G.D. (2015a) Water and magmas: insights about the water solution mechanisms in alkali silicate melts from infrared, Raman, and 29Si solid-state NMR spectroscopies. Progress in Earth and Planetary Sciences 2, 22, doi: 10.1186/s40645-015-0052-7.
,bLe Losq, C., Cody, G.D., Mysen, B.O. (2015b) Alkali influence on the water speciation and the environment of protons in silicate glasses revealed by 1H MAS NMR spectroscopy. American Mineralogist 100, 466-473.
). The Raman-based technique of Le Losq et al. (2015b)Le Losq, C., Cody, G.D., Mysen, B.O. (2015b) Alkali influence on the water speciation and the environment of protons in silicate glasses revealed by 1H MAS NMR spectroscopy. American Mineralogist 100, 466-473.
was used to determine the concentration of 1H2O, 2H2O or of 1H2O+2H2O in the glasses. However, as it has not been cross-validated with another technique for the 2H2O and 1H2O+2H2O concentrations, no error bars are provided. Other errors are given at the 1σ confidence interval.| Glass | nom. water, | Synthesis | RAMAN | ||
| total mol% | conditions | [1H2O] | [2H2O] | 2H/1H | |
| Li2Si4O9 | 3.28 (endmembers) | 1650 °C 1.5 GPa 90 min. | 3.08(60) | 4.25(-) | - |
| 9.40 ( endmembers ) | 10.09(60) | 10.60(-) | - | ||
| 9.40 (mixed) | 10.10(-) | 1.04(07) | |||
| 17.64 ( endmembers ) | 18.74(60) | 17.38(-) | - | ||
| Na2Si4O9 | 3.28 ( endmembers ) | 1450 °C 1.5 GPa 90 min. | 3.44(67) | 3.87(-) | - |
| 9.40 ( endmembers ) | 9.46(67) | 9.73(-) | - | ||
| 9.40 (mixed) | 10.33(-) | 1.00(02) | |||
| 17.64 ( endmembers ) | 17.54(67) | 17.02(-) | - | ||
| K2Si4O9 | 3.28 ( endmembers ) | 1550 °C 1.5 Gpa 90 min. | 3.98(74) | 3.68(-) | - |
| 9.40 (endmembers) | 9.62(74) | 8.14(-) | - | ||
| 9.40 (mixed) | 8.07(-) | n.d. | |||
| 17.64 ( endmembers ) | 15.95(74) | 15.99(-) | - | ||
Raman and NMR spectroscopy
Raman spectra were recorded with a Jasco® NRS 3100 spectrometer as described in Le Losq et al. (2015a
Le Losq, C., Mysen, B.O., Cody, G.D. (2015a) Water and magmas: insights about the water solution mechanisms in alkali silicate melts from infrared, Raman, and 29Si solid-state NMR spectroscopies. Progress in Earth and Planetary Sciences 2, 22, doi: 10.1186/s40645-015-0052-7.
,bLe Losq, C., Cody, G.D., Mysen, B.O. (2015b) Alkali influence on the water speciation and the environment of protons in silicate glasses revealed by 1H MAS NMR spectroscopy. American Mineralogist 100, 466-473.
). Raman spectra were recorded with a 2400 lines/mm grating, which results in an accuracy of ±3 cm-1. Precision was ±1 cm-1. Alignment of the Raman spectrometer was tested against the 520.7 cm-1 Raman peak of pure Si. All spectra reported in this study are unpolarised. They are not corrected from excitation line and temperature effects, as we are interested in observing changes at Raman shifts above ~400 cm-1, where such correction is unnecessary (Neuville et al., 2014Neuville, D.R., de Ligny, D., Henderson, G.S. (2014) Advances in Raman spectroscopy applied to earth and material sciences. Reviews in Mineralogy and Geochemistry 78, 509-541.
).For analysis of the signals assigned to vibrations of silicate units, Raman spectra were treated as follows. A simple horizontal constant baseline was adjusted to the intensity in the 1270-1300 cm-1 portion of spectra, where no signal is observed. After baseline removal, intensity was normalised to the total area of the spectra. Such a process allows quantitative comparison of spectra (e.g., Le Losq et al., 2012
Le Losq, C., Neuville, D.R., Moretti, R., Roux, J. (2012) Determination of Water Content in Silicate Glasses using Raman Spectrometry, Implications for the study of explosive volcanism. American Mineralogist 97, 779-790.
; Neuville et al., 2014Neuville, D.R., de Ligny, D., Henderson, G.S. (2014) Advances in Raman spectroscopy applied to earth and material sciences. Reviews in Mineralogy and Geochemistry 78, 509-541.
). For water content determination, the treatment of the Raman spectra is slightly different as the baseline is also fitted to the basis of the bands located near 2600 and 3600 cm-1, respectively assigned to O-2H and O-1H stretching (see Foustoukos and Mysen, 2012Foustoukos, D.I., Mysen, B.O. (2012) D/H fractionation in the H2–H2O system at supercritical water conditions: compositional and hydrogen bonding effects. Geochimica et Cosmochimica Acta 86, 88-102.
, and references cited therein). It is described in detail in Le Losq et al. (2015b)Le Losq, C., Cody, G.D., Mysen, B.O. (2015b) Alkali influence on the water speciation and the environment of protons in silicate glasses revealed by 1H MAS NMR spectroscopy. American Mineralogist 100, 466-473.
, such that we refer the reader to this publication.Hydrogen-1 and Hydrogen-2 solid-state NMR experiments were carried out with a Varian-Chemagnetics CMX Infinity 300 solid-state NMR spectrometer with a static field strength of ~7.05 T. The 1H spectra were acquired using a Magic Angle Spinning (MAS) frequency (ωr/2π) of 22 KHz, 16 cycle DEPTH sequence, 1H pulse length of 2.5 µs, recycle delay of 100 s, and 1600 acquisitions. They are referenced to tetramethylsilane. See Cody et al. (2005)
Cody, G.D., Mysen, B.O., Lee, S.K. (2005) Structure vs. composition: A solid-state 1H and 29Si NMR study of quenched glasses along the Na2O-SiO2-H2O join. Geochimica et Cosmochimica Acta 69, 2373-2384.
and Le Losq et al. (2015b)Le Losq, C., Cody, G.D., Mysen, B.O. (2015b) Alkali influence on the water speciation and the environment of protons in silicate glasses revealed by 1H MAS NMR spectroscopy. American Mineralogist 100, 466-473.
for further analytical details. Isotropic 2H MAS NMR spectra, i.e. spectra that do not exhibit the classic effects of the 2H quadrupolar coupling interaction, and that are therefore, completely comparable to the 1H MAS NMR spectra, were obtained by rotor-synchronised acquisition following the protocol described in Wang et al. (2015)Wang, Y., Cody, S.X., Foustoukos, D., Mysen, B.O., Cody, G.D. (2015) Very large differences in intramolecular D-H partitioning in hydrated silicate melts synthesized at upper mantle pressures and temperatures. American Mineralogist 100, 1182-1189..Water concentrations
Water concentrations of the 1H2O- and 2H2O-bearing glasses were checked with Raman spectroscopy, using the calibration that links the glass water content measured by Infrared (or another technique) to the ratio between the areas of the Raman bands assigned to silicate vibrations and to the O-1H or O-2H stretching vibration as described by Le Losq et al. (2012)
Le Losq, C., Neuville, D.R., Moretti, R., Roux, J. (2012) Determination of Water Content in Silicate Glasses using Raman Spectrometry, Implications for the study of explosive volcanism. American Mineralogist 97, 779-790.
. We used the calibration curve determined by Le Losq et al. (2015b)Le Losq, C., Cody, G.D., Mysen, B.O. (2015b) Alkali influence on the water speciation and the environment of protons in silicate glasses revealed by 1H MAS NMR spectroscopy. American Mineralogist 100, 466-473.
for simple alkali silicate glasses. The method has been shown to determine accurately the water content of natural glasses (Shea et al., 2014Shea, T., Hellebrand, E., Gurioli, L., Tuffen, H. (2014) Conduit-to localized-scale degassing during Plinian Eruptions: Insights from major element and volatile (Cl and H2O) analyses within Vesuvius AD 79 pumice. Journal of Petrology 55, 315-344.
; Métrich et al., 2015Métrich, N., Bertagnini, A., Garaebiti, E., Vergniolle, S., Bani, P., Beaumais, A., Neuville, D.R. (2015) Magma transfer and degassing budget: Application to the 2009–2010 eruptive crisis of Mt Garet (Vanuatu arc). Journal of Volcanology and Geothermal Research, doi:10.1016/j.jvolgeores.2015.06.003.
).The 2H/1H ratios were determined with the ratio of integrated areas of the Raman bands assigned to O-2H and O-1H stretch vibrations (Foustoukos and Mysen, 2012
Foustoukos, D.I., Mysen, B.O. (2012) D/H fractionation in the H2–H2O system at supercritical water conditions: compositional and hydrogen bonding effects. Geochimica et Cosmochimica Acta 86, 88-102.
; Dalou et al., 2015Dalou, C., Le Losq, C., Mysen, B.O. (2015) In situ study of the fractionation of hydrogen isotopes between aluminosilicate melts and coexisting aqueous fluids at high pressure and high temperature–Implications for the δD in magmatic processes. Earth and Planetary Science Letters 426, 158-166.
). The method was validated with spectra of LS4 and NS4 glasses containing a nominal 50:50 mixture of 2H2O and 1H2O. The area ratios of the Raman peaks assigned to the O-2H and the O-1H stretching vibrations lead to the nominal 50:50 2H/1H ratio (Table S-1). For KS4 glasses, no 2H/1H ratio measurement was possible because the bands assigned to the O-1H and O-2H stretching vibrations overlap strongly. The fact that the 2H/1H ratios of the glasses as measured by the area ratio method agree with nominal values indicates that the Raman cross sections of the O-2H and O-1H stretching vibrations are similar at room temperature in glasses. As a consequence, the 1H2O-based calibration of total water contents was used to estimate the 2H2O and the 1H2O+2H2O concentrations of the glasses. However, as it has not been cross-validated by another technique, no error bars are provided for those values (Table S-1).Note on the interpretation of 1H and 2H MAS NMR spectra
The 1H and 2H isotropic MAS NMR spectra of all glasses exhibit two intense peaks located near 5 and 16 ppm with shoulders near 3.5 and 12 ppm, respectively, and a small sharp peak near 1.8 ppm (Figs. 1, S-1, S-2). These features correspond to protons and deuterons existing in, at least, 5 different environments in the silicate glasses (Le Losq et al., 2015b
Le Losq, C., Cody, G.D., Mysen, B.O. (2015b) Alkali influence on the water speciation and the environment of protons in silicate glasses revealed by 1H MAS NMR spectroscopy. American Mineralogist 100, 466-473.
and references therein).Figure S-1 Superposition of 1H and 2H isotropic MAS NMR spectra of the silicate glasses containing pure 1H2O or 2H2O for different 1H2O and 2H2O concentrations as indicated on individual spectra (mol %). Blue and red lines are the 1H and 2H NMR signals, respectively. The O-O distances of O-H...O bonds (with – an ionic-covalent bond and ...a hydrogen bond) determined from the 1H chemical shift (equation from Xue and Kanzaki, 2009
Xue, X., Kanzaki, M. (2009) Proton distributions and hydrogen bonding in crystalline and glassy hydrous silicates and related inorganic materials: insights from high-resolution solid-state Nuclear Magnetic Resonance spectroscopy. Journal of the American Ceramic Society 92, 2803-2830.
) are shown on the upper horizontal axis.Figure S-2 1H and 2H isotropic MAS NMR spectra of the alkali tetrasilicate glasses with 1H2O and 2H2O in a 1:1 molar ratio (total 1H2O + 2H2O molar content of 9.4 mol %). Blue lines and red lines are the 1H and 2H NMR signals, respectively. The O-O distances of O-H…O bonds determined from the 1H chemical shift (equation from Xue and Kanzaki, 2009
Xue, X., Kanzaki, M. (2009) Proton distributions and hydrogen bonding in crystalline and glassy hydrous silicates and related inorganic materials: insights from high-resolution solid-state Nuclear Magnetic Resonance spectroscopy. Journal of the American Ceramic Society 92, 2803-2830.
) are shown on the upper horizontal axis.The NMR spectra can be divided into three frequency regions (Figs. 1, S-1, S-2). The high (HF), middle (MF) and low (LF) frequency regions are centred on the main peaks near 16 ppm (encompassing the 12 ppm signal), 5 ppm (encompassing the 3.5 ppm signal) and 1.8ppm, respectively. These reflect 1H nuclei in O-H…O environments with mean O-O distances of ~245, ~295 and 305 pm, respectively (Xue and Kanzaki, 2009
Xue, X., Kanzaki, M. (2009) Proton distributions and hydrogen bonding in crystalline and glassy hydrous silicates and related inorganic materials: insights from high-resolution solid-state Nuclear Magnetic Resonance spectroscopy. Journal of the American Ceramic Society 92, 2803-2830.
and references therein). The HF, MF and LF regions in the 2H isotropic NMR spectra also correlate with the degree of shielding of 2H, related to O-O distances (Wang et al., 2015Wang, Y., Cody, S.X., Foustoukos, D., Mysen, B.O., Cody, G.D. (2015) Very large differences in intramolecular D-H partitioning in hydrated silicate melts synthesized at upper mantle pressures and temperatures. American Mineralogist 100, 1182-1189.). Therefore, at constant water content, changes in the 1H and 2H isotropic NMR spectra reflect how both 1H and 2H populate environments with smaller O-O distances, and hence, smaller structural volumes with increasing ionic radius of the alkali metal (Figs. 1, S-1, S-2; Le Losq et al., 2015bLe Losq, C., Cody, G.D., Mysen, B.O. (2015b) Alkali influence on the water speciation and the environment of protons in silicate glasses revealed by 1H MAS NMR spectroscopy. American Mineralogist 100, 466-473.
). At any given water content and alkali metal radius, differences between the isotropic 1H and 2H MAS NMR spectra are not due to instrumental or quench effects (Wang et al., 2015Wang, Y., Cody, S.X., Foustoukos, D., Mysen, B.O., Cody, G.D. (2015) Very large differences in intramolecular D-H partitioning in hydrated silicate melts synthesized at upper mantle pressures and temperatures. American Mineralogist 100, 1182-1189.) but reflect differences in the population of 1H and 2H nuclei between the different structural environments in the glasses.The αHF-MF (= (2H/1H)HF / (2H/1H)MF) intramolecular fractionation factors have been obtained by first determining the 2HHF, 1HHF, 2HMF and 1HMF areas in the HF and LF regions of the 1H and 2H isotropic NMR spectra by trapezoidal integration, and then by dividing the integrated areas as (2HHF/1HHF) /(2HMF/1HMF).
Assignment of bands and interpretation of Raman spectra of alkali silicate glasses
In alkali tetrasilicate melts at their glass transition temperature, water is dissolved as H2Omol molecules and as OH groups bonded to Si or the alkalis (Cody et al., 2005
Cody, G.D., Mysen, B.O., Lee, S.K. (2005) Structure vs. composition: A solid-state 1H and 29Si NMR study of quenched glasses along the Na2O-SiO2-H2O join. Geochimica et Cosmochimica Acta 69, 2373-2384.
; Mysen and Cody, 2005Mysen, B.O., Cody, G. (2005) Solution mechanisms of H2O in depolymerized peralkaline melts. Geochimica et Cosmochimica Acta 69, 5557-5566.
; Xue and Kanzaki, 2009Xue, X., Kanzaki, M. (2009) Proton distributions and hydrogen bonding in crystalline and glassy hydrous silicates and related inorganic materials: insights from high-resolution solid-state Nuclear Magnetic Resonance spectroscopy. Journal of the American Ceramic Society 92, 2803-2830.
; Le Losq et al., 2015aLe Losq, C., Mysen, B.O., Cody, G.D. (2015a) Water and magmas: insights about the water solution mechanisms in alkali silicate melts from infrared, Raman, and 29Si solid-state NMR spectroscopies. Progress in Earth and Planetary Sciences 2, 22, doi: 10.1186/s40645-015-0052-7.
). The distribution of the Qn tetrahedral units (see Fig. 3) in hydrous silicate glasses changes as a function of the fraction of OH groups bonded to Si. This affects in fine the 850-1300 cm-1 portion of the glasses Raman spectra, in which peaks and shoulders can be assigned to Si-O stretching vibrations in specific Qn units (Fig. 3a). In particular, signals at ~950, ~1040, ~1090, and ~1150 cm-1 are assigned to the symmetric stretching of Si-O bonds in Q2 units, the asymmetric stretching of Si-O bonds in any Qn units, and the symmetric stretching of Si-O bonds in Q3 units and in Q4 units, respectively (Brawer and White, 1975Brawer, S.A., White, W.B. (1975) Raman spectroscopic investigation of the structure of silicate glasses. I. The binary alkali silicates. The Journal of Chemical Physics 63, 2421-2432.
, 1977Brawer, S.A., White, W.B. (1977) Raman spectroscopic investigation of the structure of silicate glasses (II). Soda-Alkaline earth-Alumina ternary and quaternary glasses. Journal of Non-Crystalline Solids 23, 261-278.
; Virgo et al., 1980Virgo, D., Mysen, B.O., Kushiro, I. (1980) Anionic constitution of silicate melts quenched at 1 atm from Raman spectroscopy: Implications for the structure of igneous melts. Science 208, 1371-1373.
; Furukawa et al., 1981Furukawa, T., Fox, K.E., White, W.B. (1981) Raman spectroscopic investigation of the structure of silicate glasses. III. Raman intensities and structural units in sodium silicate glasses. Journal of Chemical Physics 75, 3226-3237.
; Mysen et al., 1982Mysen, B.O., Finger, L.W., Virgo, D., Seifert, F.A. (1982) Curve-fitting of Raman spectra of silicate glasses. American Mineralogist 67, 686-695.
; McMillan, 1984McMillan, P.F. (1984) Structural studies of silicate glasses and melts - Applications and limitations of Raman spectroscopy. American Mineralogist 69, 622-644.
; see also peak fitting results in Mysen, 1990Mysen, B.O. (1990) Role of Al in depolymerized, peralkaline aluminosilicate melts in the systems Li2O-Al2O3-SiO2, Na2O-Al2O3-SiO2, and K2O-Al2O3-SiO2. American Mineralogist 75, 120-134.
; Le Losq et al., 2015aLe Losq, C., Mysen, B.O., Cody, G.D. (2015a) Water and magmas: insights about the water solution mechanisms in alkali silicate melts from infrared, Raman, and 29Si solid-state NMR spectroscopies. Progress in Earth and Planetary Sciences 2, 22, doi: 10.1186/s40645-015-0052-7.
). Another signal near 900 cm-1 is visible in the Raman spectra of the hydrous alkali silicate glasses. This peak is typically assigned to vibrations of OH groups bonded to the silicate network (McMillan et al., 1993McMillan, P.F., Poe, B.T., Stanton, T.R., Remmele, R.L. (1993) A Raman spectroscopic study of H/D isotopically substituted hydrous aluminosilicate glasses. Physic and Chemistry of Minerals 19, 454-459.
; Zotov and Keppler, 1998Zotov, N., Keppler, H. (1998) The influence of water on the structure of hydrous sodium tetrasilicate glasses. American Mineralogist 83, 823-834.
; Malfait, 2009Malfait, W.J. (2009) The 4500 cm-1 infrared absorption band in hydrous aluminosilicate glasses is a combination band of the fundamental {Si,Al}-OH and O-H vibrations. American Mineralogist 94, 849-852.
, Spiekermann et al., 2012Spiekermann, G., Steel-McInnis, M., Schmidt, C., Jahn, S. (2012) Vibrational mode frequencies of silica species in SiO2-H2O liquids and glasses from ab initio molecular dynamics. The Journal of Chemical Physics 136, 154501.
). Note that its Raman shift decreases in frequency with substitution of 1H by 2H (Fig. 3a, S-3, S-4), indicating a role of 1H and 2H in the origin of this signal.The prominent peak in all Raman spectra near 1100 cm-1, assigned to Si-O stretching in Q3 units, indicates that the latter units dominate in such glasses (Figs. 3a, S-3). Shoulders near 950 and 1150 cm-1, assigned to the Si-O stretching in Q2 and Q4 units, indicate that small proportions of those silicate units are present in the quenched melts. This agrees with previous Raman and 29Si NMR results (Mysen, 1990
Mysen, B.O. (1990) Role of Al in depolymerized, peralkaline aluminosilicate melts in the systems Li2O-Al2O3-SiO2, Na2O-Al2O3-SiO2, and K2O-Al2O3-SiO2. American Mineralogist 75, 120-134.
; Maekawa et al., 1991Maekawa, H., Maekawa, T., Kawamura, K., Yokohama, T. (1991) The structural groups of alkali silicate glasses determined from 29Si MAS-NMR. Journal of Non-Crystalline Solids 127, 53-64.
; Zotov and Keppler, 1998Zotov, N., Keppler, H. (1998) The influence of water on the structure of hydrous sodium tetrasilicate glasses. American Mineralogist 83, 823-834.
; Mysen and Cody, 2005Mysen, B.O., Cody, G. (2005) Solution mechanisms of H2O in depolymerized peralkaline melts. Geochimica et Cosmochimica Acta 69, 5557-5566.
). With increasing water content in the glasses, the signals between 900-1100 cm-1 become more intense, reflecting the depolymerisation of the tetrahedral network that occurs with solution of water (Zotov and Keppler, 1998Zotov, N., Keppler, H. (1998) The influence of water on the structure of hydrous sodium tetrasilicate glasses. American Mineralogist 83, 823-834.
; Cody et al., 2005Cody, G.D., Mysen, B.O., Lee, S.K. (2005) Structure vs. composition: A solid-state 1H and 29Si NMR study of quenched glasses along the Na2O-SiO2-H2O join. Geochimica et Cosmochimica Acta 69, 2373-2384.
; Mysen and Cody, 2005Mysen, B.O., Cody, G. (2005) Solution mechanisms of H2O in depolymerized peralkaline melts. Geochimica et Cosmochimica Acta 69, 5557-5566.
). Increasing the alkali ionic radius promotes the latter effect (Le Losq et al., 2015aLe Losq, C., Mysen, B.O., Cody, G.D. (2015a) Water and magmas: insights about the water solution mechanisms in alkali silicate melts from infrared, Raman, and 29Si solid-state NMR spectroscopies. Progress in Earth and Planetary Sciences 2, 22, doi: 10.1186/s40645-015-0052-7.
). Substitution of 1H by 2H results in increasing and decreasing the intensity of the signals assigned to Si-O stretching in Q3 and Q2 units, respectively (Figs. 3, S-3, S-4), reflecting the slight preferential bonding of 2H to Q3 units.Figure S-3 750-1300 cm-1 portion of all the Raman spectra of the alkali silicate glasses containing pure 1H2O (blue lines) or 2H2O (red lines). 1H2O / 2H2O mol % concentrations are indicated at the right end of each spectrum. See text for discussion and attributions.
Figure S-4 Residual Raman signals after subtraction of the Raman spectra of 1H2O-bearing glasses from those of 2H2O-bearing glasses. Dashed horizontal lines indicate the 0 value for each residual spectrum. Water concentrations, as mol % 1H2O or 2H2O, are indicated at the right end of each residual signal. Positive peaks indicate increasing intensity with substitution of 1H by 2H, and negative peaks the opposite case. Systematic increase of intensity near 1100 cm-1 is observed, while intensity systematically decreases near 950-1000 cm-1. Those changes reflect increasing and decreasing contributions of Q3 and Q2 units to the Raman signal, respectively, with substitution of 1H by 2H. The contributions between 850 and 930 cm-1 are artifacts resulting from the frequency shift of the Si-O-H stretching vibration upon 2H/1H substitution.
Supplementary Information References
Brawer, S.A., White, W.B. (1975) Raman spectroscopic investigation of the structure of silicate glasses. I. The binary alkali silicates. The Journal of Chemical Physics 63, 2421-2432.
Show in context In particular, signals at ~950, ~1040, ~1090, and ~1150 cm-1 are assigned to the symmetric stretching of Si-O bonds in Q2 units, the asymmetric stretching of Si-O bonds in any Qn units, and the symmetric stretching of Si-O bonds in Q3 units and in Q4 units, respectively (Brawer and White, 1975, 1977; Virgo et al., 1980; Furukawa et al., 1981; Mysen et al., 1982; McMillan, 1984; see also peak fitting results in Mysen, 1990; Le Losq et al., 2015a).
View in Supplementary Information
Brawer, S.A., White, W.B. (1977) Raman spectroscopic investigation of the structure of silicate glasses (II). Soda-Alkaline earth-Alumina ternary and quaternary glasses. Journal of Non-Crystalline Solids 23, 261-278.
Show in context In particular, signals at ~950, ~1040, ~1090, and ~1150 cm-1 are assigned to the symmetric stretching of Si-O bonds in Q2 units, the asymmetric stretching of Si-O bonds in any Qn units, and the symmetric stretching of Si-O bonds in Q3 units and in Q4 units, respectively (Brawer and White, 1975, 1977; Virgo et al., 1980; Furukawa et al., 1981; Mysen et al., 1982; McMillan, 1984; see also peak fitting results in Mysen, 1990; Le Losq et al., 2015a).
View in Supplementary Information
Cody, G.D., Mysen, B.O., Lee, S.K. (2005) Structure vs. composition: A solid-state 1H and 29Si NMR study of quenched glasses along the Na2O-SiO2-H2O join. Geochimica et Cosmochimica Acta 69, 2373-2384.
Show in context See Cody et al. (2005) and Le Losq et al. (2015b) for further analytical details.
View in Supplementary Information
In alkali tetrasilicate melts at their glass transition temperature, water is dissolved as H2Omol molecules and as OH groups bonded to Si or the alkalis (Cody et al., 2005; Mysen and Cody, 2005; Xue and Kanzaki, 2009; Le Losq et al., 2015a).
View in Supplementary Information
With increasing water content in the glasses, the signals between 900-1100 cm-1 become more intense, reflecting the depolymerisation of the tetrahedral network that occurs with solution of water (Zotov and Keppler, 1998; Cody et al., 2005; Mysen and Cody, 2005).
View in Supplementary Information
Dalou, C., Le Losq, C., Mysen, B.O. (2015) In situ study of the fractionation of hydrogen isotopes between aluminosilicate melts and coexisting aqueous fluids at high pressure and high temperature–Implications for the δD in magmatic processes. Earth and Planetary Science Letters 426, 158-166.
Show in context The 2H/1H ratios were determined with the ratio of integrated areas of the Raman bands assigned to O-2H and O-1D stretch vibrations (Foustoukos and Mysen, 2012; Dalou et al., 2015).
View in article
Foustoukos, D.I., Mysen, B.O. (2012) D/H fractionation in the H2–H2O system at supercritical water conditions: compositional and hydrogen bonding effects. Geochimica et Cosmochimica Acta 86, 88-102.
Show in context For water content determination, the treatment of the Raman spectra is slightly different as the baseline is also fitted to the basis of the bands located near 2600 and 3600 cm-1, respectively assigned to O-D and O-H stretching (see Foustoukos and Mysen, 2012, and references cited therein).
View in Supplementary Information
The 2H/1H ratios were determined with the ratio of integrated areas of the Raman bands assigned to O-2H and O-1D stretch vibrations (Foustoukos and Mysen, 2012; Dalou et al., 2015).
View in article
Furukawa, T., Fox, K.E., White, W.B. (1981) Raman spectroscopic investigation of the structure of silicate glasses. III. Raman intensities and structural units in sodium silicate glasses. Journal of Chemical Physics 75, 3226-3237.
Show in context In particular, signals at ~950, ~1040, ~1090, and ~1150 cm-1 are assigned to the symmetric stretching of Si-O bonds in Q2 units, the asymmetric stretching of Si-O bonds in any Qn units, and the symmetric stretching of Si-O bonds in Q3 units and in Q4 units, respectively (Brawer and White, 1975, 1977; Virgo et al., 1980; Furukawa et al., 1981; Mysen et al., 1982; McMillan, 1984; see also peak fitting results in Mysen, 1990; Le Losq et al., 2015a).
View in Supplementary Information
Le Losq, C., Neuville, D.R., Moretti, R., Roux, J. (2012) Determination of Water Content in Silicate Glasses using Raman Spectrometry, Implications for the study of explosive volcanism. American Mineralogist 97, 779-790.
Show in context Such a process allows quantitative comparison of spectra (e.g., Le Losq et al., 2012; Neuville et al., 2014).
View in Supplementary Information
Water concentrations of the 1H2O- and 2H2O-bearing glasses were checked with Raman spectroscopy, using the calibration that links the glass water content measured by Infrared (or another technique) to the ratio between the areas of the Raman bands assigned to silicate vibrations and to the O-1H or O-2H stretching vibration as described by Le Losq et al. (2012).
View in Supplementary Information
Le Losq, C., Mysen, B.O., Cody, G.D. (2015a) Water and magmas: insights about the water solution mechanisms in alkali silicate melts from infrared, Raman, and 29Si solid-state NMR spectroscopies. Progress in Earth and Planetary Sciences 2, 22, doi: 10.1186/s40645-015-0052-7.
Show in context Anhydrous Li2Si4O9 (LS4), Na2Si4O9 (NS4) and K2Si4O9 (KS4) glass starting materials used here are the same as those described in Le Losq et al. (2015a,b,c).
View in Supplementary Information
Hydrous glasses, containing pure 1H2O, pure 2H2O or a 50:50 mixture of 1H2O-2H2O, were formed by temperature-quenching melts hydrated at high pressure and temperature in platinum capsules by using a piston-cylinder apparatus, following the protocol described in Le Losq et al. (2015a,b,c; see Table S-1 for water content measurements and experimental conditions).
View in Supplementary Information
Table S-1 [...] Endmembers and Mixed respectively refer to the products containing only 1H2O or 2H2O, and to those prepared with the 50:50 mixture of 2H2O + 1H2O. 1H2O concentrations of endmembers are from Le Losq et al. (2015a,b).
View in Supplementary Information
Raman spectra were recorded with a Jasco® NRS 3100 spectrometer as described in Le Le Losq et al. (2015a,b).
View in Supplementary Information
In alkali tetrasilicate melts at their glass transition temperature, water is dissolved as H2Omol molecules and as OH groups bonded to Si or the alkalis (Cody et al., 2005; Mysen and Cody, 2005; Xue and Kanzaki, 2009; Le Losq et al., 2015a).
View in Supplementary Information
In particular, signals at ~950, ~1040, ~1090, and ~1150 cm-1 are assigned to the symmetric stretching of Si-O bonds in Q2 units, the asymmetric stretching of Si-O bonds in any Qn units, and the symmetric stretching of Si-O bonds in Q3 units and in Q4 units, respectively (Brawer and White, 1975, 1977; Virgo et al., 1980; Furukawa et al., 1981; Mysen et al., 1982; McMillan, 1984; see also peak fitting results in Mysen, 1990; Le Losq et al., 2015a).
View in Supplementary Information
Increasing the alkali ionic radius promotes the latter effect (Le Losq et al., 2015a).
View in Supplementary Information
Le Losq, C., Cody, G.D., Mysen, B.O. (2015b) Alkali influence on the water speciation and the environment of protons in silicate glasses revealed by 1H MAS NMR spectroscopy. American Mineralogist 100, 466-473.
Show in context Anhydrous Li2Si4O9 (LS4), Na2Si4O9 (NS4) and K2Si4O9 (KS4) glass starting materials used here are the same as those described in Le Losq et al. (2015a,b,c).
View in Supplementary Information
Hydrous glasses, containing pure 1H2O, pure 2H2O or a 50:50 mixture of 1H2O-2H2O, were formed by temperature-quenching melts hydrated at high pressure and temperature in platinum capsules by using a piston-cylinder apparatus, following the protocol described in Le Losq et al. (2015a,b,c; see Table S-1 for water content measurements and experimental conditions).
View in Supplementary Information
Table S-1 [...] Endmembers and Mixed respectively refer to the products containing only 1H2O or 2H2O, and to those prepared with the 50:50 mixture of 2H2O + 1H2O. 1H2O concentrations of endmembers are from Le Losq et al. (2015a,b).
View in Supplementary Information
Table S-1 [...] The Raman-based technique of Le Losq et al. (2015b) was used to determine the concentration of 1H2O, 2H2O or of 1H2O+2H2O in the glasses.
View in Supplementary Information
Raman spectra were recorded with a Jasco® NRS 3100 spectrometer as described in Le Le Losq et al. (2015a,b).
View in Supplementary Information
It is described in detail in Le Losq et al. (2015b), such that we refer the reader to this publication.
View in Supplementary Information
See Cody et al. (2005) and Le Losq et al. (2015b) for further analytical details.
View in Supplementary Information
We used the calibration curve determined by Le Losq et al. (2015b) for simple alkali silicate glasses.
View in Supplementary Information
These features correspond to protons and deuterons existing in, at least, 5 different environments in the silicate glasses (Le Losq et al., 2015b and references therein).
View in Supplementary Information
Therefore, at constant water content, changes in the 1H and 2H isotropic NMR spectra reflect how both 1H and 2H populate environments with smaller O-O distances, and hence, smaller structural volumes with increasing ionic radius of the alkali metal (Figs. 1, S-1, S-2; Le Losq et al., 2015b).
View in Supplementary Information
Le Losq, C., Cody, G.D., Mysen, B.O. (2015c) Complex stretching signal of OH groups in silicate glasses: implication for the use of the 4500 cm-1 IR peak as a marker of OH- groups concentration. American Mineralogist 100, 945-950.
Show in context Anhydrous Li2Si4O9 (LS4), Na2Si4O9 (NS4) and K2Si4O9 (KS4) glass starting materials used here are the same as those described in Le Losq et al. (2015a,b,c).
View in Supplementary Information
Hydrous glasses, containing pure 1H2O, pure 2H2O or a 50:50 mixture of 1H2O-2H2O, were formed by temperature-quenching melts hydrated at high pressure and temperature in platinum capsules by using a piston-cylinder apparatus, following the protocol described in Le Losq et al. (2015a,b,c; see Table S-1 for water content measurements and experimental conditions).
View in Supplementary Information
Maekawa, H., Maekawa, T., Kawamura, K., Yokohama, T. (1991) The structural groups of alkali silicate glasses determined from 29Si MAS-NMR. Journal of Non-Crystalline Solids 127, 53-64.
Show in context This agrees with previous Raman and 29Si NMR results (Mysen, 1990; Maekawa et al., 1991; Zotov and Keppler, 1998; Mysen and Cody, 2005).
View in Supplementary Information
Malfait, W.J. (2009) The 4500 cm-1 infrared absorption band in hydrous aluminosilicate glasses is a combination band of the fundamental {Si,Al}-OH and O-H vibrations. American Mineralogist 94, 849-852.
Show in context This peak is typically assigned to vibrations of OH groups bonded to the silicate network (McMillan et al., 1993; Zotov and Keppler, 1998; Malfait, 2009, Spiekermann et al., 2012).
View in Supplementary Information
McMillan, P.F. (1984) Structural studies of silicate glasses and melts - Applications and limitations of Raman spectroscopy. American Mineralogist 69, 622-644.
Show in context In particular, signals at ~950, ~1040, ~1090, and ~1150 cm-1 are assigned to the symmetric stretching of Si-O bonds in Q2 units, the asymmetric stretching of Si-O bonds in any Qn units, and the symmetric stretching of Si-O bonds in Q3 units and in Q4 units, respectively (Brawer and White, 1975, 1977; Virgo et al., 1980; Furukawa et al., 1981; Mysen et al., 1982; McMillan, 1984; see also peak fitting results in Mysen, 1990; Le Losq et al., 2015a).
View in Supplementary Information
McMillan, P.F., Poe, B.T., Stanton, T.R., Remmele, R.L. (1993) A Raman spectroscopic study of H/D isotopically substituted hydrous aluminosilicate glasses. Physic and Chemistry of Minerals 19, 454-459.
Show in context This peak is typically assigned to vibrations of OH groups bonded to the silicate network (McMillan et al., 1993; Zotov and Keppler, 1998; Malfait, 2009, Spiekermann et al., 2012).
View in Supplementary Information
Métrich, N., Bertagnini, A., Garaebiti, E., Vergniolle, S., Bani, P., Beaumais, A., Neuville, D.R. (2015) Magma transfer and degassing budget: Application to the 2009–2010 eruptive crisis of Mt Garet (Vanuatu arc). Journal of Volcanology and Geothermal Research, doi:10.1016/j.jvolgeores.2015.06.003.
Show in context The method has been shown to determine accurately the water content of natural glasses (Shea et al., 2014; Métrich et al., 2015).
View in Supplementary Information
Mysen, B.O. (1990) Role of Al in depolymerized, peralkaline aluminosilicate melts in the systems Li2O-Al2O3-SiO2, Na2O-Al2O3-SiO2, and K2O-Al2O3-SiO2. American Mineralogist 75, 120-134.
Show in context In particular, signals at ~950, ~1040, ~1090, and ~1150 cm-1 are assigned to the symmetric stretching of Si-O bonds in Q2 units, the asymmetric stretching of Si-O bonds in any Qn units, and the symmetric stretching of Si-O bonds in Q3 units and in Q4 units, respectively (Brawer and White, 1975, 1977; Virgo et al., 1980; Furukawa et al., 1981; Mysen et al., 1982; McMillan, 1984; see also peak fitting results in Mysen, 1990; Le Losq et al., 2015a).
View in Supplementary Information
This agrees with previous Raman and 29Si NMR results (Mysen, 1990; Maekawa et al., 1991; Zotov and Keppler, 1998; Mysen and Cody, 2005).
View in Supplementary Information
Mysen, B.O., Cody, G. (2005) Solution mechanisms of H2O in depolymerized peralkaline melts. Geochimica et Cosmochimica Acta 69, 5557-5566.
Show in context In alkali tetrasilicate melts at their glass transition temperature, water is dissolved as H2Omol molecules and as OH groups bonded to Si or the alkalis (Cody et al., 2005; Mysen and Cody, 2005; Xue and Kanzaki, 2009; Le Losq et al., 2015a).
View in Supplementary Information
This agrees with previous Raman and 29Si NMR results (Mysen, 1990; Maekawa et al., 1991; Zotov and Keppler, 1998; Mysen and Cody, 2005).
View in Supplementary Information
With increasing water content in the glasses, the signals between 900-1100 cm-1 become more intense, reflecting the depolymerisation of the tetrahedral network that occurs with solution of water (Zotov and Keppler, 1998; Cody et al., 2005; Mysen and Cody, 2005).
View in Supplementary Information
Mysen, B.O., Finger, L.W., Virgo, D., Seifert, F.A. (1982) Curve-fitting of Raman spectra of silicate glasses. American Mineralogist 67, 686-695.
Show in context In particular, signals at ~950, ~1040, ~1090, and ~1150 cm-1 are assigned to the symmetric stretching of Si-O bonds in Q2 units, the asymmetric stretching of Si-O bonds in any Qn units, and the symmetric stretching of Si-O bonds in Q3 units and in Q4 units, respectively (Brawer and White, 1975, 1977; Virgo et al., 1980; Furukawa et al., 1981; Mysen et al., 1982; McMillan, 1984; see also peak fitting results in Mysen, 1990; Le Losq et al., 2015a).
View in Supplementary Information
Neuville, D.R., de Ligny, D., Henderson, G.S. (2014) Advances in Raman spectroscopy applied to earth and material sciences. Reviews in Mineralogy and Geochemistry 78, 509-541.
Show in context They are not corrected from excitation line and temperature effects, as we are interested in observing changes at Raman shifts above ~400 cm-1, where such correction is unnecessary (Neuville et al., 2014).
View in Supplementary Information
Such a process allows quantitative comparison of spectra (e.g., Le Losq et al., 2012; Neuville et al., 2014).
View in Supplementary Information
Shea, T., Hellebrand, E., Gurioli, L., Tuffen, H. (2014) Conduit-to localized-scale degassing during Plinian Eruptions: Insights from major element and volatile (Cl and H2O) analyses within Vesuvius AD 79 pumice. Journal of Petrology 55, 315-344.
Show in context The method has been shown to determine accurately the water content of natural glasses (Shea et al., 2014; Métrich et al., 2015).
View in Supplementary Information
Spiekermann, G., Steel-McInnis, M., Schmidt, C., Jahn, S. (2012) Vibrational mode frequencies of silica species in SiO2-H2O liquids and glasses from ab initio molecular dynamics. The Journal of Chemical Physics 136, 154501.
Show in context This peak is typically assigned to vibrations of OH groups bonded to the silicate network (McMillan et al., 1993; Zotov and Keppler, 1998; Malfait, 2009, Spiekermann et al., 2012).
View in Supplementary Information
Virgo, D., Mysen, B.O., Kushiro, I. (1980) Anionic constitution of silicate melts quenched at 1 atm from Raman spectroscopy: Implications for the structure of igneous melts. Science 208, 1371-1373.
Show in context In particular, signals at ~950, ~1040, ~1090, and ~1150 cm-1 are assigned to the symmetric stretching of Si-O bonds in Q2 units, the asymmetric stretching of Si-O bonds in any Qn units, and the symmetric stretching of Si-O bonds in Q3 units and in Q4 units, respectively (Brawer and White, 1975, 1977; Virgo et al., 1980; Furukawa et al., 1981; Mysen et al., 1982; McMillan, 1984; see also peak fitting results in Mysen, 1990; Le Losq et al., 2015a).
View in Supplementary Information
Wang, Y., Cody, S.X., Foustoukos, D., Mysen, B.O., Cody, G.D. (2015) Very large differences in intramolecular D-H partitioning in hydrated silicate melts synthesized at upper mantle pressures and temperatures. American Mineralogist 100, 1182-1189.
Show in context Isotropic 2H MAS NMR spectra, i.e. spectra that do not exhibit the classic effects of the 2H quadrupolar coupling interaction, and that are therefore, completely comparable to the 1H MAS NMR spectra, were obtained by rotor-synchronised acquisition following the protocol described in Wang et al. (2015).
View in article
The HF, MF and LF regions in the 2H isotropic NMR spectra also correlate with the degree of shielding of 2H, related to O-O distances (Wang et al., 2015).
View in article
At any given water content and alkali metal radius, differences between the isotropic 1H and 2H MAS NMR spectra are not due to instrumental or quench effects (Wang et al., 2015) but reflect differences in the population of 1H and 2H nuclei between the different structural environments in the glasses.
View in article
Xue, X., Kanzaki, M. (2009) Proton distributions and hydrogen bonding in crystalline and glassy hydrous silicates and related inorganic materials: insights from high-resolution solid-state Nuclear Magnetic Resonance spectroscopy. Journal of the American Ceramic Society 92, 2803-2830.
Show in context Figure S-1 [...] The O-O distances of O-H…O bonds (with – an ionic-covalent bond and … a hydrogen bond) determined from the 1H chemical shift (equation from Xue and Kanzaki, 2009) are shown on the upper horizontal axis.
View in Supplementary Information
Figure S-2 [...] The O-O distances of O-H…O bonds determined from the 1H chemical shift (equation from Xue and Kanzaki, 2009) are shown on the upper horizontal axis.
View in Supplementary Information
These reflect 1H nuclei in O-H…O environments with mean O-O distances of ~245, ~295 and 305 pm, respectively (Xue and Kanzaki, 2009 and references therein).
View in Supplementary Information
In alkali tetrasilicate melts at their glass transition temperature, water is dissolved as H2Omol molecules and as OH groups bonded to Si or the alkalis (Cody et al., 2005; Mysen and Cody, 2005; Xue and Kanzaki, 2009; Le Losq et al., 2015a).
View in Supplementary Information
Zotov, N., Keppler, H. (1998) The influence of water on the structure of hydrous sodium tetrasilicate glasses. American Mineralogist 83, 823-834.
Show in context This peak is typically assigned to vibrations of OH groups bonded to the silicate network (McMillan et al., 1993; Zotov and Keppler, 1998; Malfait, 2009, Spiekermann et al., 2012).
View in Supplementary Information
This agrees with previous Raman and 29Si NMR results (Mysen, 1990; Maekawa et al., 1991; Zotov and Keppler, 1998; Mysen and Cody, 2005).
View in Supplementary Information
With increasing water content in the glasses, the signals between 900-1100 cm-1 become more intense, reflecting the depolymerisation of the tetrahedral network that occurs with solution of water (Zotov and Keppler, 1998; Cody et al., 2005; Mysen and Cody, 2005).
View in Supplementary Information
Supplementary Information
Supplementary Methods and Results
Sample preparation
Anhydrous Li2Si4O9 (LS4), Na2Si4O9 (NS4) and K2Si4O9 (KS4) glass starting materials used here are the same as those described in Le Losq et al. (2015a
Le Losq, C., Mysen, B.O., Cody, G.D. (2015a) Water and magmas: insights about the water solution mechanisms in alkali silicate melts from infrared, Raman, and 29Si solid-state NMR spectroscopies. Progress in Earth and Planetary Sciences 2, 22, doi: 10.1186/s40645-015-0052-7.
,bLe Losq, C., Cody, G.D., Mysen, B.O. (2015b) Alkali influence on the water speciation and the environment of protons in silicate glasses revealed by 1H MAS NMR spectroscopy. American Mineralogist 100, 466-473.
,cLe Losq, C., Cody, G.D., Mysen, B.O. (2015c) Complex stretching signal of OH groups in silicate glasses: implication for the use of the 4500 cm-1 IR peak as a marker of OH- groups concentration. American Mineralogist 100, 945-950.
). Hydrous glasses, containing pure 1H2O, pure 2H2O or a 50:50 mixture of 1H2O-2H2O, were formed by temperature-quenching melts hydrated at high pressure and temperature in platinum capsules by using a piston-cylinder apparatus, following the protocol described in Le Losq et al. (2015aLe Losq, C., Mysen, B.O., Cody, G.D. (2015a) Water and magmas: insights about the water solution mechanisms in alkali silicate melts from infrared, Raman, and 29Si solid-state NMR spectroscopies. Progress in Earth and Planetary Sciences 2, 22, doi: 10.1186/s40645-015-0052-7.
,bLe Losq, C., Cody, G.D., Mysen, B.O. (2015b) Alkali influence on the water speciation and the environment of protons in silicate glasses revealed by 1H MAS NMR spectroscopy. American Mineralogist 100, 466-473.
,cLe Losq, C., Cody, G.D., Mysen, B.O. (2015c) Complex stretching signal of OH groups in silicate glasses: implication for the use of the 4500 cm-1 IR peak as a marker of OH- groups concentration. American Mineralogist 100, 945-950.
; see Table S-1 for water content measurements and experimental conditions).Table S-1 Water concentration and synthesis conditions of the quenched melts. Nom. water refers to the nominal 1H2O or 2H2O concentrations. Endmembers and Mixed respectively refer to the products containing only 1H2O or 2H2O, and to those prepared with the 50:50 mixture of 2H2O + 1H2O. 1H2O concentrations of endmembers are from Le Losq et al. (2015a
Le Losq, C., Mysen, B.O., Cody, G.D. (2015a) Water and magmas: insights about the water solution mechanisms in alkali silicate melts from infrared, Raman, and 29Si solid-state NMR spectroscopies. Progress in Earth and Planetary Sciences 2, 22, doi: 10.1186/s40645-015-0052-7.
,bLe Losq, C., Cody, G.D., Mysen, B.O. (2015b) Alkali influence on the water speciation and the environment of protons in silicate glasses revealed by 1H MAS NMR spectroscopy. American Mineralogist 100, 466-473.
). The Raman-based technique of Le Losq et al. (2015b)Le Losq, C., Cody, G.D., Mysen, B.O. (2015b) Alkali influence on the water speciation and the environment of protons in silicate glasses revealed by 1H MAS NMR spectroscopy. American Mineralogist 100, 466-473.
was used to determine the concentration of 1H2O, 2H2O or of 1H2O+2H2O in the glasses. However, as it has not been cross-validated with another technique for the 2H2O and 1H2O+2H2O concentrations, no error bars are provided. Other errors are given at the 1σ confidence interval.Download in Excel
Raman and NMR spectroscopy
Raman spectra were recorded with a Jasco® NRS 3100 spectrometer as described in Le Le Losq et al. (2015a
Le Losq, C., Mysen, B.O., Cody, G.D. (2015a) Water and magmas: insights about the water solution mechanisms in alkali silicate melts from infrared, Raman, and 29Si solid-state NMR spectroscopies. Progress in Earth and Planetary Sciences 2, 22, doi: 10.1186/s40645-015-0052-7.
,bLe Losq, C., Cody, G.D., Mysen, B.O. (2015b) Alkali influence on the water speciation and the environment of protons in silicate glasses revealed by 1H MAS NMR spectroscopy. American Mineralogist 100, 466-473.
). Raman spectra were recorded with a 2400 lines/mm grating, which results in an accuracy of ±3 cm-1. Precision was ±1 cm-1. Alignment of the Raman spectrometer was tested against the 520.7 cm-1 Raman peak of pure Si. All spectra reported in this study are unpolarised. They are not corrected from excitation line and temperature effects, as we are interested in observing changes at Raman shifts above ~400 cm-1, where such correction is unnecessary (Neuville et al., 2014Neuville, D.R., de Ligny, D., Henderson, G.S. (2014) Advances in Raman spectroscopy applied to earth and material sciences. Reviews in Mineralogy and Geochemistry 78, 509-541.
).For analysis of the signals assigned to vibrations of silicate units, Raman spectra were treated as follows. A simple horizontal constant baseline was adjusted to the intensity in the 1270-1300 cm-1 portion of spectra, where no signal is observed. After baseline removal, intensity was normalised to the total area of the spectra. Such a process allows quantitative comparison of spectra (e.g., Le Losq et al., 2012
Le Losq, C., Neuville, D.R., Moretti, R., Roux, J. (2012) Determination of Water Content in Silicate Glasses using Raman Spectrometry, Implications for the study of explosive volcanism. American Mineralogist 97, 779-790.
; Neuville et al., 2014Neuville, D.R., de Ligny, D., Henderson, G.S. (2014) Advances in Raman spectroscopy applied to earth and material sciences. Reviews in Mineralogy and Geochemistry 78, 509-541.
). For water content determination, the treatment of the Raman spectra is slightly different as the baseline is also fitted to the basis of the bands located near 2600 and 3600 cm-1, respectively assigned to O-D and O-H stretching (see Foustoukos and Mysen, 2012Foustoukos, D.I., Mysen, B.O. (2012) D/H fractionation in the H2–H2O system at supercritical water conditions: compositional and hydrogen bonding effects. Geochimica et Cosmochimica Acta 86, 88-102.
, and references cited therein). It is described in detail in Le Losq et al. (2015b)Le Losq, C., Cody, G.D., Mysen, B.O. (2015b) Alkali influence on the water speciation and the environment of protons in silicate glasses revealed by 1H MAS NMR spectroscopy. American Mineralogist 100, 466-473.
, such that we refer the reader to this publication.Hydrogen-1 and Hydrogen-2 solid-state NMR experiments were carried out with a Varian-Chemagnetics CMX Infinity 300 solid-state NMR spectrometer with a static field strength of ~7.05 T. The 1H spectra were acquired using a Magic Angle Spinning (MAS) frequency (ωr/2π) of 22 KHz, 16 cycle DEPTH sequence, 1H pulse length of 2.5 µs, recycle delay of 100 s, and 1600 acquisitions. They are referenced to tetramethylsilane. See Cody et al. (2005)
Cody, G.D., Mysen, B.O., Lee, S.K. (2005) Structure vs. composition: A solid-state 1H and 29Si NMR study of quenched glasses along the Na2O-SiO2-H2O join. Geochimica et Cosmochimica Acta 69, 2373-2384.
and Le Losq et al. (2015b)Le Losq, C., Cody, G.D., Mysen, B.O. (2015b) Alkali influence on the water speciation and the environment of protons in silicate glasses revealed by 1H MAS NMR spectroscopy. American Mineralogist 100, 466-473.
for further analytical details. Isotropic 2H MAS NMR spectra, i.e. spectra that do not exhibit the classic effects of the 2H quadrupolar coupling interaction, and that are therefore, completely comparable to the 1H MAS NMR spectra, were obtained by rotor-synchronised acquisition following the protocol described in Wang et al. (2015).Water concentrations
Water concentrations of the 1H2O- and 2H2O-bearing glasses were checked with Raman spectroscopy, using the calibration that links the glass water content measured by Infrared (or another technique) to the ratio between the areas of the Raman bands assigned to silicate vibrations and to the O-1H or O-2H stretching vibration as described by Le Losq et al. (2012)
Le Losq, C., Neuville, D.R., Moretti, R., Roux, J. (2012) Determination of Water Content in Silicate Glasses using Raman Spectrometry, Implications for the study of explosive volcanism. American Mineralogist 97, 779-790.
. We used the calibration curve determined by Le Losq et al. (2015b)Le Losq, C., Cody, G.D., Mysen, B.O. (2015b) Alkali influence on the water speciation and the environment of protons in silicate glasses revealed by 1H MAS NMR spectroscopy. American Mineralogist 100, 466-473.
for simple alkali silicate glasses. The method has been shown to determine accurately the water content of natural glasses (Shea et al., 2014Shea, T., Hellebrand, E., Gurioli, L., Tuffen, H. (2014) Conduit-to localized-scale degassing during Plinian Eruptions: Insights from major element and volatile (Cl and H2O) analyses within Vesuvius AD 79 pumice. Journal of Petrology 55, 315-344.
; Métrich et al., 2015Métrich, N., Bertagnini, A., Garaebiti, E., Vergniolle, S., Bani, P., Beaumais, A., Neuville, D.R. (2015) Magma transfer and degassing budget: Application to the 2009–2010 eruptive crisis of Mt Garet (Vanuatu arc). Journal of Volcanology and Geothermal Research, doi:10.1016/j.jvolgeores.2015.06.003.
).The 2H/1H ratios were determined with the ratio of integrated areas of the Raman bands assigned to O-2H and O-1D stretch vibrations (Mysen, 2010
Mysen, B.O., Fogel, M.L. (2010) Nitrogen and hydrogen isotope compositions and solubility in silicate melts in equilibrium with reduced (N+ H)-bearing fluids at high pressure and temperature: effects of melt structure. American Mineralogist 95, 987-999.
; Foustoukos and Mysen, 2012Foustoukos, D.I., Mysen, B.O. (2012) D/H fractionation in the H2–H2O system at supercritical water conditions: compositional and hydrogen bonding effects. Geochimica et Cosmochimica Acta 86, 88-102.
; Dalou et al., 2015Dalou, C., Le Losq, C., Mysen, B.O. (2015) In situ study of the fractionation of hydrogen isotopes between aluminosilicate melts and coexisting aqueous fluids at high pressure and high temperature–Implications for the δD in magmatic processes. Earth and Planetary Science Letters 426, 158-166.
). The method was validated with spectra of LS4 and NS4 glasses containing a nominal 50:50 mixture of 2H2O and 1H2O. The area ratios of the Raman peaks assigned to the O-2H and the O-1H stretching vibrations lead to the nominal 50:50 2H/1H ratio (Table S-1). For KS4 glasses, no 2H/1H ratio measurement was possible because the bands assigned to the O-1H and O-2H stretching vibrations overlap strongly. The fact that the 2H/1H ratios of the glasses as measured by the area ratio method agree with nominal values indicates that the Raman cross sections of the O-2H and O-1H stretching vibrations are similar at room temperature in glasses. As a consequence, the 1H2O-based calibration of total water contents was used to estimate the 2H2O and the 1H2O+2H2O concentrations of the glasses. However, as it has not been cross-validated by another technique, no error bars are provided for those values (Table S-1).Note on the interpretation of 1H and 2H MAS NMR spectra
The 1H and 2H isotropic MAS NMR spectra of all glasses exhibit two intense peaks located near 5 and 16 ppm with shoulders near 3.5 and 12 ppm, respectively, and a small sharp peak near 1.8 ppm (Figs. 1, S-1, S-2). These features correspond to protons and deuterons existing in, at least, 5 different environments in the silicate glasses (Le Losq et al., 2015b
Le Losq, C., Cody, G.D., Mysen, B.O. (2015b) Alkali influence on the water speciation and the environment of protons in silicate glasses revealed by 1H MAS NMR spectroscopy. American Mineralogist 100, 466-473.
and references therein).Figure S-1 Superposition of 1H and 2H isotropic MAS NMR spectra of the silicate glasses containing pure 1H2O or 2H2O for different 1H2O and 2H2O concentrations as indicated on individual spectra (mol %). Blue and red lines are the 1H and 2H NMR signals, respectively. The O-O distances of O-H…O bonds (with – an ionic-covalent bond and … a hydrogen bond) determined from the 1H chemical shift (equation from Xue and Kanzaki, 2009
Xue, X., Kanzaki, M. (2009) Proton distributions and hydrogen bonding in crystalline and glassy hydrous silicates and related inorganic materials: insights from high-resolution solid-state Nuclear Magnetic Resonance spectroscopy. Journal of the American Ceramic Society 92, 2803-2830.
) are shown on the upper horizontal axis.Figure S-2 1H and 2H isotropic MAS NMR spectra of the alkali tetrasilicate glasses with 1H2O and 2H2O in a 1:1 molar ratio (total 1H2O + 2H2O molar content of 9.4 mol %). Blue lines and red lines are the 1H and 2H NMR signals, respectively. The O-O distances of O-H…O bonds determined from the 1H chemical shift (equation from Xue and Kanzaki, 2009
Xue, X., Kanzaki, M. (2009) Proton distributions and hydrogen bonding in crystalline and glassy hydrous silicates and related inorganic materials: insights from high-resolution solid-state Nuclear Magnetic Resonance spectroscopy. Journal of the American Ceramic Society 92, 2803-2830.
) are shown on the upper horizontal axis.The NMR spectra can be divided into three frequency regions (Figs. 1, S-1, S-2). The high (HF), middle (MF) and low (LF) frequency regions are centred on the main peaks near 16 ppm (encompassing the 12 ppm signal), 5 ppm (encompassing the 3.5 ppm signal) and 1.8ppm, respectively. These reflect 1H nuclei in O-H…O environments with mean O-O distances of ~245, ~295 and 305 pm, respectively (Xue and Kanzaki, 2009
Xue, X., Kanzaki, M. (2009) Proton distributions and hydrogen bonding in crystalline and glassy hydrous silicates and related inorganic materials: insights from high-resolution solid-state Nuclear Magnetic Resonance spectroscopy. Journal of the American Ceramic Society 92, 2803-2830.
and references therein). The HF, MF and LF regions in the 2H isotropic NMR spectra also correlate with the degree of shielding of 2H, related to O-O distances (Wang et al., 2015). Therefore, at constant water content, changes in the 1H and 2H isotropic NMR spectra reflect how both 1H and 2H populate environments with smaller O-O distances, and hence, smaller structural volumes with increasing ionic radius of the alkali metal (Figs. 1, S-1, S-2; Le Losq et al., 2015bLe Losq, C., Cody, G.D., Mysen, B.O. (2015b) Alkali influence on the water speciation and the environment of protons in silicate glasses revealed by 1H MAS NMR spectroscopy. American Mineralogist 100, 466-473.
). At any given water content and alkali metal radius, differences between the isotropic 1H and 2H MAS NMR spectra are not due to instrumental or quench effects (Wang et al., 2015) but reflect differences in the population of 1H and 2H nuclei between the different structural environments in the glasses.The αHF-MF "(= 2H/1HHF / 2H/1HMF)" intramolecular fractionation factors have been obtained by first determining the 2HHF, 1HHF, 2HMF and 1HMF areas in the HF and LF regions of the 1H and 2H isotropic NMR spectra by trapezoidal integration, and then by dividing the integrated areas as (2HHF/1HHF) /(2HMF/1HMF).
Assignment of bands and interpretation of Raman spectra of alkali silicate glasses
In alkali tetrasilicate melts at their glass transition temperature, water is dissolved as H2Omol molecules and as OH groups bonded to Si or the alkalis (Cody et al., 2005
Cody, G.D., Mysen, B.O., Lee, S.K. (2005) Structure vs. composition: A solid-state 1H and 29Si NMR study of quenched glasses along the Na2O-SiO2-H2O join. Geochimica et Cosmochimica Acta 69, 2373-2384.
; Mysen and Cody, 2005Mysen, B.O., Cody, G. (2005) Solution mechanisms of H2O in depolymerized peralkaline melts. Geochimica et Cosmochimica Acta 69, 5557-5566.
; Xue and Kanzaki, 2009Xue, X., Kanzaki, M. (2009) Proton distributions and hydrogen bonding in crystalline and glassy hydrous silicates and related inorganic materials: insights from high-resolution solid-state Nuclear Magnetic Resonance spectroscopy. Journal of the American Ceramic Society 92, 2803-2830.
; Le Losq et al., 2015aLe Losq, C., Mysen, B.O., Cody, G.D. (2015a) Water and magmas: insights about the water solution mechanisms in alkali silicate melts from infrared, Raman, and 29Si solid-state NMR spectroscopies. Progress in Earth and Planetary Sciences 2, 22, doi: 10.1186/s40645-015-0052-7.
). The distribution of the Qn tetrahedral units (see Fig. 3) in hydrous silicate glasses changes as a function of the fraction of OH groups bonded to Si. This affects in fine the 850-1300 cm-1 portion of the glasses Raman spectra, in which peaks and shoulders can be assigned to Si-O stretching vibrations in specific Qn units (Fig. 3a). In particular, signals at ~950, ~1040, ~1090, and ~1150 cm-1 are assigned to the symmetric stretching of Si-O bonds in Q2 units, the asymmetric stretching of Si-O bonds in any Qn units, and the symmetric stretching of Si-O bonds in Q3 units and in Q4 units, respectively (Brawer and White, 1975Brawer, S.A., White, W.B. (1975) Raman spectroscopic investigation of the structure of silicate glasses. I. The binary alkali silicates. The Journal of Chemical Physics 63, 2421-2432.
, 1977Brawer, S.A., White, W.B. (1977) Raman spectroscopic investigation of the structure of silicate glasses (II). Soda-Alkaline earth-Alumina ternary and quaternary glasses. Journal of Non-Crystalline Solids 23, 261-278.
; Virgo et al., 1980Virgo, D., Mysen, B.O., Kushiro, I. (1980) Anionic constitution of silicate melts quenched at 1 atm from Raman spectroscopy: Implications for the structure of igneous melts. Science 208, 1371-1373.
; Furukawa et al., 1981Furukawa, T., Fox, K.E., White, W.B. (1981) Raman spectroscopic investigation of the structure of silicate glasses. III. Raman intensities and structural units in sodium silicate glasses. Journal of Chemical Physics 75, 3226-3237.
; Mysen et al., 1982Mysen, B.O., Finger, L.W., Virgo, D., Seifert, F.A. (1982) Curve-fitting of Raman spectra of silicate glasses. American Mineralogist 67, 686-695.
; McMillan, 1984McMillan, P.F. (1984) Structural studies of silicate glasses and melts - Applications and limitations of Raman spectroscopy. American Mineralogist 69, 622-644.
; see also peak fitting results in Mysen, 1990Mysen, B.O. (1990) Role of Al in depolymerized, peralkaline aluminosilicate melts in the systems Li2O-Al2O3-SiO2, Na2O-Al2O3-SiO2, and K2O-Al2O3-SiO2. American Mineralogist 75, 120-134.
; Le Losq et al., 2015aLe Losq, C., Mysen, B.O., Cody, G.D. (2015a) Water and magmas: insights about the water solution mechanisms in alkali silicate melts from infrared, Raman, and 29Si solid-state NMR spectroscopies. Progress in Earth and Planetary Sciences 2, 22, doi: 10.1186/s40645-015-0052-7.
). Another signal near 900 cm-1 is visible in the Raman spectra of the hydrous alkali silicate glasses. This peak is typically assigned to vibrations of OH groups bonded to the silicate network (McMillan et al., 1993McMillan, P.F., Poe, B.T., Stanton, T.R., Remmele, R.L. (1993) A Raman spectroscopic study of H/D isotopically substituted hydrous aluminosilicate glasses. Physic and Chemistry of Minerals 19, 454-459.
; Zotov and Keppler, 1998Zotov, N., Keppler, H. (1998) The influence of water on the structure of hydrous sodium tetrasilicate glasses. American Mineralogist 83, 823-834.
; Malfait, 2009Malfait, W.J. (2009) The 4500 cm-1 infrared absorption band in hydrous aluminosilicate glasses is a combination band of the fundamental {Si,Al}-OH and O-H vibrations. American Mineralogist 94, 849-852.
, Spiekerman et al., 2012Spiekerman, G., Steel-McInnis, M., Schmidt, C., Jahn, S. (2012) Vibrational mode frequencies of silica species in SiO2-H2O liquids and glasses from ab initio molecular dynamics. The Journal of Chemical Physics 136, 154501.
). Note that its Raman shift decreases in frequency with substitution of 1H by 2H (Fig. 3a, S-3, S-4), indicating a role of 1H and 2H in the origin of this signal.The prominent peak in all Raman spectra near 1100 cm-1, assigned to Si-O stretching in Q3 units, indicates that the latter units dominate in such glasses (Figs. 3a, S-3). Shoulders near 950 and 1150 cm-1, assigned to the Si-O stretching in Q2 and Q4 units, indicate that small proportions of those silicate units are present in the quenched melts. This agrees with previous Raman and 29Si NMR results (Mysen, 1990
Mysen, B.O. (1990) Role of Al in depolymerized, peralkaline aluminosilicate melts in the systems Li2O-Al2O3-SiO2, Na2O-Al2O3-SiO2, and K2O-Al2O3-SiO2. American Mineralogist 75, 120-134.
; Maekawa et al., 1991; Zotov and Keppler, 1998Zotov, N., Keppler, H. (1998) The influence of water on the structure of hydrous sodium tetrasilicate glasses. American Mineralogist 83, 823-834.
; Mysen and Cody, 2005Mysen, B.O., Cody, G. (2005) Solution mechanisms of H2O in depolymerized peralkaline melts. Geochimica et Cosmochimica Acta 69, 5557-5566.
). With increasing water content in the glasses, the signals between 900-1100 cm-1 become more intense, reflecting the depolymerisation of the tetrahedral network that occurs with solution of water (Zotov and Keppler, 1998Zotov, N., Keppler, H. (1998) The influence of water on the structure of hydrous sodium tetrasilicate glasses. American Mineralogist 83, 823-834.
; Cody et al., 2005Cody, G.D., Mysen, B.O., Lee, S.K. (2005) Structure vs. composition: A solid-state 1H and 29Si NMR study of quenched glasses along the Na2O-SiO2-H2O join. Geochimica et Cosmochimica Acta 69, 2373-2384.
; Mysen and Cody, 2005Mysen, B.O., Cody, G. (2005) Solution mechanisms of H2O in depolymerized peralkaline melts. Geochimica et Cosmochimica Acta 69, 5557-5566.
). Increasing the alkali ionic radius promotes the latter effect (Le Losq et al., 2015aLe Losq, C., Mysen, B.O., Cody, G.D. (2015a) Water and magmas: insights about the water solution mechanisms in alkali silicate melts from infrared, Raman, and 29Si solid-state NMR spectroscopies. Progress in Earth and Planetary Sciences 2, 22, doi: 10.1186/s40645-015-0052-7.
). Substitution of 1H by 2H results in increasing and decreasing the intensity of the signals assigned to Si-O stretching in Q3 and Q2 units, respectively (Figs. 3, S-3, S-4), reflecting the slight preferential bonding of 2H to Q3 units.Figure S-3 750-1300 cm-1 portion of all the Raman spectra of the alkali silicate glasses containing pure 1H2O (blue lines) or 2H2O (red lines). 1H2O / 2H2O mol % concentrations are indicated at the right end of each spectrum. See text for discussion and attributions.
Figure S-4 Residual Raman signals after subtraction of the Raman spectra of 2H2O-bearing glasses from those of 1H2O-bearing glasses. Dashed horizontal lines indicate the 0 value for each residual spectrum. Water concentrations, as mol % 1H2O or 2H2O, are indicated at the right end of each residual signal. Positive peaks indicate increasing intensity with substitution of 1H by 2H, and negative peaks the opposite case. Systematic increase of intensity near 1100 cm-1 is observed, while intensity systematically decreases near 950-1000 cm-1. Those changes reflect increasing and decreasing contributions of Q3 and Q2 units to the Raman signal, respectively, with substitution of 1H by 2H. The contributions between 850 and 930 cm-1 are artifacts resulting from the frequency shift of the Si-O-H stretching vibration upon 2H/1H substitution.
Supplementary Information References
Brawer, S.A., White, W.B. (1975) Raman spectroscopic investigation of the structure of silicate glasses. I. The binary alkali silicates. The Journal of Chemical Physics 63, 2421-2432.
Show in context In particular, signals at ~950, ~1040, ~1090, and ~1150 cm-1 are assigned to the symmetric stretching of Si-O bonds in Q2 units, the asymmetric stretching of Si-O bonds in any Qn units, and the symmetric stretching of Si-O bonds in Q3 units and in Q4 units, respectively (Brawer and White, 1975, 1977; Virgo et al., 1980; Furukawa et al., 1981; Mysen et al., 1982; McMillan, 1984; see also peak fitting results in Mysen, 1990; Le Losq et al., 2015a).
View in Supplementary Information
Brawer, S.A., White, W.B. (1977) Raman spectroscopic investigation of the structure of silicate glasses (II). Soda-Alkaline earth-Alumina ternary and quaternary glasses. Journal of Non-Crystalline Solids 23, 261-278.
Show in context In particular, signals at ~950, ~1040, ~1090, and ~1150 cm-1 are assigned to the symmetric stretching of Si-O bonds in Q2 units, the asymmetric stretching of Si-O bonds in any Qn units, and the symmetric stretching of Si-O bonds in Q3 units and in Q4 units, respectively (Brawer and White, 1975, 1977; Virgo et al., 1980; Furukawa et al., 1981; Mysen et al., 1982; McMillan, 1984; see also peak fitting results in Mysen, 1990; Le Losq et al., 2015a).
View in Supplementary Information
View in Supplementary Information
Cody, G.D., Mysen, B.O., Lee, S.K. (2005) Structure vs. composition: A solid-state 1H and 29Si NMR study of quenched glasses along the Na2O-SiO2-H2O join. Geochimica et Cosmochimica Acta 69, 2373-2384.
Show in context See Cody et al. (2005) and Le Losq et al. (2015b) for further analytical details.
View in Supplementary Information
In alkali tetrasilicate melts at their glass transition temperature, water is dissolved as H2Omol molecules and as OH groups bonded to Si or the alkalis (Cody et al., 2005; Mysen and Cody, 2005; Xue and Kanzaki, 2009; Le Losq et al., 2015a).
View in Supplementary Information
With increasing water content in the glasses, the signals between 900-1100 cm-1 become more intense, reflecting the depolymerisation of the tetrahedral network that occurs with solution of water (Zotov and Keppler, 1998; Cody et al., 2005; Mysen and Cody, 2005).
View in Supplementary Information
Dalou, C., Le Losq, C., Mysen, B.O. (2015) In situ study of the fractionation of hydrogen isotopes between aluminosilicate melts and coexisting aqueous fluids at high pressure and high temperature–Implications for the δD in magmatic processes. Earth and Planetary Science Letters 426, 158-166.
Show in context The 2H/1H ratios were determined with the ratio of integrated areas of the Raman bands assigned to O-2H and O-1D stretch vibrations (Mysen, 2010; Foustoukos and Mysen, 2012; Dalou et al., 2015).
View in article
Foustoukos, D.I., Mysen, B.O. (2012) D/H fractionation in the H2–H2O system at supercritical water conditions: compositional and hydrogen bonding effects. Geochimica et Cosmochimica Acta 86, 88-102.
Show in context For water content determination, the treatment of the Raman spectra is slightly different as the baseline is also fitted to the basis of the bands located near 2600 and 3600 cm-1, respectively assigned to O-D and O-H stretching (see Foustoukos and Mysen, 2012, and references cited therein).
View in Supplementary Information
The 2H/1H ratios were determined with the ratio of integrated areas of the Raman bands assigned to O-2H and O-1D stretch vibrations (Mysen, 2010; Foustoukos and Mysen, 2012; Dalou et al., 2015).
View in article
Furukawa, T., Fox, K.E., White, W.B. (1981) Raman spectroscopic investigation of the structure of silicate glasses. III. Raman intensities and structural units in sodium silicate glasses. Journal of Chemical Physics 75, 3226-3237.
Show in context In particular, signals at ~950, ~1040, ~1090, and ~1150 cm-1 are assigned to the symmetric stretching of Si-O bonds in Q2 units, the asymmetric stretching of Si-O bonds in any Qn units, and the symmetric stretching of Si-O bonds in Q3 units and in Q4 units, respectively (Brawer and White, 1975, 1977; Virgo et al., 1980; Furukawa et al., 1981; Mysen et al., 1982; McMillan, 1984; see also peak fitting results in Mysen, 1990; Le Losq et al., 2015a).
View in Supplementary Information
Le Losq, C., Neuville, D.R., Moretti, R., Roux, J. (2012) Determination of Water Content in Silicate Glasses using Raman Spectrometry, Implications for the study of explosive volcanism. American Mineralogist 97, 779-790.
Show in context Such a process allows quantitative comparison of spectra (e.g., Le Losq et al., 2012; Neuville et al., 2014).
View in Supplementary Information
Water concentrations of the 1H2O- and 2H2O-bearing glasses were checked with Raman spectroscopy, using the calibration that links the glass water content measured by Infrared (or another technique) to the ratio between the areas of the Raman bands assigned to silicate vibrations and to the O-1H or O-2H stretching vibration as described by Le Losq et al. (2012).
View in Supplementary Information
Le Losq, C., Mysen, B.O., Cody, G.D. (2015a) Water and magmas: insights about the water solution mechanisms in alkali silicate melts from infrared, Raman, and 29Si solid-state NMR spectroscopies. Progress in Earth and Planetary Sciences 2, 22, doi: 10.1186/s40645-015-0052-7.
Show in context Anhydrous Li2Si4O9 (LS4), Na2Si4O9 (NS4) and K2Si4O9 (KS4) glass starting materials used here are the same as those described in Le Losq et al. (2015a,b,c).
View in Supplementary Information
Hydrous glasses, containing pure 1H2O, pure 2H2O or a 50:50 mixture of 1H2O-2H2O, were formed by temperature-quenching melts hydrated at high pressure and temperature in platinum capsules by using a piston-cylinder apparatus, following the protocol described in Le Losq et al. (2015a,b,c; see Table S-1 for water content measurements and experimental conditions).
View in Supplementary Information
Table S-1 [...] Endmembers and Mixed respectively refer to the products containing only 1H2O or 2H2O, and to those prepared with the 50:50 mixture of 2H2O + 1H2O. 1H2O concentrations of endmembers are from Le Losq et al. (2015a,b).
View in Supplementary Information
Raman spectra were recorded with a Jasco® NRS 3100 spectrometer as described in Le Le Losq et al. (2015a,b).
View in Supplementary Information
In alkali tetrasilicate melts at their glass transition temperature, water is dissolved as H2Omol molecules and as OH groups bonded to Si or the alkalis (Cody et al., 2005; Mysen and Cody, 2005; Xue and Kanzaki, 2009; Le Losq et al., 2015a).
View in Supplementary Information
In particular, signals at ~950, ~1040, ~1090, and ~1150 cm-1 are assigned to the symmetric stretching of Si-O bonds in Q2 units, the asymmetric stretching of Si-O bonds in any Qn units, and the symmetric stretching of Si-O bonds in Q3 units and in Q4 units, respectively (Brawer and White, 1975, 1977; Virgo et al., 1980; Furukawa et al., 1981; Mysen et al., 1982; McMillan, 1984; see also peak fitting results in Mysen, 1990; Le Losq et al., 2015a).
View in Supplementary Information
Increasing the alkali ionic radius promotes the latter effect (Le Losq et al., 2015a).
View in Supplementary Information
Le Losq, C., Cody, G.D., Mysen, B.O. (2015b) Alkali influence on the water speciation and the environment of protons in silicate glasses revealed by 1H MAS NMR spectroscopy. American Mineralogist 100, 466-473.
Show in context Anhydrous Li2Si4O9 (LS4), Na2Si4O9 (NS4) and K2Si4O9 (KS4) glass starting materials used here are the same as those described in Le Losq et al. (2015a,b,c).
View in Supplementary Information
Hydrous glasses, containing pure 1H2O, pure 2H2O or a 50:50 mixture of 1H2O-2H2O, were formed by temperature-quenching melts hydrated at high pressure and temperature in platinum capsules by using a piston-cylinder apparatus, following the protocol described in Le Losq et al. (2015a,b,c; see Table S-1 for water content measurements and experimental conditions).
View in Supplementary Information
Table S-1 [...] Endmembers and Mixed respectively refer to the products containing only 1H2O or 2H2O, and to those prepared with the 50:50 mixture of 2H2O + 1H2O. 1H2O concentrations of endmembers are from Le Losq et al. (2015a,b).
View in Supplementary Information
Table S-1 [...] The Raman-based technique of Le Losq et al. (2015b) was used to determine the concentration of 1H2O, 2H2O or of 1H2O+2H2O in the glasses.
View in Supplementary Information
Raman spectra were recorded with a Jasco® NRS 3100 spectrometer as described in Le Le Losq et al. (2015a,b).
View in Supplementary Information
It is described in detail in Le Losq et al. (2015b), such that we refer the reader to this publication.
View in Supplementary Information
See Cody et al. (2005) and Le Losq et al. (2015b) for further analytical details.
View in Supplementary Information
We used the calibration curve determined by Le Losq et al. (2015b) for simple alkali silicate glasses.
View in Supplementary Information
These features correspond to protons and deuterons existing in, at least, 5 different environments in the silicate glasses (Le Losq et al., 2015b and references therein).
View in Supplementary Information
Therefore, at constant water content, changes in the 1H and 2H isotropic NMR spectra reflect how both 1H and 2H populate environments with smaller O-O distances, and hence, smaller structural volumes with increasing ionic radius of the alkali metal (Figs. 1, S-1, S-2; Le Losq et al., 2015b).
View in Supplementary Information
Le Losq, C., Cody, G.D., Mysen, B.O. (2015c) Complex stretching signal of OH groups in silicate glasses: implication for the use of the 4500 cm-1 IR peak as a marker of OH- groups concentration. American Mineralogist 100, 945-950.
Show in context Anhydrous Li2Si4O9 (LS4), Na2Si4O9 (NS4) and K2Si4O9 (KS4) glass starting materials used here are the same as those described in Le Losq et al. (2015a,b,c).
View in Supplementary Information
Hydrous glasses, containing pure 1H2O, pure 2H2O or a 50:50 mixture of 1H2O-2H2O, were formed by temperature-quenching melts hydrated at high pressure and temperature in platinum capsules by using a piston-cylinder apparatus, following the protocol described in Le Losq et al. (2015a,b,c; see Table S-1 for water content measurements and experimental conditions).
View in Supplementary Information
Malfait, W.J. (2009) The 4500 cm-1 infrared absorption band in hydrous aluminosilicate glasses is a combination band of the fundamental {Si,Al}-OH and O-H vibrations. American Mineralogist 94, 849-852.
Show in context This peak is typically assigned to vibrations of OH groups bonded to the silicate network (McMillan et al., 1993; Zotov and Keppler, 1998; Malfait, 2009, Spiekerman et al., 2012).
View in Supplementary Information
McMillan, P.F. (1984) Structural studies of silicate glasses and melts - Applications and limitations of Raman spectroscopy. American Mineralogist 69, 622-644.
Show in context In particular, signals at ~950, ~1040, ~1090, and ~1150 cm-1 are assigned to the symmetric stretching of Si-O bonds in Q2 units, the asymmetric stretching of Si-O bonds in any Qn units, and the symmetric stretching of Si-O bonds in Q3 units and in Q4 units, respectively (Brawer and White, 1975, 1977; Virgo et al., 1980; Furukawa et al., 1981; Mysen et al., 1982; McMillan, 1984; see also peak fitting results in Mysen, 1990; Le Losq et al., 2015a).
View in Supplementary Information
McMillan, P.F., Poe, B.T., Stanton, T.R., Remmele, R.L. (1993) A Raman spectroscopic study of H/D isotopically substituted hydrous aluminosilicate glasses. Physic and Chemistry of Minerals 19, 454-459.
Show in context This peak is typically assigned to vibrations of OH groups bonded to the silicate network (McMillan et al., 1993; Zotov and Keppler, 1998; Malfait, 2009, Spiekerman et al., 2012).
View in Supplementary Information
Métrich, N., Bertagnini, A., Garaebiti, E., Vergniolle, S., Bani, P., Beaumais, A., Neuville, D.R. (2015) Magma transfer and degassing budget: Application to the 2009–2010 eruptive crisis of Mt Garet (Vanuatu arc). Journal of Volcanology and Geothermal Research, doi:10.1016/j.jvolgeores.2015.06.003.
Show in context The method has been shown to determine accurately the water content of natural glasses (Shea et al., 2014; Métrich et al., 2015).
View in Supplementary Information
Mysen, B.O. (1990) Role of Al in depolymerized, peralkaline aluminosilicate melts in the systems Li2O-Al2O3-SiO2, Na2O-Al2O3-SiO2, and K2O-Al2O3-SiO2. American Mineralogist 75, 120-134.
Show in context In particular, signals at ~950, ~1040, ~1090, and ~1150 cm-1 are assigned to the symmetric stretching of Si-O bonds in Q2 units, the asymmetric stretching of Si-O bonds in any Qn units, and the symmetric stretching of Si-O bonds in Q3 units and in Q4 units, respectively (Brawer and White, 1975, 1977; Virgo et al., 1980; Furukawa et al., 1981; Mysen et al., 1982; McMillan, 1984; see also peak fitting results in Mysen, 1990; Le Losq et al., 2015a).
View in Supplementary Information
This agrees with previous Raman and 29Si NMR results (Mysen, 1990; Maekawa et al., 1991; Zotov and Keppler, 1998; Mysen and Cody, 2005).
View in Supplementary Information
Mysen, B.O., Cody, G. (2005) Solution mechanisms of H2O in depolymerized peralkaline melts. Geochimica et Cosmochimica Acta 69, 5557-5566.
Show in context In alkali tetrasilicate melts at their glass transition temperature, water is dissolved as H2Omol molecules and as OH groups bonded to Si or the alkalis (Cody et al., 2005; Mysen and Cody, 2005; Xue and Kanzaki, 2009; Le Losq et al., 2015a).
View in Supplementary Information
View in Supplementary Information
This agrees with previous Raman and 29Si NMR results (Mysen, 1990; Maekawa et al., 1991; Zotov and Keppler, 1998; Mysen and Cody, 2005).
View in Supplementary Information
With increasing water content in the glasses, the signals between 900-1100 cm-1 become more intense, reflecting the depolymerisation of the tetrahedral network that occurs with solution of water (Zotov and Keppler, 1998; Cody et al., 2005; Mysen and Cody, 2005).
View in Supplementary Information
Mysen, B.O., Fogel, M.L. (2010) Nitrogen and hydrogen isotope compositions and solubility in silicate melts in equilibrium with reduced (N+ H)-bearing fluids at high pressure and temperature: effects of melt structure. American Mineralogist 95, 987-999.
Show in context The 2H/1H ratios were determined with the ratio of integrated areas of the Raman bands assigned to O-2H and O-1D stretch vibrations (Mysen, 2010; Foustoukos and Mysen, 2012; Dalou et al., 2015).
View in article
Mysen, B.O., Finger, L.W., Virgo, D., Seifert, F.A. (1982) Curve-fitting of Raman spectra of silicate glasses. American Mineralogist 67, 686-695.
Show in context In particular, signals at ~950, ~1040, ~1090, and ~1150 cm-1 are assigned to the symmetric stretching of Si-O bonds in Q2 units, the asymmetric stretching of Si-O bonds in any Qn units, and the symmetric stretching of Si-O bonds in Q3 units and in Q4 units, respectively (Brawer and White, 1975, 1977; Virgo et al., 1980; Furukawa et al., 1981; Mysen et al., 1982; McMillan, 1984; see also peak fitting results in Mysen, 1990; Le Losq et al., 2015a).
View in Supplementary Information
Neuville, D.R., de Ligny, D., Henderson, G.S. (2014) Advances in Raman spectroscopy applied to earth and material sciences. Reviews in Mineralogy and Geochemistry 78, 509-541.
Show in context They are not corrected from excitation line and temperature effects, as we are interested in observing changes at Raman shifts above ~400 cm-1, where such correction is unnecessary (Neuville et al., 2014).
View in Supplementary Information
Such a process allows quantitative comparison of spectra (e.g., Le Losq et al., 2012; Neuville et al., 2014).
View in Supplementary Information
Shea, T., Hellebrand, E., Gurioli, L., Tuffen, H. (2014) Conduit-to localized-scale degassing during Plinian Eruptions: Insights from major element and volatile (Cl and H2O) analyses within Vesuvius AD 79 pumice. Journal of Petrology 55, 315-344.
Show in context The method has been shown to determine accurately the water content of natural glasses (Shea et al., 2014; Métrich et al., 2015).
View in Supplementary Information
Spiekerman, G., Steel-McInnis, M., Schmidt, C., Jahn, S. (2012) Vibrational mode frequencies of silica species in SiO2-H2O liquids and glasses from ab initio molecular dynamics. The Journal of Chemical Physics 136, 154501.
Show in context This peak is typically assigned to vibrations of OH groups bonded to the silicate network (McMillan et al., 1993; Zotov and Keppler, 1998; Malfait, 2009, Spiekerman et al., 2012).
View in Supplementary Information
Virgo, D., Mysen, B.O., Kushiro, I. (1980) Anionic constitution of silicate melts quenched at 1 atm from Raman spectroscopy: Implications for the structure of igneous melts. Science 208, 1371-1373.
Show in context In particular, signals at ~950, ~1040, ~1090, and ~1150 cm-1 are assigned to the symmetric stretching of Si-O bonds in Q2 units, the asymmetric stretching of Si-O bonds in any Qn units, and the symmetric stretching of Si-O bonds in Q3 units and in Q4 units, respectively (Brawer and White, 1975, 1977; Virgo et al., 1980; Furukawa et al., 1981; Mysen et al., 1982; McMillan, 1984; see also peak fitting results in Mysen, 1990; Le Losq et al., 2015a).
View in Supplementary Information
Xue, X., Kanzaki, M. (2009) Proton distributions and hydrogen bonding in crystalline and glassy hydrous silicates and related inorganic materials: insights from high-resolution solid-state Nuclear Magnetic Resonance spectroscopy. Journal of the American Ceramic Society 92, 2803-2830.
Show in context Figure S-1 [...] The O-O distances of O-H…O bonds (with – an ionic-covalent bond and … a hydrogen bond) determined from the 1H chemical shift (equation from Xue and Kanzaki, 2009) are shown on the upper horizontal axis.
View in Supplementary Information
Figure S-2 [...] The O-O distances of O-H…O bonds determined from the 1H chemical shift (equation from Xue and Kanzaki, 2009) are shown on the upper horizontal axis.
View in Supplementary Information
These reflect 1H nuclei in O-H…O environments with mean O-O distances of ~245, ~295 and 305 pm, respectively (Xue and Kanzaki, 2009 and references therein).
View in Supplementary Information
In alkali tetrasilicate melts at their glass transition temperature, water is dissolved as H2Omol molecules and as OH groups bonded to Si or the alkalis (Cody et al., 2005; Mysen and Cody, 2005; Xue and Kanzaki, 2009; Le Losq et al., 2015a).
View in Supplementary Information
View in article
Zotov, N., Keppler, H. (1998) The influence of water on the structure of hydrous sodium tetrasilicate glasses. American Mineralogist 83, 823-834.
Show in context This peak is typically assigned to vibrations of OH groups bonded to the silicate network (McMillan et al., 1993; Zotov and Keppler, 1998; Malfait, 2009, Spiekerman et al., 2012).
View in Supplementary Information
This agrees with previous Raman and 29Si NMR results (Mysen, 1990; Maekawa et al., 1991; Zotov and Keppler, 1998; Mysen and Cody, 2005).
View in Supplementary Information
With increasing water content in the glasses, the signals between 900-1100 cm-1 become more intense, reflecting the depolymerisation of the tetrahedral network that occurs with solution of water (Zotov and Keppler, 1998; Cody et al., 2005; Mysen and Cody, 2005).
View in Supplementary Information