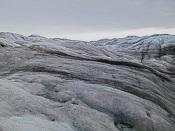
Experimental evidence that microbial activity lowers the albedo of glaciers
Affiliations | Corresponding Author | Cite asMusilova, M., Tranter, M., Bamber, J.L., Takeuchi, N., Anesio, A.M. (2016) Experimental evidence that microbial activity lowers the albedo of glaciers. Geochem. Persp. Let. 2, 106-116.


- Share this article


-
Article views:15,714Cumulative count of HTML views and PDF downloads.
- Download Citation
- Rights & Permissions

Abstract
Figures and Tables
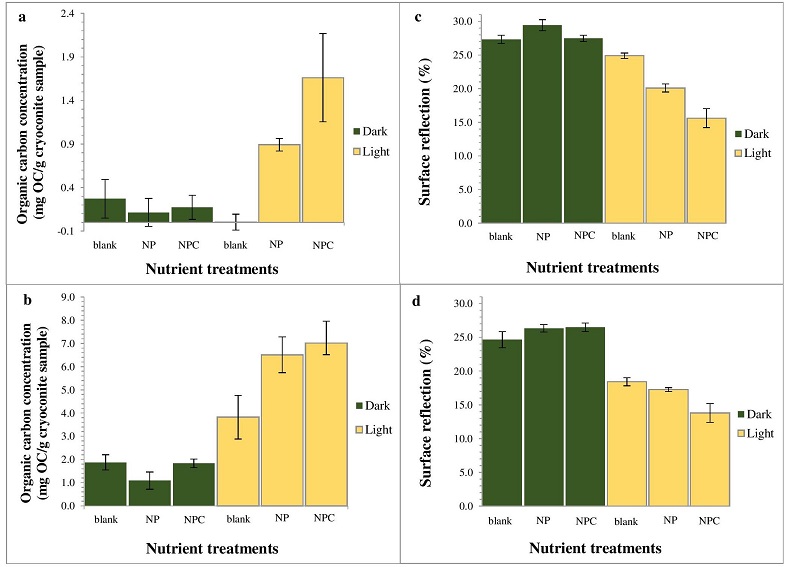
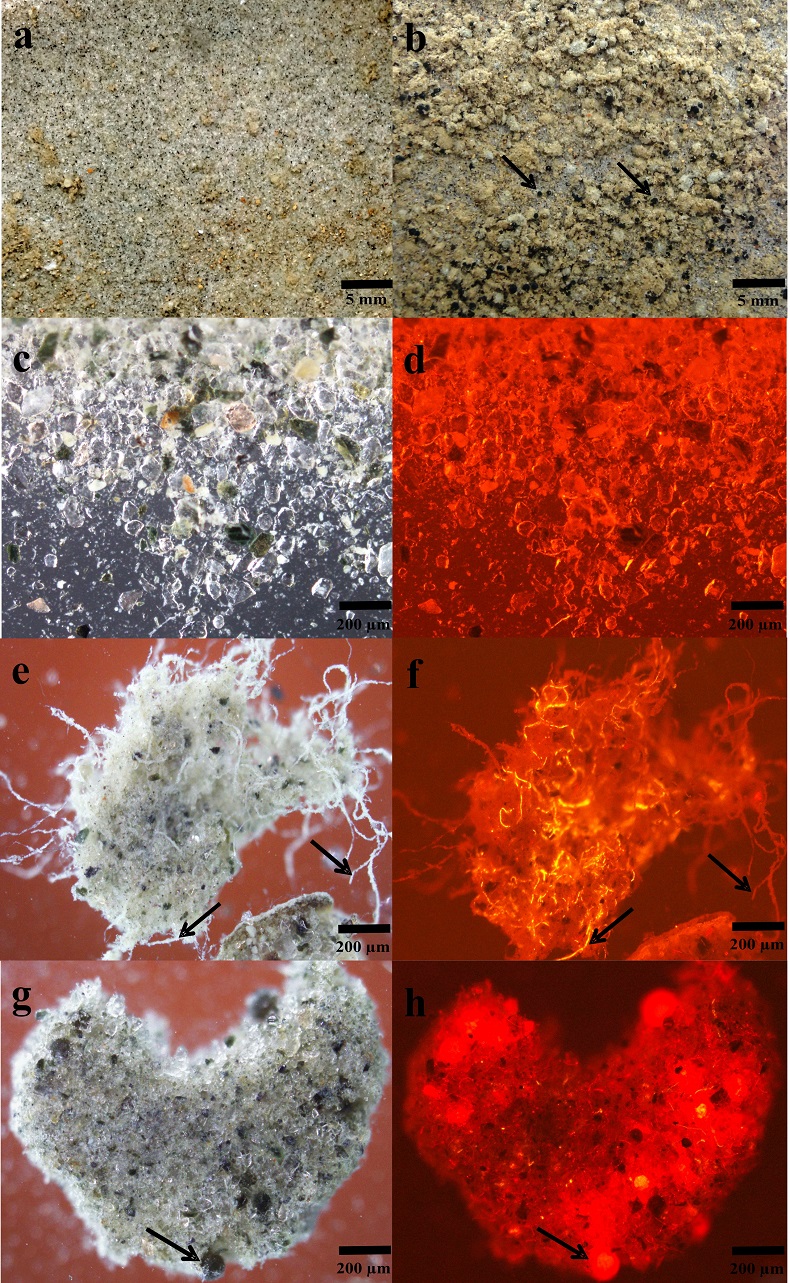
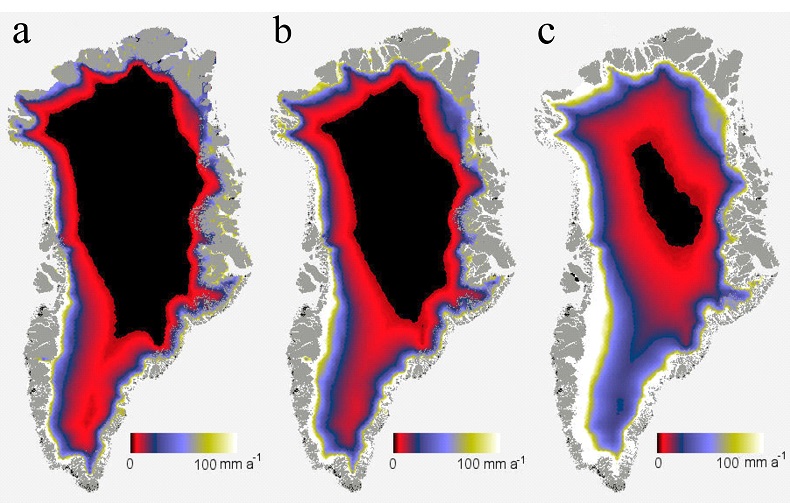
 Figure 1 OC accumulated over (a) one simulated summer season and (b) over three simulated summer seasons. Surface reflection after (c) one simulated summer season and (d) three simulated summer seasons. ‘Light’ samples accumulated significantly more OC compared to ‘dark’ samples (two-way ANOVA p < 0.05 in (a) and p < 0.001 in (b). This was accompanied by a decrease in cryoconite sediment reflectivity by ~15.5 percentage points, from a starting 31.1 %, for the ‘light’ with NPC treatment samples in (c) and a further 1.8 percentage points in (d). Two-way ANOVA analyses showed a significant difference in spectral reflection between ‘light’ and ‘dark’ samples (p < 0.001), nutrient conditions (p < 0.001) and the interaction of nutrient and light settings (p < 0.01). There was a significant difference (p < 0.001) between samples NPC and blanks, NCP and NP (p < 0.05) and NP and blanks (p < 0.05), using Turkey Post-hoc analyses in (c-d). Standard errors were calculated as 1σ (n = 5). |  Table 1 Concentrations of PON, OP, IP and chla for each light and nutrient treatment, over one and three simulated summer seasons. The concentrations are the differences between the final and starting concentrations in each treatment. Significant differences (two-way ANOVA) are indicated between (a) ‘light’ and ‘dark’ samples, (b) nutrient treatments and (c) the interaction of nutrient and light settings. |  Figure 2 Microbial granule development in ‘light’ samples with nutrient additions. Images (a-c), (e) and (g) were taken using optical microscopy. Autofluorescence microscopy was performed to visualise photosynthetic autotrophs in images (d), (f) and (h). The initial mixture of inorganic dust with 10 % natural cryoconite (a and c) developed into samples rich in granules and filamentous cyanobacteria (b, e-h). Examples of cyanobacterial filaments and colonies (resembling black spheres) are indicated by arrows in images (b), (e-h). |  Figure 3 (a) Present biologically-induced GrIS potential increase in melt rate, in mm yr-1. (b) and (c) Future biologically-induced GrIS potential increase in melt rate, in mm yr-1. Melt days were derived for the period 2091-2100 for two different greenhouse gas trajectories, RCP4.5 (b) and RCP8.5 (c). |
| Figure 1 | Table 1 | Figure 2 | Figure 3 |
top
Introduction
Glacier surfaces melt primarily by the absorption of solar radiation, which depends on the surface albedo (Boggild et al., 2010
Boggild, C.E., Brandt, R.E., Brown, K.J., Warren, S.G. (2010) The ablation zone in northeast Greenland: ice types, albedos and impurities. Journal of Glaciology 56, 101-113.
; Box et al., 2012Box, J.E., Fettweis, X., Stroeve, J.C., Tedesco, M., Hall, D.K., Steffen, K. (2012) Greenland ice sheet albedo feedback: thermodynamics and atmospheric drivers. Cryosphere 6, 821-839.
). Albedo is affected by the physical properties of snow and ice, such as the geometric pattern of the snow surface (Pirazzini, 2004Pirazzini, R. (2004) Surface albedo measurements over Antarctic sites in summer. Journal of Geophysical Research-Atmospheres 109, doi: 10.1029/2004JD004617.
), snow metamorphism (Nakamura et al., 2001Nakamura, T., Abe, O., Hasegawa, T., Tamura, R., Ohta, T. (2001) Spectral reflectance of snow with a known grain-size distribution in successive metamorphism. Cold Regions Science and Technology 32, 13-26.
), water content (Ryser et al., 2013Ryser, C., Luthi, M., Blindow, N., Suckro, S., Funk, M., Bauder, A. (2013) Cold ice in the ablation zone: Its relation to glacier hydrology and ice water content. Journal of Geophysical Research-Earth Surface 118, 693-705.
) and particulate impurities on the glacier surface (Paterson, 1994Paterson, W.S.B. (1994) The physics of glaciers. Elsevier, Oxford, 480 pp.
). Most studies assume that the accumulation of inorganic and organic particulates, such as anthropogenic and naturally occurring black carbon (Doherty et al., 2013Doherty, S.J., Grenfell, T.C., Forsstrom, S., Hegg, D.L., Brandt, R.E., Warren, S.G. (2013) Observed vertical redistribution of black carbon and other insoluble light-absorbing particles in melting snow. Journal of Geophysical Research-Atmospheres 118, 5553-5569.
), volcanic ash and dust (Dumont et al., 2014Dumont, M., Brun, E., Picard, G., Michou, M., Libois, Q., Petit, J.R., Geyer, M., Morin, S., Josse, B. (2014) Contribution of light-absorbing impurities in snow to Greenland/'s darkening since 2009. Nature Geoscience 7, 509-512.
), are key drivers of the darkening and reduction of the ice albedo.Recent research shows that there is high microbial activity on glacial surfaces (Anesio et al., 2009
Anesio, A.M., Hodson, A.J., Fritz, A., Psenner, R., Sattler, B. (2009) High microbial activity on glaciers: importance to the global carbon cycle. Global Change Biology 15, 955-960.
), some associated with pigmented algae, which absorb significantly more light than local inorganic dust particles on the Greenland Ice Sheet (GrIS) (Lutz et al., 2014Lutz, S., Anesio, A.M., Villar, S.E.J., Benning, L.G. (2014) Variations of algal communities cause darkening of a Greenland glacier. Fems Microbiology Ecology 89, 402-414.
). Furthermore, microbially-rich glacier surface debris (cryoconite) reduces the glacier surface (supraglacial) albedo (Takeuchi et al., 2001Takeuchi, N., Kohshima, S., Seko, K. (2001) Structure, formation, and darkening process of albedo-reducing material (cryoconite) on a Himalayan glacier: A granular algal mat growing on the glacier. Arctic Antarctic and Alpine Research 33, 115-122.
). Cryoconite accumulates in water-filled holes on glacier surfaces, causing enhanced melting around the deposited sediment (Fountain et al., 2004Fountain, A.G., Tranter, M., Nylen, T.H., Lewis, K.J., Mueller, D.R. (2004) Evolution of cryoconite holes and their contribution to meltwater runoff from glaciers in the McMurdo Dry Valleys, Antarctica. Journal of Glaciology 50, 35-45.
). These so-called cryoconite holes contain a substantial amount of organic matter (5–10 %; Takeuchi et al., 2001Takeuchi, N., Kohshima, S., Seko, K. (2001) Structure, formation, and darkening process of albedo-reducing material (cryoconite) on a Himalayan glacier: A granular algal mat growing on the glacier. Arctic Antarctic and Alpine Research 33, 115-122.
), with values often >6 % organic carbon (OC) on GrIS (Stibal et al., 2010Stibal, M., Lawson, E.C., Lis, G.P., Mak, K.M., Wadham, J.L., Anesio, A.M. (2010) Organic matter content and quality in supraglacial debris across the ablation zone of the Greenland ice sheet. Annals of Glaciology 51, 1-8.
). Microbial activity is believed to cause a further darkening of the already dark inorganic particulates in cryoconite debris by producing and/or transforming OC (Anesio et al., 2009Anesio, A.M., Hodson, A.J., Fritz, A., Psenner, R., Sattler, B. (2009) High microbial activity on glaciers: importance to the global carbon cycle. Global Change Biology 15, 955-960.
; Hodson et al., 2010aHodson, A., Boggild, C., Hanna, E., Huybrechts, P., Langford, H., Cameron, K., Houldsworth, A. (2010a) The cryoconite ecosystem on the Greenland ice sheet. Annals of Glaciology 51, 123-129.
). Microbes are thought to decompose more labile OC to form dark-coloured humic substances (Takeuchi et al., 2001Takeuchi, N., Kohshima, S., Seko, K. (2001) Structure, formation, and darkening process of albedo-reducing material (cryoconite) on a Himalayan glacier: A granular algal mat growing on the glacier. Arctic Antarctic and Alpine Research 33, 115-122.
) and to produce extracellular polymeric substances (EPS) (Hodson et al., 2010bHodson, A., Cameron, K., Boggild, C., Irvine-Fynn, T., Langford, H., Pearce, D., Banwart, S. (2010b) The structure, biological activity and biogeochemistry of cryoconite aggregates upon an Arctic valley glacier: Longyearbreen, Svalbard. Journal of Glaciology 56, 349-362.
). These glue-like compounds help cement organic and inorganic particles (including black carbon; Stibal et al., 2012aStibal, M., Sabacka, M., Zarsky, J. (2012a) Biological processes on glacier and ice sheet surfaces. Nature Geoscience 5, 771-774.
) into granules, thereby increasing their residence time on glacier surfaces (Hodson et al., 2010bHodson, A., Cameron, K., Boggild, C., Irvine-Fynn, T., Langford, H., Pearce, D., Banwart, S. (2010b) The structure, biological activity and biogeochemistry of cryoconite aggregates upon an Arctic valley glacier: Longyearbreen, Svalbard. Journal of Glaciology 56, 349-362.
; Langford et al., 2010Langford, H., Hodson, A., Banwart, S., Boggild, C. (2010) The microstructure and biogeochemistry of Arctic cryoconite granules. Annals of Glaciology 51, 87-94.
). This can lead to a significant decrease in supraglacial albedo, considering cryoconite debris covers 0.1–10 % of the ablation zone of glaciers in the Northern Hemisphere (Hodson et al., 2007Hodson, A., Anesio, A.M., Ng, F., Watson, R., Quirk, J., Irvine-Fynn, T., Dye, A., Clark, C., McCloy, P., Kohler, J., Sattler, B. (2007) A glacier respires: Quantifying the distribution and respiration CO2 flux of cryoconite across an entire Arctic supraglacial ecosystem. Journal of Geophysical Research-Biogeosciences 112, doi: 10.1029/2007JG000452.
; Anesio et al., 2009Anesio, A.M., Hodson, A.J., Fritz, A., Psenner, R., Sattler, B. (2009) High microbial activity on glaciers: importance to the global carbon cycle. Global Change Biology 15, 955-960.
; Hodson et al., 2010aHodson, A., Boggild, C., Hanna, E., Huybrechts, P., Langford, H., Cameron, K., Houldsworth, A. (2010a) The cryoconite ecosystem on the Greenland ice sheet. Annals of Glaciology 51, 123-129.
).We conducted an original laboratory experiment, the ‘cryoconite casserole’, to investigate the darkening of cryoconite debris as a result of OC accumulation driven by microbial activity. Greenlandic cryoconite debris (10 % natural cryoconite, mixed with 90 % cryoconite furnaced at 550 °C to remove all organic matter) was exposed to simulated Greenlandic summer conditions, in terms of temperature, lighting and nutrient availability (see Methodology in the Supplementary Information for full details). This cryoconite mixture simulated the early stages of cryoconite hole development, where the debris is mostly inorganic and it can become colonised by local microbial communities. Samples were kept either under ‘light’ (simulated daylight) or ‘dark’ (covered in aluminium foil) conditions. Three different water/nutrient applications were made: 1) blank, sterile water, 2) nitrogen (N) and phosphorous (P) additions and 3) N, P and organic carbon (C) additions. The nutrient additions simulated concentrations released from ice melt (Stibal et al., 2012b
Stibal, M., Telling, J., Cook, J., Mak, K.M., Hodson, A., Anesio, A.M. (2012b) Environmental Controls on Microbial Abundance and Activity on the Greenland Ice Sheet: A Multivariate Analysis Approach. Microbial Ecology 63, 74-84.
; Telling et al., 2012Telling, J., Stibal, M., Anesio, A.M., Tranter, M., Nias, I., Cook, J., Bellas, C., Lis, G., Wadham, J.L., Sole, A., Nienow, P., Hodson, A. (2012) Microbial nitrogen cycling on the Greenland Ice Sheet. Biogeosciences 9, 2431-2442.
; Lawson et al., 2014Lawson, E.C., Wadham, J.L., Tranter, M., Stibal, M., Lis, G.P., Butler, C.E.H., Laybourn-Parry, J., Nienow, P., Chandler, D., Dewsbury, P. (2014) Greenland Ice Sheet exports labile organic carbon to the Arctic oceans. Biogeosciences 11, 4015-4028.
). All light and nutrient treatments had five replicates. Cryoconite casserole samples were analysed for their nutrient composition, surface reflection normal to the ice surface in the laboratory and chlorophyll a (chla) concentration. The structure of the debris was observed with an optical and fluorescent microscope. Here, we present data collected at the end of one and three consecutive simulated summer seasons (the latter was performed to confirm the results observed during the one simulated summer experiment). The reduction of surface reflection due to biological activity, derived from our results, was used as a proxy for a reduction in albedo in the regional climate model Modèle Atmosphérique Régional (MAR; Fettweis et al., 2013Fettweis, X., Franco, B., Tedesco, M., van Angelen, J.H., Lenaerts, J.T.M., van den Broeke, M.R., Gallee, H. (2013) Estimating the Greenland ice sheet surface mass balance contribution to future sea level rise using the regional atmospheric climate model MAR. Cryosphere 7, 469-489.
) to project future microbially-mediated increases in GrIS melt (see Methodology, Supplementary Information).top
Results and Discussion
Supraglacial Microbial Nutrient Production and Recycling. Substantial amounts of OC (~1.7 ± 0.5 mg OC/g of cryoconite) were produced and accumulated by microbes over the course of one simulated summer in ‘light’ conditions with NPC additions (Fig. 1a), compared to ‘dark’ and blank samples. OC concentrations quadrupled (~7.0 ± 0.9 mg OC/g of cryoconite) when the samples were exposed to three consecutive simulated summers (Fig. 1b). The total C addition was only 0.25 % of the final accumulated OC. Thus nearly all accumulated OC in this treatment originated from microbial C fixation/transformation.
Figure 1 OC accumulated over (a) one simulated summer season and (b) over three simulated summer seasons. Surface reflection after (c) one simulated summer season and (d) three simulated summer seasons. ‘Light’ samples accumulated significantly more OC compared to ‘dark’ samples (two-way ANOVA p < 0.05 in (a) and p < 0.001 in (b). This was accompanied by a decrease in cryoconite sediment reflectivity by ~15.5 percentage points, from a starting 31.1 %, for the ‘light’ with NPC treatment samples in (c) and a further 1.8 percentage points in (d). Two-way ANOVA analyses showed a significant difference in spectral reflection between ‘light’ and ‘dark’ samples (p < 0.001), nutrient conditions (p < 0.001) and the interaction of nutrient and light settings (p < 0.01). There was a significant difference (p < 0.001) between samples NPC and blanks, NCP and NP (p < 0.05) and NP and blanks (p < 0.05), using Turkey Post-hoc analyses in (c-d). Standard errors were calculated as 1σ (n = 5).
‘Light’ treatments with NPC additions also generated the highest concentrations of particulate organic nitrogen (PON; 100.4 ± 26.7 µg PON/g cryoconite) and organic bound phosphorous (OP; 19.5 ± 6.4 µg OP/g cryoconite) (Table 1). By contrast, PON and OP were consumed in the dark NP treatments (6.6 ± 4.4 µg PON/g cryoconite and 22.0 ± 1.7 µg OP/g cryoconite, respectively, after one season). Additionally, the light samples with NPC additions had the biggest decrease in inorganic bound phosphorous (IP; 27.2 ± 5.4 µg IP/g cryoconite consumed), with respect to the starting IP concentrations. This is indicative of an uptake of P from the sediment, as a consequence of microbial fixation of OC. The concentrations of PON and OP increased 7-fold and 4-fold, respectively, for the same samples (‘light’ with NPC additions) after three simulated summers (Table 1).
Table 1 Concentrations of PON, OP, IP and chla for each light and nutrient treatment, over one and three simulated summer seasons. The concentrations are the differences between the final and starting concentrations in each treatment. Significant differences (two-way ANOVA) are indicated between (a) ‘light’ and ‘dark’ samples, (b) nutrient treatments and (c) the interaction of nutrient and light settings.
| Sample conditions | Light | Dark | Two-way ANOVA analysis: | |||||
| Sterile water | N and P additions | N, P and C additions | Sterile water | N and P additions | N, P and C additions | |||
| One simulated summer season | PON concentration (µg PON/g cryoconite sample) | 11.7 | 32.6 | 100.4 | -3.1 | -6.6 | -2.4 | a (p < 0.01) |
| ±3.8 | ±21.4 | ±26.7 | ±6.0 | ±4.4 | ±10.2 | |||
| OP concentration (µg OC/g cryoconite sample) | -2.1 | 13.4 | 19.5 | -21.9 | -22 | -10 | a (p < 0.001) | |
| ±9.6 | ±6.0 | ±6.4 | ±1.8 | ±1.7 | ±7.1 | b (p < 0.05) | ||
| IP concentration (µg OC/g cryoconite sample) | -3.9 | -22 | -27.2 | 16.9 | 23.6 | 12.5 | a (p < 0.001) | |
| ±5.5 | ±9.8 | ±5.4 | ±8.5 | ±10.4 | ±2.4 | |||
| Chla concentration (in µg of chla/g of sample) | 1.6 | 3.1 | 3.8 | 1 | 1.1 | 1.1 | a (p < 0.001) | |
| ±0.2 | ±0.1 | ±0.2 | ±0.1 | ±0.1 | ±0.0 | b (p < 0.01) | ||
| | | | | | | c (p < 0.01) | ||
| Three simulated summer seasons | PON concentration (µg PON/g cryoconite sample) | 149.6 | 253.4 | 680.5 | 51.2 | 67.3 | 61.4 | a (p < 0.001) |
| ±31.7 | ±42.9 | ±51.1 | ±19.2 | ±14.2 | ±18.1 | b (p < 0.001) | ||
| | | | | | | c (p < 0.001) | ||
| OP concentration (µg OC/g cryoconite sample) | 27.7 | 35.6 | 85.4 | 15.2 | 13.6 | 16.3 | a (p < 0.001) | |
| ±8.9 | ±9.1 | ±13.6 | ±0.9 | ±1.4 | ±4.5 | b (p < 0.001) | ||
| | | | | | | c (p < 0.01) | ||
| IP concentration (µg OC/g cryoconite sample) | -35.6 | -46.7 | -97.7 | -21.8 | -24.1 | -19.6 | a (p < 0.001) | |
| ±9.4 | ±13.5 | ±15.1 | ±6.3 | ±5.2 | ±7.3 | b (p < 0.01) | ||
| | | | | | | c (p < 0.01) | ||
| Chla concentration (in µg of chla/g of sample) | 1.5 ± 0.2 | 2.0 ± 0.0 | 4.0 ± 0.5 | 1.0 ± 0.1 | 1.1 ± 0.2 | 1.1 ± 0.0 | a (p < 0.001) | |
| b (p < 0.001) | ||||||||
| c (p < 0.001) | ||||||||
The amount of OC produced and accumulated in our experiments simulating glacial surfaces was disproportionate compared to the amounts of C, N and P added to the samples at ice meltwater concentrations. P concentrations were derived using the Redfield ratio C:N:P of 106:6:1 (Redfield, 1958
Redfield, A.C. (1958) The Biological Control of Chemical Factors in the Environment. American Scientist 46, 205-221.
), while keeping N and C concentrations within the range of concentrations detected in GrIS ice melt (Stibal et al., 2012bStibal, M., Telling, J., Cook, J., Mak, K.M., Hodson, A., Anesio, A.M. (2012b) Environmental Controls on Microbial Abundance and Activity on the Greenland Ice Sheet: A Multivariate Analysis Approach. Microbial Ecology 63, 74-84.
; Telling et al., 2012Telling, J., Stibal, M., Anesio, A.M., Tranter, M., Nias, I., Cook, J., Bellas, C., Lis, G., Wadham, J.L., Sole, A., Nienow, P., Hodson, A. (2012) Microbial nitrogen cycling on the Greenland Ice Sheet. Biogeosciences 9, 2431-2442.
; Lawson et al., 2014Lawson, E.C., Wadham, J.L., Tranter, M., Stibal, M., Lis, G.P., Butler, C.E.H., Laybourn-Parry, J., Nienow, P., Chandler, D., Dewsbury, P. (2014) Greenland Ice Sheet exports labile organic carbon to the Arctic oceans. Biogeosciences 11, 4015-4028.
). Therefore, the experimental set-up provided a realistic scenario for the potential accumulation of organic matter at the surface of glaciers. Nevertheless, the ratio of the organic C:N:P fixed in this experiment was 93:5:1, over one simulated summer, and 90:9:1, over three simulated summers. These ratios are comparable to others reported in cold, high latitude regions (Stibal et al., 2008Stibal, M., Tranter, M., Telling, J., Benning, L.G. (2008) Speciation, phase association and potential bioavailability of phosphorus on a Svalbard glacier. Biogeochemistry 90, 1-13.
; Martiny et al., 2013Martiny, A.C., Pham, C.T.A., Primeau, F.W., Vrugt, J.A., Moore, J.K., Levin, S.A., Lomas, M.W. (2013) Strong latitudinal patterns in the elemental ratios of marine plankton and organic matter. Nature Geoscience 6, 279-283.
). Cryoconite fertilisation with ambient nutrient conditions (NP and NPC additions) appears to produce a response of self-organisation: P mining out of sediment, autocatalytic N2 fixation and significant OC fixation. The N2 fixation was most probably performed by cyanobacteria species belonging to the Nostocaceae family, whose 16S rRNA and N fixation functional genes have been found within Arctic and Antarctic cryoconite (Cameron et al., 2012aCameron, K.A., Hodson, A.J., Osborn, A.M. (2012a) Carbon and nitrogen biogeochemical cycling potentials of supraglacial cryoconite communities. Polar Biology 35, 1375-1393.
,bCameron, K.A., Hodson, A.J., Osborn, A.M. (2012b) Structure and diversity of bacterial, eukaryotic and archaeal communities in glacial cryoconite holes from the Arctic and the Antarctic. Fems Microbiology Ecology 82, 254-267.
). Phosphorous limitation was previously reported in glacial environments (Mindl et al., 2007Mindl, B., Anesio, A.M., Meirer, K., Hodson, A.J., Laybourn-Parry, J., Sommaruga, R., Sattler, B. (2007) Factors influencing bacterial dynamics along a transect from supraglacial runoff to proglacial lakes of a high Arctic glacier. Fems Microbiology Ecology 59, 307-317.
; Stibal et al., 2009Stibal, M., Anesio, A.M., Blues, C.J.D., Tranter, M. (2009) Phosphatase activity and organic phosphorus turnover on a high Arctic glacier. Biogeosciences 6, 913-922.
), while N limitation was shown to stimulate N2 fixation on glaciers (Telling et al., 2011Telling, J., Anesio, A.M., Tranter, M., Irvine-Fynn, T., Hodson, A., Butler, C., Wadham, J. (2011) Nitrogen fixation on Arctic glaciers, Svalbard. Journal of Geophysical Research-Biogeosciences 116, doi: 10.1029/2010JG001632.
). Supraglacial microbial activity can thus be a vital source of bioavailable nutrients for subglacial and downstream environments.We hypothesise that adding C as bioavailable carbohydrate, at ambient concentrations, has a kinetic effect on the heterotrophic microbial community, speeding up the recycling of other organic matter. Dependence on labile OC additions demonstrates the importance of heterotrophic processes (recycling nutrients), acting in concert with autotrophic processes (fixing and accumulating OC), in the maintenance of self-organised supraglacial microbial communities. Blank and ‘dark’ samples receiving no nutrients initially showed no significant OC accumulation. However, even these samples showed substantial amounts of OC accumulation after three simulated summer seasons. The blank samples may have simply needed a longer period of time for autotrophic processes to dominate in the microbial community. We postulate that chemolithotrophic activity is the likely explanation for the small OC accumulation in the dark samples.
Impacts of Microbial Activity on Glacial Ice Reflectivity and Calculated Melt Rates. There was a strong negative correlation between OC accumulation and surface reflection (Pearson’s r = -0.897, p < 0.05). The accumulation of microbially-produced OC caused a significant reduction of ~15.5 percentage points in the cryoconite’s reflectivity in the ‘light’ with NPC treatment samples, from a starting 31.1 %, over the one simulated summer (Fig. 1c). It decreased by a further 1.8 percentage points after three simulated summers (Fig. 1d). This is most likely a result of the cryoconite material becoming darker through microbial OC production, accumulation and OC decomposition into dark-coloured humic substances. Microbial activity had the greatest effect in reducing the cryoconite material’s surface reflectivity over the first simulated summer. Afterwards, the surface reflectivity of the cryoconite-organic material mixture probably approached a plateau, since further microbial activity and OC accumulation led to only a slight additional reduction in its surface reflectivity after three simulated summers. Additionally, there was a strong correlation between the chla concentration and OC accumulation across all treatments (Table 1, Fig. 1) (Pearson’s r = 0.934, p < 0.01). Cyanobacterial sediment granules only developed in ‘light’ samples with nutrient additions, after one simulated summer (Fig. 2), which also experienced a substantial decrease in reflectivity. Conversely, blank samples only contained sediment granules after three simulated summers. Furthermore, dark and round microbial cell clusters were predominant in the samples with cyanobacterial granule development. These were most likely colonies of cyanobacteria, such as Oscillatoriales and Nostocales, previously observed in Greenlandic cryoconite (Cameron et al., 2012b
Cameron, K.A., Hodson, A.J., Osborn, A.M. (2012b) Structure and diversity of bacterial, eukaryotic and archaeal communities in glacial cryoconite holes from the Arctic and the Antarctic. Fems Microbiology Ecology 82, 254-267.
; Stibal et al., 2012bStibal, M., Telling, J., Cook, J., Mak, K.M., Hodson, A., Anesio, A.M. (2012b) Environmental Controls on Microbial Abundance and Activity on the Greenland Ice Sheet: A Multivariate Analysis Approach. Microbial Ecology 63, 74-84.
). They may have further contributed to the darkening of the samples’ reflectivity. Similar cyanobacterial granules can be found in supraglacial cryoconite holes around the world under in situ conditions (Hodson et al., 2010bHodson, A., Cameron, K., Boggild, C., Irvine-Fynn, T., Langford, H., Pearce, D., Banwart, S. (2010b) The structure, biological activity and biogeochemistry of cryoconite aggregates upon an Arctic valley glacier: Longyearbreen, Svalbard. Journal of Glaciology 56, 349-362.
; Langford et al., 2010Langford, H., Hodson, A., Banwart, S., Boggild, C. (2010) The microstructure and biogeochemistry of Arctic cryoconite granules. Annals of Glaciology 51, 87-94.
). The granules form partially by microbial EPS excretion (Hodson et al., 2010bHodson, A., Cameron, K., Boggild, C., Irvine-Fynn, T., Langford, H., Pearce, D., Banwart, S. (2010b) The structure, biological activity and biogeochemistry of cryoconite aggregates upon an Arctic valley glacier: Longyearbreen, Svalbard. Journal of Glaciology 56, 349-362.
; Langford et al., 2010Langford, H., Hodson, A., Banwart, S., Boggild, C. (2010) The microstructure and biogeochemistry of Arctic cryoconite granules. Annals of Glaciology 51, 87-94.
), which we suggest enables more nutrient and particle retention within the cryoconite. Further OC fixation and transformation is, therefore, likely to occur in the cryoconite granules, ultimately leading to the darkening of glacial cryoconite sediment. Over longer periods of time, larger cryoconite aggregations will melt into the surface ice to form cryoconite holes, which are more stable environments for organic matter accumulation. However, in the short term, new cryoconite on glaciers undergoes an important decrease in albedo. The increase in anthropogenic NO3- deposition on glaciers (Lyons et al., 1990Lyons, W.B., Mayewski, P.A., Spencer, M.J., Twickler, M.S. (1990) Nitrate Concentrations in Snow from Remote Areas - Implication for the Global Nox Flux. Biogeochemistry 9, 211-222.
; Duderstadt et al., 2014Duderstadt, K.A., Dibb, J.E., Jackman, C.H., Randall, C.E., Solomon, S.C., Mills, M.J., Schwadron, N.A., Spence, H.E. (2014) Nitrate deposition to surface snow at Summit, Greenland, following the 9 November 2000 solar proton event. Journal of Geophysical Research-Atmospheres 119, 6938-6957.
) has been reported to reduce the microbial N limitation in cryoconite habitats (Telling et al., 2011Telling, J., Anesio, A.M., Tranter, M., Irvine-Fynn, T., Hodson, A., Butler, C., Wadham, J. (2011) Nitrogen fixation on Arctic glaciers, Svalbard. Journal of Geophysical Research-Biogeosciences 116, doi: 10.1029/2010JG001632.
). Enhanced anthropogenic NO3- input will likely lead to a significant decrease in N2 fixation, allowing more bio-energy to be available for C fixation. Consequently, we envisage that there would be a rise in OC production within cryoconite debris, causing considerable albedo reduction, and thus mass loss on glaciers and ice sheets covered in cryoconite.Figure 2 Microbial granule development in ‘light’ samples with nutrient additions. Images (a-c), (e) and (g) were taken using optical microscopy. Autofluorescence microscopy was performed to visualise photosynthetic autotrophs in images (d), (f) and (h). The initial mixture of inorganic dust with 10 % natural cryoconite (a and c) developed into samples rich in granules and filamentous cyanobacteria (b, e-h). Examples of cyanobacterial filaments and colonies (resembling black spheres) are indicated by arrows in images (b), (e-h).
We calculated the maximum microbially-mediated GrIS potential melt to be on average 17.3 ± 2.5 Gt yr-1, using the observed 15.5 percentage point decrease in the debris surface reflection (see Methodology, Supplementary Information). This is about 5 % of the present day runoff (Bamber et al., 2012
Bamber, J., van den Broeke, M., Ettema, J., Lenaerts, J., Rignot, E. (2012) Recent large increases in freshwater fluxes from Greenland into the North Atlantic. Geophysical Research Letters 39.
). The estimate is based on a 10 % debris cover concentration, over the extent of GrIS that undergoes persistent melting (more than 1-10 days/yr). The uncertainty in additional melt includes contributions due to the albedo and debris cover, but not any uncertainty in future climate projections. It is, therefore, a first order estimate. With the projected changing climate, the GrIS melt area is estimated to expand from the present day 31 % of the total ice sheet (Fig. 3a), to 65 % (Fig. 3b) and 92 % (Fig. 3c) by 2100. These projections are based on two representative greenhouse gas concentration pathways (RCP) 4.5 and 8.5. The former is associated with moderate increases in greenhouse gas concentrations, while the latter is closer to a ‘business as usual’ trajectory. The effect will be proportionally larger in small Alpine and Arctic valley glaciers, since the melt areas could cover up to 100 % of the glaciers by 2100 (see Methodology, Supplementary Information). The GrIS biologically-induced melt potential could therefore increase up to 42 and 85 Gt yr-1, for RCP 4.5 and 8.5, respectively. These calculations assume no change in NO3- concentrations and are, therefore, likely a conservative estimate. Furthermore, other ice surface organisms, such as algae (Yallop et al., 2012Yallop, M.L., Anesio, A.M., Perkins, R.G., Cook, J., Telling, J., Fagan, D., MacFarlane, J., Stibal, M., Barker, G., Bellas, C., Hodson, A., Tranter, M., Wadham, J., Roberts, N.W. (2012) Photophysiology and albedo-changing potential of the ice algal community on the surface of the Greenland ice sheet. Isme Journal 6, 2302-2313.
; Lutz et al., 2014Lutz, S., Anesio, A.M., Villar, S.E.J., Benning, L.G. (2014) Variations of algal communities cause darkening of a Greenland glacier. Fems Microbiology Ecology 89, 402-414.
), will likely significantly increase the overall biologically-induced melt potential calculated for cryoconite cyanobacteria in this study. The biological impact on albedo hence plays an important role in modulating mass loss from glacier surfaces and must be included in albedo models to capture adequately the evolving properties of glaciers in a changing climate. Additionally, it is postulated that the warming climate will likely extend melt seasons, leading to increases in biological activity and thus contributing further to the darkening of glaciers and ice sheets (Benning et al., 2014Benning, L.G., Anesio, A.M., Lutz, S., Tranter, M. (2014) Biological impact on Greenland's albedo. Nature Geoscience 7, 691-691.
).Figure 3 (a) Present biologically-induced GrIS potential increase in melt rate, in mm yr-1. (b) and (c) Future biologically-induced GrIS potential increase in melt rate, in mm yr-1. Melt days were derived for the period 2091-2100 for two different greenhouse gas trajectories, RCP4.5 (b) and RCP8.5 (c).
In conclusion, this study provided for the first time a first-order estimate of the effect of microbial activity on glacial albedo and melt for the GrIS. This effect was significant enough to merit inclusion in albedo models for the GrIS and other glacial environments around the world. In future more elaborate models, other factors (such as the latitudinal variability in PAR; differences between surface reflection and albedo measurements, in the field and in the laboratory; and the influence of surface glacial flow and wind on microbial cryoconite communities) would need to be included to provide a more accurate upscaling of the calculations to the entire GrIS.
top
Acknowledgements
This study was funded by grants from the UK National Environment Research Council (NERC; NE/J02399X/1 to Anesio and NERC Doctoral Training Programme Grant to Musilova) and the Royal Society International Exchanges Scheme to Anesio and Takeuchi.
Editor: Eric H. Oelkers
top
Author Contributions
M.M. and A.M.A designed the overall study. M.T. and N.T. were involved in advising the detail of the study design. J.B. performed the climate model simulations. M.M. performed the experiment, collected and processed the data, and wrote the paper. All authors discussed the results and commented on the manuscript.
top
References
Anesio, A.M., Hodson, A.J., Fritz, A., Psenner, R., Sattler, B. (2009) High microbial activity on glaciers: importance to the global carbon cycle. Global Change Biology 15, 955-960.
 Show in context
 Recent research shows that there is high microbial activity on glacial surfaces (Anesio et al., 2009), some associated with pigmented algae, which absorb significantly more light than local inorganic dust particles on the Greenland Ice Sheet (GrIS) (Lutz et al., 2014).
View in article
Microbial activity is believed to cause a further darkening of the already dark inorganic particulates in cryoconite debris by producing and/or transforming OC (Anesio et al., 2009; Hodson et al., 2010a).
View in article
This can lead to a significant decrease in supraglacial albedo, considering cryoconite debris covers 0.1–10 % of the ablation zone of glaciers in the Northern Hemisphere (Hodson et al., 2007; Anesio et al., 2009; Hodson et al., 2010a).
View in article
Bamber, J., van den Broeke, M., Ettema, J., Lenaerts, J., Rignot, E. (2012) Recent large increases in freshwater fluxes from Greenland into the North Atlantic. Geophysical Research Letters 39.
Show in context This is about 5 % of the present day runoff (Bamber et al., 2012).
View in article
Benning, L.G., Anesio, A.M., Lutz, S., Tranter, M. (2014) Biological impact on Greenland's albedo. Nature Geoscience 7, 691-691.
Show in context Additionally, it is postulated that the warming climate will likely extend melt seasons, leading to increases in biological activity and thus contributing further to the darkening of glaciers and ice sheets (Benning et al., 2014).
View in article
Boggild, C.E., Brandt, R.E., Brown, K.J., Warren, S.G. (2010) The ablation zone in northeast Greenland: ice types, albedos and impurities. Journal of Glaciology 56, 101-113.
Show in context Glacier surfaces melt primarily by the absorption of solar radiation, which depends on the surface albedo (Boggild et al., 2010; Box et al., 2012).
View in article
Box, J.E., Fettweis, X., Stroeve, J.C., Tedesco, M., Hall, D.K., Steffen, K. (2012) Greenland ice sheet albedo feedback: thermodynamics and atmospheric drivers. Cryosphere 6, 821-839.
Show in context Glacier surfaces melt primarily by the absorption of solar radiation, which depends on the surface albedo (Boggild et al., 2010; Box et al., 2012).
View in article
Cameron, K.A., Hodson, A.J., Osborn, A.M. (2012a) Carbon and nitrogen biogeochemical cycling potentials of supraglacial cryoconite communities. Polar Biology 35, 1375-1393.
Show in context The N2 fixation was most probably performed by cyanobacteria species belonging to the Nostocaceae family, whose 16S rRNA and N fixation functional genes have been found within Arctic and Antarctic cryoconite (Cameron et al., 2012a,b).
View in article
Cameron, K.A., Hodson, A.J., Osborn, A.M. (2012b) Structure and diversity of bacterial, eukaryotic and archaeal communities in glacial cryoconite holes from the Arctic and the Antarctic. Fems Microbiology Ecology 82, 254-267.
Show in context The N2 fixation was most probably performed by cyanobacteria species belonging to the Nostocaceae family, whose 16S rRNA and N fixation functional genes have been found within Arctic and Antarctic cryoconite (Cameron et al., 2012a,b).
View in article
These were most likely colonies of cyanobacteria, such as Oscillatoriales and Nostocales, previously observed in Greenlandic cryoconite (Cameron et al., 2012b; Stibal et al., 2012b).
View in article
Doherty, S.J., Grenfell, T.C., Forsstrom, S., Hegg, D.L., Brandt, R.E., Warren, S.G. (2013) Observed vertical redistribution of black carbon and other insoluble light-absorbing particles in melting snow. Journal of Geophysical Research-Atmospheres 118, 5553-5569.
Show in context Most studies assume that the accumulation of inorganic and organic particulates, such as anthropogenic and naturally occurring black carbon (Doherty et al., 2013), volcanic ash and dust (Dumont et al., 2014), are key drivers of the darkening and reduction of the ice albedo.
View in article
Duderstadt, K.A., Dibb, J.E., Jackman, C.H., Randall, C.E., Solomon, S.C., Mills, M.J., Schwadron, N.A., Spence, H.E. (2014) Nitrate deposition to surface snow at Summit, Greenland, following the 9 November 2000 solar proton event. Journal of Geophysical Research-Atmospheres 119, 6938-6957.
Show in context The increase in anthropogenic NO3- deposition on glaciers (Lyons et al., 1990; Duderstadt et al., 2014) has been reported to reduce the microbial N limitation in cryoconite habitats (Telling et al., 2011).
View in article
Dumont, M., Brun, E., Picard, G., Michou, M., Libois, Q., Petit, J.R., Geyer, M., Morin, S., Josse, B. (2014) Contribution of light-absorbing impurities in snow to Greenland/'s darkening since 2009. Nature Geoscience 7, 509-512.
Show in context Most studies assume that the accumulation of inorganic and organic particulates, such as anthropogenic and naturally occurring black carbon (Doherty et al., 2013), volcanic ash and dust (Dumont et al., 2014), are key drivers of the darkening and reduction of the ice albedo.
View in article
Fettweis, X., Franco, B., Tedesco, M., van Angelen, J.H., Lenaerts, J.T.M., van den Broeke, M.R., Gallee, H. (2013) Estimating the Greenland ice sheet surface mass balance contribution to future sea level rise using the regional atmospheric climate model MAR. Cryosphere 7, 469-489.
Show in context The reduction of surface reflection due to biological activity, derived from our results, was used as a proxy for a reduction in albedo in the regional climate model Modèle Atmosphérique Régional (MAR; Fettweis et al., 2013) to project future microbially-mediated increases in GrIS melt (see Methodology, Supplementary Information).
View in article
Fountain, A.G., Tranter, M., Nylen, T.H., Lewis, K.J., Mueller, D.R. (2004) Evolution of cryoconite holes and their contribution to meltwater runoff from glaciers in the McMurdo Dry Valleys, Antarctica. Journal of Glaciology 50, 35-45.
Show in context Cryoconite accumulates in water-filled holes on glacier surfaces, causing enhanced melting around the deposited sediment (Fountain et al., 2004).
View in article
Hodson, A., Anesio, A.M., Ng, F., Watson, R., Quirk, J., Irvine-Fynn, T., Dye, A., Clark, C., McCloy, P., Kohler, J., Sattler, B. (2007) A glacier respires: Quantifying the distribution and respiration CO2 flux of cryoconite across an entire Arctic supraglacial ecosystem. Journal of Geophysical Research-Biogeosciences 112, doi: 10.1029/2007JG000452.
Show in context This can lead to a significant decrease in supraglacial albedo, considering cryoconite debris covers 0.1–10 % of the ablation zone of glaciers in the Northern Hemisphere (Hodson et al., 2007; Anesio et al., 2009; Hodson et al., 2010a).
View in article
Hodson, A., Boggild, C., Hanna, E., Huybrechts, P., Langford, H., Cameron, K., Houldsworth, A. (2010a) The cryoconite ecosystem on the Greenland ice sheet. Annals of Glaciology 51, 123-129.
Show in context Microbial activity is believed to cause a further darkening of the already dark inorganic particulates in cryoconite debris by producing and/or transforming OC (Anesio et al., 2009; Hodson et al., 2010a).
View in article
This can lead to a significant decrease in supraglacial albedo, considering cryoconite debris covers 0.1–10 % of the ablation zone of glaciers in the Northern Hemisphere (Hodson et al., 2007; Anesio et al., 2009; Hodson et al., 2010a).
View in article
Hodson, A., Cameron, K., Boggild, C., Irvine-Fynn, T., Langford, H., Pearce, D., Banwart, S. (2010b) The structure, biological activity and biogeochemistry of cryoconite aggregates upon an Arctic valley glacier: Longyearbreen, Svalbard. Journal of Glaciology 56, 349-362.
Show in context Microbes are thought to decompose more labile OC to form dark-coloured humic substances (Takeuchi et al., 2001) and to produce extracellular polymeric substances (EPS) (Hodson et al., 2010b).
View in article
These glue-like compounds help cement organic and inorganic particles (including black carbon; Stibal et al., 2012a) into granules, thereby increasing their residence time on glacier surfaces (Hodson et al., 2010b; Langford et al., 2010).
View in article
Similar cyanobacterial granules can be found in supraglacial cryoconite holes around the world under in situ conditions (Hodson et al., 2010b; Langford et al., 2010).
View in article
The granules form partially by microbial EPS excretion (Hodson et al., 2010b; Langford et al., 2010), which we suggest enables more nutrient and particle retention within the cryoconite.
View in article
Langford, H., Hodson, A., Banwart, S., Boggild, C. (2010) The microstructure and biogeochemistry of Arctic cryoconite granules. Annals of Glaciology 51, 87-94.
Show in context These glue-like compounds help cement organic and inorganic particles (including black carbon; Stibal et al., 2012a) into granules, thereby increasing their residence time on glacier surfaces (Hodson et al., 2010b; Langford et al., 2010).
View in article
Similar cyanobacterial granules can be found in supraglacial cryoconite holes around the world under in situ conditions (Hodson et al., 2010b; Langford et al., 2010).
View in article
The granules form partially by microbial EPS excretion (Hodson et al., 2010b; Langford et al., 2010), which we suggest enables more nutrient and particle retention within the cryoconite.
View in article
Lawson, E.C., Wadham, J.L., Tranter, M., Stibal, M., Lis, G.P., Butler, C.E.H., Laybourn-Parry, J., Nienow, P., Chandler, D., Dewsbury, P. (2014) Greenland Ice Sheet exports labile organic carbon to the Arctic oceans. Biogeosciences 11, 4015-4028.
Show in context The nutrient additions simulated concentrations released from ice melt (Stibal et al., 2012b; Telling et al., 2012; Lawson et al., 2014).
View in article
P concentrations were derived using the Redfield ratio C:N:P of 106:6:1 (Redfield, 1958), while keeping N and C concentrations within the range of concentrations detected in GrIS ice melt (Stibal et al., 2012b; Telling et al., 2012; Lawson et al., 2014).
View in article
Lutz, S., Anesio, A.M., Villar, S.E.J., Benning, L.G. (2014) Variations of algal communities cause darkening of a Greenland glacier. Fems Microbiology Ecology 89, 402-414.
Show in context Recent research shows that there is high microbial activity on glacial surfaces (Anesio et al., 2009), some associated with pigmented algae, which absorb significantly more light than local inorganic dust particles on the Greenland Ice Sheet (GrIS) (Lutz et al., 2014).
View in article
Furthermore, other ice surface organisms, such as algae (Yallop et al., 2012; Lutz et al., 2014), will likely significantly increase the overall biologically-induced melt potential calculated for cryoconite cyanobacteria in this study.
View in article
Lyons, W.B., Mayewski, P.A., Spencer, M.J., Twickler, M.S. (1990) Nitrate Concentrations in Snow from Remote Areas - Implication for the Global Nox Flux. Biogeochemistry 9, 211-222.
Show in context The increase in anthropogenic NO3- deposition on glaciers (Lyons et al., 1990; Duderstadt et al., 2014) has been reported to reduce the microbial N limitation in cryoconite habitats (Telling et al., 2011).
View in article
Martiny, A.C., Pham, C.T.A., Primeau, F.W., Vrugt, J.A., Moore, J.K., Levin, S.A., Lomas, M.W. (2013) Strong latitudinal patterns in the elemental ratios of marine plankton and organic matter. Nature Geoscience 6, 279-283.
Show in context These ratios are comparable to others reported in cold, high latitude regions (Stibal et al., 2008; Martiny et al., 2013).
View in article
Mindl, B., Anesio, A.M., Meirer, K., Hodson, A.J., Laybourn-Parry, J., Sommaruga, R., Sattler, B. (2007) Factors influencing bacterial dynamics along a transect from supraglacial runoff to proglacial lakes of a high Arctic glacier. Fems Microbiology Ecology 59, 307-317.
Show in context Phosphorous limitation was previously reported in glacial environments (Mindl et al., 2007; Stibal et al., 2009), while N limitation was shown to stimulate N2 fixation on glaciers (Telling et al., 2011).
View in article
Nakamura, T., Abe, O., Hasegawa, T., Tamura, R., Ohta, T. (2001) Spectral reflectance of snow with a known grain-size distribution in successive metamorphism. Cold Regions Science and Technology 32, 13-26.
Show in context Albedo is affected by the physical properties of snow and ice, such as the geometric pattern of the snow surface (Pirazzini, 2004), snow metamorphism (Nakamura et al., 2001), water content (Ryser et al., 2013) and particulate impurities on the glacier surface (Paterson, 1994).
View in article
Paterson, W.S.B. (1994) The physics of glaciers. Elsevier, Oxford, 480 pp.
Show in context Albedo is affected by the physical properties of snow and ice, such as the geometric pattern of the snow surface (Pirazzini, 2004), snow metamorphism (Nakamura et al., 2001), water content (Ryser et al., 2013) and particulate impurities on the glacier surface (Paterson, 1994).
View in article
Pirazzini, R. (2004) Surface albedo measurements over Antarctic sites in summer. Journal of Geophysical Research-Atmospheres 109, doi: 10.1029/2004JD004617.
Show in context Albedo is affected by the physical properties of snow and ice, such as the geometric pattern of the snow surface (Pirazzini, 2004), snow metamorphism (Nakamura et al., 2001), water content (Ryser et al., 2013) and particulate impurities on the glacier surface (Paterson, 1994).
View in article
Redfield, A.C. (1958) The Biological Control of Chemical Factors in the Environment. American Scientist 46, 205-221.
Show in context P concentrations were derived using the Redfield ratio C:N:P of 106:6:1 (Redfield, 1958), while keeping N and C concentrations within the range of concentrations detected in GrIS ice melt (Stibal et al., 2012b; Telling et al., 2012; Lawson et al., 2014).
View in article
Ryser, C., Luthi, M., Blindow, N., Suckro, S., Funk, M., Bauder, A. (2013) Cold ice in the ablation zone: Its relation to glacier hydrology and ice water content. Journal of Geophysical Research-Earth Surface 118, 693-705.
Show in context Albedo is affected by the physical properties of snow and ice, such as the geometric pattern of the snow surface (Pirazzini, 2004), snow metamorphism (Nakamura et al., 2001), water content (Ryser et al., 2013) and particulate impurities on the glacier surface (Paterson, 1994).
View in article
Stibal, M., Tranter, M., Telling, J., Benning, L.G. (2008) Speciation, phase association and potential bioavailability of phosphorus on a Svalbard glacier. Biogeochemistry 90, 1-13.
Show in context These ratios are comparable to others reported in cold, high latitude regions (Stibal et al., 2008; Martiny et al., 2013).
View in article
Stibal, M., Anesio, A.M., Blues, C.J.D., Tranter, M. (2009) Phosphatase activity and organic phosphorus turnover on a high Arctic glacier. Biogeosciences 6, 913-922.
Show in context Phosphorous limitation was previously reported in glacial environments (Mindl et al., 2007; Stibal et al., 2009), while N limitation was shown to stimulate N2 fixation on glaciers (Telling et al., 2011).
View in article
Stibal, M., Lawson, E.C., Lis, G.P., Mak, K.M., Wadham, J.L., Anesio, A.M. (2010) Organic matter content and quality in supraglacial debris across the ablation zone of the Greenland ice sheet. Annals of Glaciology 51, 1-8.
Show in context These so-called cryoconite holes contain a substantial amount of organic matter (5–10 %; Takeuchi et al., 2001), with values often >6 % organic carbon (OC) on GrIS (Stibal et al., 2010).
View in article
Stibal, M., Sabacka, M., Zarsky, J. (2012a) Biological processes on glacier and ice sheet surfaces. Nature Geoscience 5, 771-774.
Show in context These glue-like compounds help cement organic and inorganic particles (including black carbon; Stibal et al., 2012a) into granules, thereby increasing their residence time on glacier surfaces (Hodson et al., 2010b; Langford et al., 2010).
View in article
Stibal, M., Telling, J., Cook, J., Mak, K.M., Hodson, A., Anesio, A.M. (2012b) Environmental Controls on Microbial Abundance and Activity on the Greenland Ice Sheet: A Multivariate Analysis Approach. Microbial Ecology 63, 74-84.
Show in context These were most likely colonies of cyanobacteria, such as Oscillatoriales and Nostocales, previously observed in Greenlandic cryoconite (Cameron et al., 2012b; Stibal et al., 2012b).
View in article
The nutrient additions simulated concentrations released from ice melt (Stibal et al., 2012b; Telling et al., 2012; Lawson et al., 2014).
View in article
P concentrations were derived using the Redfield ratio C:N:P of 106:6:1 (Redfield, 1958), while keeping N and C concentrations within the range of concentrations detected in GrIS ice melt (Stibal et al., 2012b; Telling et al., 2012; Lawson et al., 2014).
View in article
Takeuchi, N., Kohshima, S., Seko, K. (2001) Structure, formation, and darkening process of albedo-reducing material (cryoconite) on a Himalayan glacier: A granular algal mat growing on the glacier. Arctic Antarctic and Alpine Research 33, 115-122.
Show in context Furthermore, microbially-rich glacier surface debris (cryoconite) reduces the glacier surface (supraglacial) albedo (Takeuchi et al., 2001).
View in article
These so-called cryoconite holes contain a substantial amount of organic matter (5–10 %; Takeuchi et al., 2001), with values often >6 % organic carbon (OC) on GrIS (Stibal et al., 2010).
View in article
Microbes are thought to decompose more labile OC to form dark-coloured humic substances (Takeuchi et al., 2001) and to produce extracellular polymeric substances (EPS) (Hodson et al., 2010b).
View in article
Telling, J., Anesio, A.M., Tranter, M., Irvine-Fynn, T., Hodson, A., Butler, C., Wadham, J. (2011) Nitrogen fixation on Arctic glaciers, Svalbard. Journal of Geophysical Research-Biogeosciences 116, doi: 10.1029/2010JG001632.
Show in context The increase in anthropogenic NO3- deposition on glaciers (Lyons et al., 1990; Duderstadt et al., 2014) has been reported to reduce the microbial N limitation in cryoconite habitats (Telling et al., 2011).
View in article
Phosphorous limitation was previously reported in glacial environments (Mindl et al., 2007; Stibal et al., 2009), while N limitation was shown to stimulate N2 fixation on glaciers (Telling et al., 2011).
View in article
Telling, J., Stibal, M., Anesio, A.M., Tranter, M., Nias, I., Cook, J., Bellas, C., Lis, G., Wadham, J.L., Sole, A., Nienow, P., Hodson, A. (2012) Microbial nitrogen cycling on the Greenland Ice Sheet. Biogeosciences 9, 2431-2442.
Show in context The nutrient additions simulated concentrations released from ice melt (Stibal et al., 2012b; Telling et al., 2012; Lawson et al., 2014).
View in article
P concentrations were derived using the Redfield ratio C:N:P of 106:6:1 (Redfield, 1958), while keeping N and C concentrations within the range of concentrations detected in GrIS ice melt (Stibal et al., 2012b; Telling et al., 2012; Lawson et al., 2014).
View in article
Yallop, M.L., Anesio, A.M., Perkins, R.G., Cook, J., Telling, J., Fagan, D., MacFarlane, J., Stibal, M., Barker, G., Bellas, C., Hodson, A., Tranter, M., Wadham, J., Roberts, N.W. (2012) Photophysiology and albedo-changing potential of the ice algal community on the surface of the Greenland ice sheet. Isme Journal 6, 2302-2313.
Show in context Furthermore, other ice surface organisms, such as algae (Yallop et al., 2012; Lutz et al., 2014), will likely significantly increase the overall biologically-induced melt potential calculated for cryoconite cyanobacteria in this study.
View in article
top
Supplementary Information
Methodology
Cryoconite Casserole Experimental Setup
The ‘cryoconite casserole’ was a laboratory experiment simulating Greenlandic summer glacier surface conditions, in terms of temperature, lighting and nutrient availability achieved with a daylight simulating light rig inside a cold room laboratory. Samples were exposed to ~0 °C underneath the lighting rig. The rig emitted ~105 µmol photons m-2s-1 photosynthetically active radiation (PAR) per day for 6 months (20 x Prolite daylight lightbulbs, model: HELIX/30W/BC/640), as measured by a PAR sensor attached to a datalogger (Campbell Scientific CR1000). This is the equivalent to the PAR measured over 72 days (268.2 µmol photons m-2s-1 PAR per day) in cryoconite holes, throughout one summer season in southwestern Greenland (Bagshaw, unpublished data), from where the samples were collected. The lower PAR values used in this experiment, in comparison with the values measured at the sampling site, probably did not substantially influence the microbial activity in the samples, as previous studies have found that incoming solar radiation intensity did not contribute significantly to microbial activity at seasonal time scales (Chandler et al., 2014
Chandler, D.M., Alcock, J.D., Wadham, J.L., Mackie, S.L., Telling, J. (2014) Seasonal changes of ice surface characteristics and productivity in the ablation zone of the Greenland Ice Sheet. Cryosphere 8, 1337-1382.
).At the start of the simulation, a mixture of Greenlandic cryoconite debris, collected at the surface of Russell Glacier in southwestern Greenland, was added to sterile Pyrex® glass casseroles. The casseroles were previously cleaned 6 x with Milli-Q water (deionised water - 18.2 MΩ cm-1), acid-washed for 48 h and furnaced at 550 °C for 4 h to remove potential traces of OC. The debris was a mixture of 90 % furnaced (550 °C for 4 h) cryoconite material, to remove all organic matter, and 10 % natural cryoconite material. Altogether, 51 g of the mixture were spread on the bottom of each casserole to form a 1 mm layer over 500 cm2 of the casserole dish. This thin layer of cryoconite simulated the early stages of cryoconite hole development, with mostly inorganic matter present, which can become colonised by microbial communities. The layer was covered by a 1 mm layer of sterile water, which never dried out due to the regular liquid nutrient additions described below. These conditions were similar to those on the surfaces of glaciers, where the freshly deposited cryoconite material generally melts into the surrounding ice. It is thus kept moist for most of the summer season, as well as through regular glacier surface water flow.
Samples were kept either under ‘light’ (i.e., simulated daylight) or ‘dark’ (i.e., covered in aluminium foil) conditions. Phosphorous (P), nitrogen (N) and organic carbon (C) were added to the samples at regular intervals, mimicking nutrient release during ablation on glacier surfaces. N and C were added at concentrations typical of Greenland Ice Sheet (GrIS) ice melt (Stibal et al., 2012
Stibal, M., Telling, J., Cook, J., Mak, K.M., Hodson, A., Anesio, A.M. (2012) Environmental Controls on Microbial Abundance and Activity on the Greenland Ice Sheet: A Multivariate Analysis Approach. Microbial Ecology 63, 74-84.
; Telling et al., 2012bTelling, J., Stibal, M., Anesio, A.M., Tranter, M., Nias, I., Cook, J., Bellas, C., Lis, G., Wadham, J.L., Sole, A., Nienow, P., Hodson, A. (2012b) Microbial nitrogen cycling on the Greenland Ice Sheet. Biogeosciences 9, 2431-2442.
; Lawson et al., 2014Lawson, E.C., Wadham, J.L., Tranter, M., Stibal, M., Lis, G.P., Butler, C.E.H., Laybourn-Parry, J., Nienow, P., Chandler, D., Dewsbury, P. (2014) Greenland Ice Sheet exports labile organic carbon to the Arctic oceans. Biogeosciences 11, 4015-4028.
), while the concentration for P was derived using the Redfield ratio C:N:P of 106:6:1 (Redfield, 1958Redfield, A.C. (1958) The Biological Control of Chemical Factors in the Environment. American Scientist 46, 205-221.
). The nutrients were divided into three different nutrient conditions: 1) blank, sterile water Milli-Q water, 2) N and P additions, and 3) N, P and C additions. The total nutrient concentrations were 0.17 µM KH2PO4, 2.72 µM NH4NO3 and 18.02 µM C6H12O6. In total there were 30 samples: 2 light conditions x 3 nutrient conditions x 5 replicates.Data presented here is from the end of one simulated summer season (i.e., after 6 months of laboratory incubation) and after three consecutive summer seasons (i.e., after 18 months of incubation). The main purpose of this 18 month experiment was to test for what was observed during the 6 month experiment, i.e., whether the microbes inhabiting the cryoconite debris would continue to produce organic matter and thus continue reducing the albedo over longer periods of time. The cryoconite casserole samples were analysed for their nutrient composition, surface reflection, microscopy and chlorophyll a concentration, described below.
Nutrient Analyses
Organic carbon. Triplicate cryoconite casserole debris samples were dried at 70 °C for 2 days for total carbon (TC) and nitrogen (TN) analysis on a Eurovector EA3000 Elemental analyser (Telling et al., 2012a
Telling, J., Anesio, A.M., Tranter, M., Stibal, M., Hawkings, J., Irvine-Fynn, T., Hodson, A., Butler, C., Yallop, M., Wadham, J. (2012a) Controls on the autochthonous production and respiration of organic matter in cryoconite holes on high Arctic glaciers. Journal of Geophysical Research-Biogeosciences 117, doi: 10.1029/2011JG001828.
). Inorganic carbon (IC) was measured following the same method (Telling et al., 2012aTelling, J., Anesio, A.M., Tranter, M., Stibal, M., Hawkings, J., Irvine-Fynn, T., Hodson, A., Butler, C., Yallop, M., Wadham, J. (2012a) Controls on the autochthonous production and respiration of organic matter in cryoconite holes on high Arctic glaciers. Journal of Geophysical Research-Biogeosciences 117, doi: 10.1029/2011JG001828.
) on a Ströhlein Coulomat 720 analyser. Detection limits for TC, IC and TN were 100 µg C g-1 cryoconite, 100 µg C g-1 cryoconite and 100 µg N g-1 cryoconite, respectively, with an accuracy of ±0.1 %. OC concentration was calculated as the difference between TC and IC (Telling et al., 2012aTelling, J., Anesio, A.M., Tranter, M., Stibal, M., Hawkings, J., Irvine-Fynn, T., Hodson, A., Butler, C., Yallop, M., Wadham, J. (2012a) Controls on the autochthonous production and respiration of organic matter in cryoconite holes on high Arctic glaciers. Journal of Geophysical Research-Biogeosciences 117, doi: 10.1029/2011JG001828.
).Particulate organic nitrogen. Cryoconite debris-bound exchangeable inorganic NH4+, NO3- and NO2- (whose sum is termed TIN) were extracted using the 2M KCl method modified from Telling et al. (2011)
Telling, J., Anesio, A.M., Tranter, M., Irvine-Fynn, T., Hodson, A., Butler, C., Wadham, J. (2011) Nitrogen fixation on Arctic glaciers, Svalbard. Journal of Geophysical Research-Biogeosciences 116, doi: 10.1029/2010JG001632.
. The extracts were analysed on a Seal Analytical Autoanalyzer 3, with coefficients of variation for seven replicate standards of 4.8 %, 4.2 %, and 8.7 % for NH4+, NO3- and NO2-, respectively. Detection limits, defined as the sum of the mean of the blanks with 3 x standard deviation (S.D.) of seven Milli-Q water blanks (Telling et al., 2011Telling, J., Anesio, A.M., Tranter, M., Irvine-Fynn, T., Hodson, A., Butler, C., Wadham, J. (2011) Nitrogen fixation on Arctic glaciers, Svalbard. Journal of Geophysical Research-Biogeosciences 116, doi: 10.1029/2010JG001632.
), were 6.0 µmoles L-1, 1.5 µmoles L-1 and 0.2 µmoles L-1, respectively. The debris was weighed after oven drying to convert results to dry weights (Telling et al., 2011Telling, J., Anesio, A.M., Tranter, M., Irvine-Fynn, T., Hodson, A., Butler, C., Wadham, J. (2011) Nitrogen fixation on Arctic glaciers, Svalbard. Journal of Geophysical Research-Biogeosciences 116, doi: 10.1029/2010JG001632.
). Particulate organic nitrogen (PON) was defined as TN‐TIN (Telling et al., 2011Telling, J., Anesio, A.M., Tranter, M., Irvine-Fynn, T., Hodson, A., Butler, C., Wadham, J. (2011) Nitrogen fixation on Arctic glaciers, Svalbard. Journal of Geophysical Research-Biogeosciences 116, doi: 10.1029/2010JG001632.
), with the TIN extraction recovery considered to be 100 % efficient. Only NH4+, NO3- and NO2- extracts with concentrations above the detection limit were used for the calculations of PON.Debris-bound phosphorous. The sequential extraction method by Stibal et al. (2008)
Stibal, M., Tranter, M., Telling, J., Benning, L.G. (2008) Speciation, phase association and potential bioavailability of phosphorus on a Svalbard glacier. Biogeochemistry 90, 1-13.
was used to determine the P content associated with five different fractions of dried cryoconite casserole debris (‘loosely adsorbed P’, ‘Fe- and Al-bound’ P, ‘Ca- and Mg-bound’ P, ‘organic bound’ P and ‘inorganic residual’ P). Extracts from the digestions were analysed on a Shimadzu 1240 mini UV-vis spectrophotometer. Only the results from the organic bound P (OP) and inorganic residual P (IP) are presented (see Results and Table 1) for clarity. The residual P represents the remaining IP in the debris after the Ca- and Mg-bound, Fe- and Al-bound and the loosely adsorbed P had been removed during the sequential extractions (Stibal et al., 2008Stibal, M., Tranter, M., Telling, J., Benning, L.G. (2008) Speciation, phase association and potential bioavailability of phosphorus on a Svalbard glacier. Biogeochemistry 90, 1-13.
). The detection limits were 0.4 ppm and 0.04 ppm, and the coefficients of variation were 4.8 % and 8.6 % for OP and IP, respectively.Surface Reflection
An Ocean Optics Jaz modular spectrometer was used to measure the cryoconite surface reflection, as an analogue for albedo. Measurements for reflection were consistently made underneath the lighting rig of the cryoconite casserole experiment, in the same location and at the same height (12 cm perpendicular to the surface of the sample to cover the entire sample surface). Readings were taken at 0.4 nm intervals over a light spectrum range of 339.7 – 1030.2 nm. Reflection was calculated based on instructions from the manufacturer as:
Eq. S-1
reflection (in %) = (samplereflection - darkreference)/(lightreference - darkreference) x 100
Optical and Autofluorescence Microscopy
Cryoconite casserole samples were collected using sterile spatulas and were spread evenly onto microscopy slides. The structure and composition of the cryoconite sediment was observed with an Olympus BX-51 optical and fluorescent microscope, following previously described methods (Takeuchi et al., 2010
Takeuchi, N., Nishiyama, H., Li, Z.Q. (2010) Structure and formation process of cryoconite granules on Urumqi glacier No. 1, Tien Shan, China. Annals of Glaciology 51, 9-14.
). The fluorescence filter used was Olympus U-MWIG3 with excitation and emission (visual) wavelengths of 530-550 µm and >575 µm, respectively.Chlorophyll a (chla) Concentration
Methods modified from Ameel et al. (1998)
Ameel, J., Ruzycki, E., Axler, R.P. (1998) Analytical chemistry and quality assurance procedures for natural water samples.Natural Resources Research Institute technical report. Central Analytical Laboratory.
, Stibal et al. (2010)Stibal, M., Lawson, E.C., Lis, G.P., Mak, K.M., Wadham, J.L., Anesio, A.M. (2010) Organic matter content and quality in supraglacial debris across the ablation zone of the Greenland ice sheet. Annals of Glaciology 51, 1-8.
and Telling et al. (2012a)Telling, J., Anesio, A.M., Tranter, M., Stibal, M., Hawkings, J., Irvine-Fynn, T., Hodson, A., Butler, C., Yallop, M., Wadham, J. (2012a) Controls on the autochthonous production and respiration of organic matter in cryoconite holes on high Arctic glaciers. Journal of Geophysical Research-Biogeosciences 117, doi: 10.1029/2011JG001828.
were used to determine the chla concentration in the cryoconite casserole debris samples, as an estimate of photosynthetic activity. Chla was extracted from 1 g of cryoconite in clean (rinsed 6 x with Milli-Q water and dried) 15 mL centrifuge tubes using 12 mL of ≥99.8 % HPLC grade acetone (CHROMASOLV®), diluted to 90 % using Milli-Q water, in the dark, under nitrogen (Latasa et al., 1996Latasa, M., Bidigare, R.R., Ondrusek, M.E., Kennicutt, M.C. (1996) HPLC analysis of algal pigments: A comparison exercise among laboratories and recommendations for improved analytical performance. Marine Chemistry 51, 315-324.
; Szymczak‐Żyła et al., 2008Szymczak‐Żyła, M., William Louda, J., Kowalewska, G. (2008) Comparison of Extraction and HPLC Methods for Marine Sedimentary Chloropigment Determinations. Journal of Liquid Chromatography & Related Technologies 31, 1162-1180.
) to prevent oxidation. The sample tubes, wrapped in aluminium foil, were shaken on a reciprocating shaker for 30 min at 200 rpm and kept at 4 °C for 24 h (Stibal et al., 2010Stibal, M., Lawson, E.C., Lis, G.P., Mak, K.M., Wadham, J.L., Anesio, A.M. (2010) Organic matter content and quality in supraglacial debris across the ablation zone of the Greenland ice sheet. Annals of Glaciology 51, 1-8.
). Subsequently, the tubes were shaken again for 30 min at 200 rpm and centrifuged at 4000 rpm for 10 min to remove suspended particles, which could interfere with absorbance readings. Remaining pellets in the tubes were dried to determine the dry weight of the debris. The supernatant extracts were analysed by spectrofluorometry on a Fluorolog-3 spectrofluorometer at emission wavelengths of 665 ± 2 nm. Emission values were standardised against purified chla from Anacystis nidulans algae (Sigma chemical C6144). Two procedural blanks containing no cryoconite, only 90 % acetone, were run every 10 samples. The detection limit was 3.6 ppb chla and the coefficient of variation was 9.4 %.Calculation of the Impact on the Melt potential for GrIS
We assumed a 15.5 % reduction in albedo due to microbial activity within cryoconite (Fig. 1a), scaled up to all GrIS debris cover (as 90 % of microbial activity is associated with the debris; Anesio et al., 2009
Anesio, A.M., Hodson, A.J., Fritz, A., Psenner, R., Sattler, B. (2009) High microbial activity on glaciers: importance to the global carbon cycle. Global Change Biology 15, 955-960.
), over the extent of the ice sheet that experiences persistent melting (more than 1-10 day/yr). We also assumed a 10 % variance in the debris concentration and the albedo reduction in estimating the projected melt uncertainty. While the reduction in spectral reflection was used as a proxy for a reduction in albedo in our calculations and in previous studies (Takeuchi et al., 2001Takeuchi, N., Kohshima, S., Seko, K. (2001) Structure, formation, and darkening process of albedo-reducing material (cryoconite) on a Himalayan glacier: A granular algal mat growing on the glacier. Arctic Antarctic and Alpine Research 33, 115-122.
), it is not completely equivalent to albedo, as it does not provide a directional integration of reflectance over all sun-view geometries. The persistent melting of more than 1-10 day/yr was used because the microbial activity within cryoconite is reliant on only a minimal source of liquid water and nutrients, as observed in this experiment. The melt area was determined from the mean of 11 years of satellite passive microwave radiometer observations of daily melt extent for the period 2001-2011 using the XPGR algorithm (Fettweis et al., 2011Fettweis, X., Tedesco, M., van den Broeke, M., Ettema, J. (2011) Melting trends over the Greenland ice sheet (1958-2009) from spaceborne microwave data and regional climate models. Cryosphere 5, 359-375.
). Grid cells were only included if they experienced more than 1-10 days melt over the summer. The additional solar radiation absorbed at the surface due the reduction in albedo was calculated from observations of net downwelling shortwave radiation fluxes for JJA near the equilibrium line and ablation zone of the ice sheet (Ettema et al., 2010Ettema, J., van den Broeke, M.R., van Meijgaard, E., van de Berg, W.J. (2010) Climate of the Greenland ice sheet using a high-resolution climate model - Part 2: Near-surface climate and energy balance. Cryosphere 4, 529-544.
). This additional energy absorbed was then used to estimate the extra melt at the surface caused by biological activity following the approach detailed by Cawkwell and Bamber (2002)Cawkwell, F.G.L., Bamber, J.L. (2002) The impact of cloud cover on the net radiation budget of the Greenland ice sheet. Annals of Glaciology, 34, 141-149.
. For the projections, we used the global climate model Model for Interdisciplinary Research on Climate (MIROC) CMIP5 output to drive the regional climate model, MAR over Greenland (Fettweis et al., 2013Fettweis, X., Franco, B., Tedesco, M., van Angelen, J.H., Lenaerts, J.T.M., van den Broeke, M.R., Gallee, H. (2013) Estimating the Greenland ice sheet surface mass balance contribution to future sea level rise using the regional atmospheric climate model MAR. Cryosphere 7, 469-489.
). MIROC lies close to the mid-range response of the CMIP5 simulations over Greenland and is one of a subset that was identified as performing best over the ice sheet (Fettweis et al., 2013Fettweis, X., Franco, B., Tedesco, M., van Angelen, J.H., Lenaerts, J.T.M., van den Broeke, M.R., Gallee, H. (2013) Estimating the Greenland ice sheet surface mass balance contribution to future sea level rise using the regional atmospheric climate model MAR. Cryosphere 7, 469-489.
). We calculated the change in the number of melt days per grid cell between the mean of 2001-2011 and 2091-2100 for two representative greenhouse gas concentration pathways: RCP 4.5 and RCP 8.5. The present day melt extent from MIROC was scaled to match the present day passive microwave radiometer data (Fig. 3a). For each additional melt day, the increased melting due to a reduction in albedo from biological activity was calculated based on the methods by Cawkwell and Bamber (2002)Cawkwell, F.G.L., Bamber, J.L. (2002) The impact of cloud cover on the net radiation budget of the Greenland ice sheet. Annals of Glaciology, 34, 141-149.
. The 2001-2011 melt days were scaled to match the passive microwave observations for the same period to account for biases in the MIROC simulations (Fettweis et al., 2013Fettweis, X., Franco, B., Tedesco, M., van Angelen, J.H., Lenaerts, J.T.M., van den Broeke, M.R., Gallee, H. (2013) Estimating the Greenland ice sheet surface mass balance contribution to future sea level rise using the regional atmospheric climate model MAR. Cryosphere 7, 469-489.
). Thus, we were in effect calculating anomalies relative to observed 2001-2011 values (Fig. 3b,c).The potential melt increase for Alpine and Arctic glaciers was estimated to reach 100 % based on the accumulation area ratio of a glacier (AAR), the percentage of a glacier that remains a snow-covered accumulation zone at the end of the summer melt season. Bahr et al. (2009)
Bahr, D.B., Dyurgerov, M., Meier, M.F. (2009) Sea-level rise from glaciers and ice caps: A lower bound. Geophysical Research Letters 36, doi: 10.1029/2008GL036309.
found an AAR baseline value of 0.57 for worldwide glaciers using long term records, consistent with the study of 24,476 Eurasian glaciers and 5,422 European glaciers (exclusive of Russia) which had an average AAR of 0.58 (Bahr, 1997Bahr, D.B. (1997) Width and length scaling of glaciers. Journal of Glaciology 43, 557-562.
). The ablation area of these glaciers was therefore 42-43 %. By comparison, the present day GrIS has an AAR of ~0.9 (Ettema, 2010Ettema, J. (2010) The present-day climate of Greenland: a study with a regional climate model. PhD Thesis, Utrecht University.
), which corresponds to an ablation area of 10 % and a melt area for the GrIS of 31 % (as calculated above). Assuming that the melt area approximately scales with the ablation area, if the GrIS melt area would increase from 31 % to 65 % or 92 % (RCP 4.5 or RCP 8.5, respectively), then this would mean that the whole of the Alpine and Arctic glaciers would become ablation areas and thus melt areas by 2100.Supplementary Information References
Ameel, J., Ruzycki, E., Axler, R.P. (1998) Analytical chemistry and quality assurance procedures for natural water samples. Natural Resources Research Institute technical report. Central Analytical Laboratory.
Show in context Methods modified from Ameel et al. (1998), Stibal et al. (2010) and Telling et al. (2012a) were used to determine the chla concentration in the cryoconite casserole debris samples, as an estimate of photosynthetic activity.
View in Supplementary Information
Anesio, A.M., Hodson, A.J., Fritz, A., Psenner, R., Sattler, B. (2009) High microbial activity on glaciers: importance to the global carbon cycle. Global Change Biology 15, 955-960.
Show in context We assumed a 15.5 % reduction in albedo due to microbial activity within cryoconite (Fig. 1a), scaled up to all GrIS debris cover (as 90 % of microbial activity is associated with the debris; Anesio et al., 2009), over the extent of the ice sheet that experiences persistent melting (more than 1-10 day/yr).
View in Supplementary Information
Bahr, D.B. (1997) Width and length scaling of glaciers. Journal of Glaciology 43, 557-562.
Show in context Bahr et al. (2009) found an AAR baseline value of 0.57 for worldwide glaciers using long term records, consistent with the study of 24,476 Eurasian glaciers and 5,422 European glaciers (exclusive of Russia) which had an average AAR of 0.58 (Bahr, 1997).
View in Supplementary Information
Bahr, D.B., Dyurgerov, M., Meier, M.F. (2009) Sea-level rise from glaciers and ice caps: A lower bound. Geophysical Research Letters 36, doi: 10.1029/2008GL036309.
Show in context Bahr et al. (2009) found an AAR baseline value of 0.57 for worldwide glaciers using long term records, consistent with the study of 24,476 Eurasian glaciers and 5,422 European glaciers (exclusive of Russia) which had an average AAR of 0.58 (Bahr, 1997).
View in Supplementary Information
Cawkwell, F.G.L., Bamber, J.L. (2002) The impact of cloud cover on the net radiation budget of the Greenland ice sheet. Annals of Glaciology, 34, 141-149.
Show in context This additional energy absorbed was then used to estimate the extra melt at the surface caused by biological activity following the approach detailed by Cawkwell and Bamber (2002).
View in Supplementary Information
For each additional melt day, the increased melting due to a reduction in albedo from biological activity was calculated based on the methods by Cawkwell and Bamber (2002).
View in Supplementary Information
Chandler, D.M., Alcock, J.D., Wadham, J.L., Mackie, S.L., Telling, J. (2014) Seasonal changes of ice surface characteristics and productivity in the ablation zone of the Greenland Ice Sheet. Cryosphere 8, 1337-1382.
Show in context The lower PAR values used in this experiment, in comparison with the values measured at the sampling site, probably did not substantially influence the microbial activity in the samples, as previous studies have found that incoming solar radiation intensity did not contribute significantly to microbial activity at seasonal time scales (Chandler et al., 2014).
View in Supplementary Information
Ettema, J. (2010) The present-day climate of Greenland: a study with a regional climate model. PhD Thesis, Utrecht University.
Show in context The ablation area of these glaciers was therefore 42-43 %. By comparison, the present day GrIS has an AAR of ~0.9 (Ettema, 2010), which corresponds to an ablation area of 10 % and a melt area for the GrIS of 31 % (as calculated above).
View in Supplementary Information
Ettema, J., van den Broeke, M.R., van Meijgaard, E., van de Berg, W.J. (2010) Climate of the Greenland ice sheet using a high-resolution climate model - Part 2: Near-surface climate and energy balance. Cryosphere 4, 529-544.
Show in context The additional solar radiation absorbed at the surface due the reduction in albedo was calculated from observations of net downwelling shortwave radiation fluxes for JJA near the equilibrium line and ablation zone of the ice sheet (Ettema et al., 2010).
View in Supplementary Information
Fettweis, X., Tedesco, M., van den Broeke, M., Ettema, J. (2011) Melting trends over the Greenland ice sheet (1958-2009) from spaceborne microwave data and regional climate models. Cryosphere 5, 359-375.
Show in context The melt area was determined from the mean of 11 years of satellite passive microwave radiometer observations of daily melt extent for the period 2001-2011 using the XPGR algorithm (Fettweis et al., 2011).
View in Supplementary Information
Fettweis, X., Franco, B., Tedesco, M., van Angelen, J.H., Lenaerts, J.T.M., van den Broeke, M.R., Gallee, H. (2013) Estimating the Greenland ice sheet surface mass balance contribution to future sea level rise using the regional atmospheric climate model MAR. Cryosphere 7, 469-489.
Show in context For the projections, we used the global climate model Model for Interdisciplinary Research on Climate (MIROC) CMIP5 output to drive the regional climate model, MAR over Greenland (Fettweis et al., 2013).
View in Supplementary Information
MIROC lies close to the mid-range response of the CMIP5 simulations over Greenland and is one of a subset that was identified as performing best over the ice sheet (Fettweis et al., 2013).
View in Supplementary Information
The 2001-2011 melt days were scaled to match the passive microwave observations for the same period to account for biases in the MIROC simulations (Fettweis et al., 2013).
View in Supplementary Information
Latasa, M., Bidigare, R.R., Ondrusek, M.E., Kennicutt, M.C. (1996) HPLC analysis of algal pigments: A comparison exercise among laboratories and recommendations for improved analytical performance. Marine Chemistry 51, 315-324.
Show in context Chla was extracted from 1 g of cryoconite in clean (rinsed 6 x with Milli-Q water and dried) 15 mL centrifuge tubes using 12 mL of ≥99.8 % HPLC grade acetone (CHROMASOLV®), diluted to 90 % using Milli-Q water, in the dark, under nitrogen (Latasa et al., 1996; Szymczak‐Żyła et al., 2008) to prevent oxidation.
View in Supplementary Information
Lawson, E.C., Wadham, J.L., Tranter, M., Stibal, M., Lis, G.P., Butler, C.E.H., Laybourn-Parry, J., Nienow, P., Chandler, D., Dewsbury, P. (2014) Greenland Ice Sheet exports labile organic carbon to the Arctic oceans. Biogeosciences 11, 4015-4028.
Show in context N and C were added at concentrations typical of Greenland Ice Sheet (GrIS) ice melt (Stibal et al., 2012; Telling et al., 2012b; Lawson et al., 2014), while the concentration for P was derived using the Redfield ratio C:N:P of 106:6:1 (Redfield, 1958).
View in Supplementary Information
Redfield, A.C. (1958) The Biological Control of Chemical Factors in the Environment. American Scientist 46, 205-221.
Show in context N and C were added at concentrations typical of Greenland Ice Sheet (GrIS) ice melt (Stibal et al., 2012; Telling et al., 2012b; Lawson et al., 2014), while the concentration for P was derived using the Redfield ratio C:N:P of 106:6:1 (Redfield, 1958).
View in Supplementary Information
Stibal, M., Tranter, M., Telling, J., Benning, L.G. (2008) Speciation, phase association and potential bioavailability of phosphorus on a Svalbard glacier. Biogeochemistry 90, 1-13.
Show in context The sequential extraction method by Stibal et al. (2008) was used to determine the P content associated with five different fractions of dried cryoconite casserole debris (‘loosely adsorbed P’, ‘Fe- and Al-bound’ P, ‘Ca- and Mg-bound’ P, ‘organic bound’ P and ‘inorganic residual’ P).
View in Supplementary Information
The residual P represents the remaining IP in the debris after the Ca- and Mg-bound, Fe- and Al-bound and the loosely adsorbed P had been removed during the sequential extractions (Stibal et al., 2008).
View in Supplementary Information
Stibal, M., Lawson, E.C., Lis, G.P., Mak, K.M., Wadham, J.L., Anesio, A.M. (2010) Organic matter content and quality in supraglacial debris across the ablation zone of the Greenland ice sheet. Annals of Glaciology 51, 1-8.
Show in context Methods modified from Ameel et al. (1998), Stibal et al. (2010) and Telling et al. (2012a) were used to determine the chla concentration in the cryoconite casserole debris samples, as an estimate of photosynthetic activity.
View in Supplementary Information
The sample tubes, wrapped in aluminium foil, were shaken on a reciprocating shaker for 30 min at 200 rpm and kept at 4 °C for 24 h (Stibal et al., 2010).
View in Supplementary Information
Stibal, M., Telling, J., Cook, J., Mak, K.M., Hodson, A., Anesio, A.M. (2012) Environmental Controls on Microbial Abundance and Activity on the Greenland Ice Sheet: A Multivariate Analysis Approach. Microbial Ecology 63, 74-84.
Show in context Methods modified from Ameel et al. (1998), Stibal et al. (2010) and Telling et al. (2012a) were used to determine the chla concentration in the cryoconite casserole debris samples, as an estimate of photosynthetic activity.
View in Supplementary Information
N and C were added at concentrations typical of Greenland Ice Sheet (GrIS) ice melt (Stibal et al., 2012; Telling et al., 2012b; Lawson et al., 2014), while the concentration for P was derived using the Redfield ratio C:N:P of 106:6:1 (Redfield, 1958).
View in Supplementary Information
Szymczak‐Żyła, M., William Louda, J., Kowalewska, G. (2008) Comparison of Extraction and HPLC Methods for Marine Sedimentary Chloropigment Determinations. Journal of Liquid Chromatography & Related Technologies 31, 1162-1180.
Show in context Chla was extracted from 1 g of cryoconite in clean (rinsed 6 x with Milli-Q water and dried) 15 mL centrifuge tubes using 12 mL of ≥99.8 % HPLC grade acetone (CHROMASOLV®), diluted to 90 % using Milli-Q water, in the dark, under nitrogen (Latasa et al., 1996; Szymczak‐Żyła et al., 2008) to prevent oxidation.
View in Supplementary Information
Takeuchi, N., Kohshima, S., Seko, K. (2001) Structure, formation, and darkening process of albedo-reducing material (cryoconite) on a Himalayan glacier: A granular algal mat growing on the glacier. Arctic Antarctic and Alpine Research 33, 115-122.
Show in context While the reduction in spectral reflection was used as a proxy for a reduction in albedo in our calculations and in previous studies (Takeuchi et al., 2001), it is not completely equivalent to albedo, as it does not provide a directional integration of reflectance over all sun-view geometries.
View in Supplementary Information
Takeuchi, N., Nishiyama, H., Li, Z.Q. (2010) Structure and formation process of cryoconite granules on Urumqi glacier No. 1, Tien Shan, China. Annals of Glaciology 51, 9-14.
Show in context The structure and composition of the cryoconite sediment was observed with an Olympus BX-51 optical and fluorescent microscope, following previously described methods (Takeuchi et al., 2010).
View in Supplementary Information
Telling, J., Anesio, A.M., Tranter, M., Irvine-Fynn, T., Hodson, A., Butler, C., Wadham, J. (2011) Nitrogen fixation on Arctic glaciers, Svalbard. Journal of Geophysical Research-Biogeosciences 116, doi: 10.1029/2010JG001632.
Show in context Cryoconite debris-bound exchangeable inorganic NH4+, NO3- and NO2- (whose sum is termed TIN) were extracted using the 2M KCl method modified from Telling et al. (2011).
View in Supplementary Information
Detection limits, defined as the sum of the mean of the blanks with 3 x standard deviation (S.D.) of seven Milli-Q water blanks (Telling et al., 2011), were 6.0 µmoles L-1, 1.5 µmoles L-1 and 0.2 µmoles L-1, respectively.
View in Supplementary Information
The debris was weighed after oven drying to convert results to dry weights (Telling et al., 2011).
View in Supplementary Information
Particulate organic nitrogen (PON) was defined as TN‐TIN (Telling et al., 2011), with the TIN extraction recovery considered to be 100 % efficient. Only NH4+, NO3- and NO2- extracts with concentrations above the detection limit were used for the calculations of PON.
View in Supplementary Information
Telling, J., Anesio, A.M., Tranter, M., Stibal, M., Hawkings, J., Irvine-Fynn, T., Hodson, A., Butler, C., Yallop, M., Wadham, J. (2012a) Controls on the autochthonous production and respiration of organic matter in cryoconite holes on high Arctic glaciers. Journal of Geophysical Research-Biogeosciences 117, doi: 10.1029/2011JG001828.
Show in context Triplicate cryoconite casserole debris samples were dried at 70 °C for 2 days for total carbon (TC) and nitrogen (TN) analysis on a Eurovector EA3000 Elemental analyser (Telling et al., 2012a).
View in Supplementary Information
Inorganic carbon (IC) was measured following the same method (Telling et al., 2012a) on a Ströhlein Coulomat 720 analyser.
View in Supplementary Information
Detection limits for TC, IC and TN were 100 µg C g-1 cryoconite, 100 µg C g-1 cryoconite and 100 µg N g-1 cryoconite, respectively, with an accuracy of ±0.1 %. OC concentration was calculated as the difference between TC and IC (Telling et al., 2012a).
View in Supplementary Information
Methods modified from Ameel et al. (1998), Stibal et al. (2010) and Telling et al. (2012a) were used to determine the chla concentration in the cryoconite casserole debris samples, as an estimate of photosynthetic activity.
View in Supplementary Information
Telling, J., Stibal, M., Anesio, A.M., Tranter, M., Nias, I., Cook, J., Bellas, C., Lis, G., Wadham, J.L., Sole, A., Nienow, P., Hodson, A. (2012b) Microbial nitrogen cycling on the Greenland Ice Sheet. Biogeosciences 9, 2431-2442.
Show in context N and C were added at concentrations typical of Greenland Ice Sheet (GrIS) ice melt (Stibal et al., 2012; Telling et al., 2012b; Lawson et al., 2014), while the concentration for P was derived using the Redfield ratio C:N:P of 106:6:1 (Redfield, 1958).
View in Supplementary Information