


Molecular hydrogen in mantle minerals
Affiliations | Corresponding Author | Cite as

- Share this article


Article views:15,929Cumulative count of HTML views and PDF downloads.
- Download Citation
- Rights & Permissions

Abstract
Figures and Tables
 Table 1 Details of H2 dissolution experiments. |  Figure 1 Recovered orthopyroxene crystal annealed at 2 GPa and 1100 °C and polarised and unpolarised FTIR spectra of the crystal containing molecular H2. The spectra were normalised to 1 cm thickness and vertically offset. The crystal was surrounded by fine powder of a spinel peridotite of broadly equilibrium composition (e.g., with similar composition between the crystal and orthopyroxene in the peridotite). The capsule was embedded in epoxy resin, and the crystal remained nearly intact after the run. | 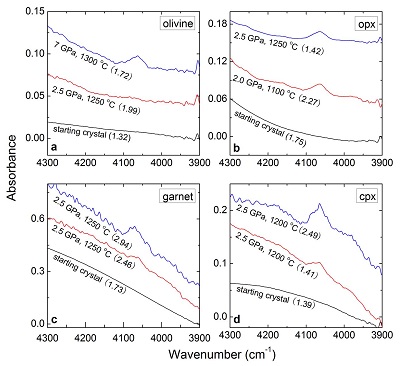 Figure 2 Unpolarised FTIR spectra of (a) olivine, (b) orthopyroxene, (c) garnet, and (d) clinopyroxene containing dissolved molecular H2. Experimental conditions are given below each spectrum; numbers in parentheses are the thickness (mm) of the polished crystal. The spectra were not normalised to constant thickness, but vertically offset. The two spectra for either the annealed (c) garnet or (d) clinopyroxene were measured on the same recovered crystal after polishing to different thickness. | 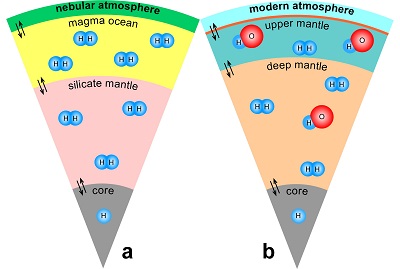 Figure 3 Schematic illustration of water storage (a) in the early mantle during the magma ocean stage and (b) in the modern mantle (not to scale). In the early Earth, where highly reducing conditions were prevailing, H2 might have been distributed between different reservoirs through equilibrium partitioning. In the modern Earth, where plate tectonics and mantle redox stratification are present, hydrogen in the oxidised shallow upper mantle is mostly dissolved in minerals as OH groups, while significant amounts of H2 are likely still present in the deep reduced mantle. |
| Table 1 | Figure 1 | Figure 2 | Figure 3 |
Supplementary Figures and Tables
| Table S-1 Average composition of the starting minerals from microprobe analyses (wt. %). | Table S-2 Experimental conditions and FTIR characterisation of OH in opx. |  Figure S-1 Polarised FTIR spectra for the quantification of OH in orthopyroxene, including the starting crystal, the blank run, the solubility run, the 1st stage H2 dissolution run and the 2nd stage H2 oxidation run. All spectra were normalised to 1 cm thickness. |  Figure S-2 Unpolarised FTIR spectrum of an orthopyroxene crystal H2-saturated at 2.5 GPa, 1250 °C and under very oxidising conditions buffered by Fe2O3-Fe3O4. The experiment was conducted using a Pt capsule (OD 5.0 mm, ID 4.6 mm, length 10.0 mm) for 24-hrs duration. Because H2 in the system is negligible, a peak at ~4062 cm-1, if present, would definitely be caused by the overtones of OH. The spectrum was normalised to 1 cm thickness. Inset is an enlarged view of the spectrum at 4300-3900 cm-1, and no peak is observed ~4062 cm-1. Crystal thickness for the measurement is 1.31 mm. |  Figure S-3 FTIR spectra of a H2-saturated (a) olivine and (b) garnet under Fe-FeO buffered conditions. Spectra of the starting crystals in Figure 2 are also shown. If the peak at ~4062 cm-1 were caused by contamination of epoxy resin, crystals with significant IR bands due to epoxy resin (2750-3000 cm-1) would be characterised by a marked peak at ~4062 cm-1, and vice versa. The spectra were normalised to 1 cm thickness. Insets are the enlarged view of the spectra at 4300-3900 cm-1. The spectra are from unpolarised analyses except the spectrum of the annealed olivine, which was polarised parallel to a random direction. The annealed garnet crystal (2.08 mm thick) demonstrates strong absorption bands of epoxy resin at ~3000-2750 cm-1, but no absorption peaks are observed at ~4100-4000 cm-1; in contrast, the annealed olivine crystal (1.99 mm thick) has an apparent peak at ~4062 cm-1, but with negligible signals of epoxy resin. These data show that the ~4062 cm-1 band cannot be due to contamination. |
| Table S-1 | Table S-2 | Figure S-1 | Figure S-2 | Figure S-3 |
top
Introduction
The presence of hydrogen in the silicate mantle is a key parameter in influencing Earth’s climate, habitability, and geochemical evolution; without some hydrogen in the mantle, plate tectonics would likely not exist on Earth (Regenauer-Lieb et al., 2001
Regenauer-Lieb, K., Yuen, D.A., Branlund, J. (2001) The initiation of subduction: criticality by addition of water? Science 294, 578-580.
; Mierdel et al., 2007Mierdel, K., Keppler, H., Smyth, J.R., Langenhorst, F. (2007) Water solubility in aluminous orthopyroxene and the origin of Earth's asthenosphere. Science 315, 364-368.
). The formation of OH defects in nominally anhydrous minerals (Bell and Rossman, 1992Bell, D.R., Rossman, G.R. (1992) Water in Earth's mantle: the role of nominally anhydrous minerals. Science 255, 1391-1397.
; Keppler and Smyth, 2006Keppler, H., Smyth, J.R. (2006) Water in Nominally Anhydrous Minerals. Mineralogical Society of America, Washington DC., USA, 478 pp.
) requires a sufficiently high oxygen fugacity, fO2, to oxidise hydrogen to molecular H2O or OH groups. However, highly reducing conditions may prevail deep in the modern Earth (Frost and McCammon, 2008Frost, D.J., McCammon, C.A. (2008) The redox state of the Earth's mantle. Annual Review of Earth and Planetary Sciences 36, 389-420.
), as well as on the Moon and on Mars (Wadhwa, 2008Wadhwa, M. (2008) Redox conditions on small bodies, the Moon and Mars. Reviews in Mineralogy and Geochemistry 68, 493-510.
). The early Earth (Yang et al., 2014Yang, X., Gaillard, F., Scaillet, B. (2014) A relatively reduced Hadean continental crust and implications for the early atmosphere and crustal rheology. Earth and Planetary Science Letters 393, 210-219.
), especially during its early accretion (Rubie et al., 2011Rubie, D.C., Frost, D.J., Mann, U., Asahara, Y., Nimmo, F., Tsuno, K., Kegler, P., Holzheid, A., Palme, H. (2011) Heterogeneous accretion, composition and core-mantle differentiation of the Earth. Earth and Planetary Science Letters 301, 31-42.
), was likely extremely reduced, with fO2 far below the Fe-FeO buffer. Under these conditions, hydrogen is not oxidised to H2O, but is present as H2, and the retention of H in the early mantle would then only be possible if H2 could be directly dissolved in mantle minerals. This does not appear implausible from available data on He solubility in olivine (Parman et al., 2005Parman, S.W., Kurz, M.D., Hart, S.R., Grove, T.L. (2005) Helium solubility in olivine and implications for high 3He/4He in ocean island basalts. Nature 437, 1140-1143.
). In this study, we have investigated the solubility of H2 in olivine, orthopyroxene (opx), clinopyroxene (cpx) and garnet by experiments at 2-7 GPa, 1100-1300 °C and Fe-FeO buffered conditions. Experiments were conducted on gem-quality single crystals, and recovered large crystals (up to 2-3 mm in size) were studied by Fourier-transform infrared (FTIR) spectroscopy (see Supplementary Information).top
H2 Dissolution and Quantification
Details of the experiments are given in Table 1, and representative spectra are illustrated in Figures 1 and 2. A small peak at ~4062 cm-1 was observed for most of the annealed crystals. This peak cannot be caused by gaseous H2, e.g., in fluid inclusions, because H2 does not possess a dipole moment and therefore is not infrared active. Also, this peak cannot be attributed to overtones of OH or of any other species, because in an experiment at 2.5 GPa and 1250 °C buffered by Fe2O3-Fe3O4 (with fO2 about 9 log units above the Fe-FeO buffer), yielding very oxidising conditions where H2 in the system is negligible, the annealed thick opx crystal showed strong OH bands, but no band in the 4100-4000 cm-1 range (Fig. S-2). We also show that this peak is unrelated to the embedding medium used during sample polishing (Fig. S-3). The only plausible explanation for the peak is therefore that it is due to H2 dissolved in the lattice of the crystals.
Table 1 Details of H2 dissolution experiments.
| Sample | P (GPa) | T (°C) | ƒO2 buffer | ƒH2 (bar) | Duration (hr) | Thickness (mm)a | Area (cm-2) | Height (cm-1) | ppm H2Ob | ppm H2Oc | wt. % H2Od |
| unpolarised FTIR | |||||||||||
| opx | 2 | 1100 | Fe-FeO | 5.45E+04 | 24 | 2.27 | 2.58 | 0.065 | 15 | 14 | 0.137 |
| opx | 2.5 | 1250 | Fe-FeO | 8.25E+04 | 24 | 1.42 | 3.11 | 0.079 | 18 | 17 | 0.167 |
| opx | 2.5 | 1250 | Fe2O3-Fe3O4 | 4.68E+00 | 24 | 1.31 | - | - | - | - | - |
| olivine | 2.5 | 1250 | Fe-FeO | 8.25E+04 | 24 | 1.99 | - | - | - | - | - |
| olivine | 7 | 1300 | Fe-FeO | 3.02E+06 | 16 | 1.72 | 2.95 | 0.077 | 17 | 16 | 0.161 |
| garnet | 2.5 | 1250 | Fe-FeO | 8.25E+04 | 24 | 2.46 | 3.51 | 0.131 | 20 | 27 | 0.275 |
| garnet | 2.5 | 1250 | Fe-FeO | 8.25E+04 | 24 | 2.94 | 6.34 | 0.232 | 37 | 48 | 0.486 |
| cpx | 2.5 | 1250 | Fe-FeO | 8.25E+04 | 24 | 1.41 | 4.52 | 0.128 | 26 | 27 | 0.268 |
| cpx | 2.5 | 1250 | Fe-FeO | 8.25E+04 | 24 | 2.49 | 4.66 | 0.149 | 27 | 31 | 0.313 |
| polarised FTIR | |||||||||||
| opx E//a | 2 | 1100 | Fe-FeO | 5.45E+04 | 24 | 2.27 | 2.78 | 0.079 | 5 | 6 | 0.056 |
| opx E//b | 2 | 1100 | Fe-FeO | 5.45E+04 | 24 | 2.06 | 1.41 | 0.047 | 3 | 3 | 0.033 |
| opx E//c | 2 | 1100 | Fe-FeO | 5.45E+04 | 24 | 2.27 | 3.53 | 0.089 | 7 | 6 | 0.062 |
| total | 7.72 | 0.215 | 15 | 15 | 0.151 | ||||||
To facilitate comparison, all H2 contents are given as the equivalent contents of H2O. Height and area are the linear and integral absorbance of the ~4062 cm-1 peak, respectively normalised to 1 cm thickness. Unpolarised and polarised data of opx annealed at 2 GPa and 1100 °C are for the same sample from the 1st stage H2 dissolution run (see Supplementary Information). Data labelled ‘total’ are the sum along a, b and c axes. For the opx crystal, the absorbance of unpolarised analysis is about 1/3 the total absorbance of polarised analyses, probably due to the orientation effect. ƒH2 is the calculated equilibrium H2 fugacity (see details in Yang, 2016Yang, X. (2016) Effect of oxygen fugacity on OH dissolution in olivine under peridotite-saturated conditions: an experimental study at 1.5-7 GPa and 1100-1300 °C. Geochimica et Cosmochimica Acta 173, 319-336.).
- The peak is too weak for any quantitative evaluation (see Fig. 2a).
a Thickness of doubly-polished crystals.
b Estimated by the integrated area of the ~4062 cm-1 peak with the determined extinction coefficient of 4.63 ppm-1 H2O cm-2 for opx.
c Estimated by the height of the ~4062 cm-1 peak with the determined extinction coefficient of 0.13 ppm-1 H2O cm-1 for opx.
d Estimated by the reported extinction coefficient of 0.26 L/mol cm for SiO2 glass by Shelby (1994)Shelby, J.E. (1994) Protonic species in vitreous silica. Journal of Non-crystalline Solids 179, 137-147..

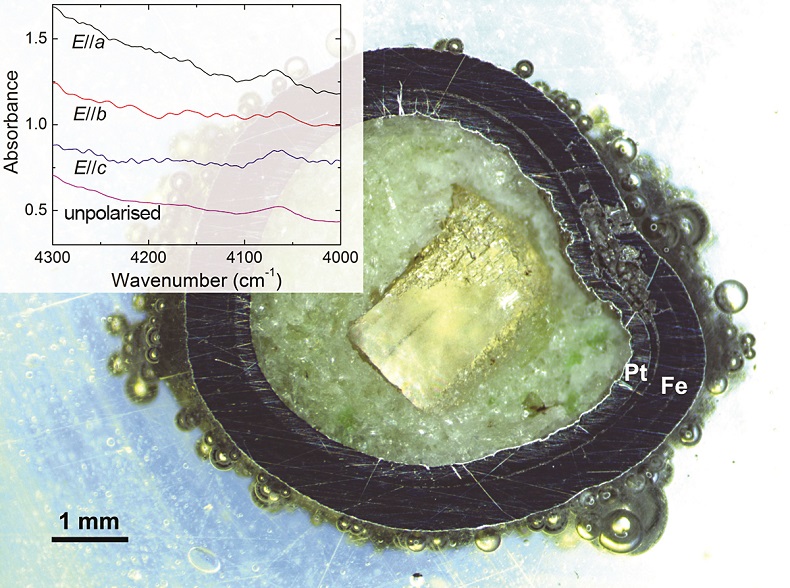
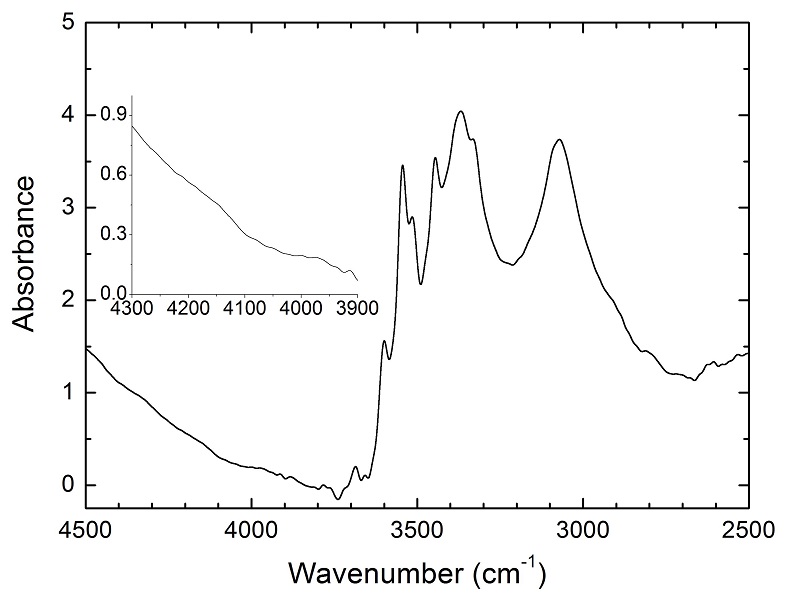
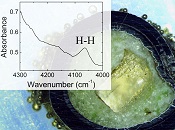
Figure 1 Recovered orthopyroxene crystal annealed at 2 GPa and 1100 °C and polarised and unpolarised FTIR spectra of the crystal containing molecular H2. The spectra were normalised to 1 cm thickness and vertically offset. The crystal was surrounded by fine powder of a spinel peridotite of broadly equilibrium composition (e.g., with similar composition between the crystal and orthopyroxene in the peridotite). The capsule was embedded in epoxy resin, and the crystal remained nearly intact after the run.
Polarised FTIR determinations on an opx sample along the a, b and c axes show that the absorption of H2 is anisotropic, with stronger absorbance along a and c than along b axes (Fig. 1). This confirms that H2 is actually physically dissolved in the crystal lattice. It is known from previous studies on glasses that the interaction with the surrounding silicate matrix can produce an induced dipole in the H2 molecule, which makes it slightly infrared active (Shelby, 1994
Shelby, J.E. (1994) Protonic species in vitreous silica. Journal of Non-crystalline Solids 179, 137-147.
; Schmidt and Holtz, 1998Schmidt, B.C., Holtz, F.M. (1998) Incorporation of H2 in vitreous silica, qualitative and quantitative determination from Raman and infrared spectroscopy. Journal of Non-crystalline Solids 240, 91-103.
; Hirschmann et al., 2012Hirschmann, M.M., Withers, A.C., Ardia, P., Foley, N.T. (2012) Solubility of molecular hydrogen in silicate melts and consequences for volatile evolution of terrestrial planets. Earth and Planetary Science Letters 345-348, 38-48.
). The H2 frequency observed in this study is lower than in silicate glasses by 30-70 cm-1 (4105-4140 cm-1), which in turn is ~50 cm-1 lower than in vapour (Shelby, 1994Shelby, J.E. (1994) Protonic species in vitreous silica. Journal of Non-crystalline Solids 179, 137-147.
; Schmidt and Holtz, 1998Schmidt, B.C., Holtz, F.M. (1998) Incorporation of H2 in vitreous silica, qualitative and quantitative determination from Raman and infrared spectroscopy. Journal of Non-crystalline Solids 240, 91-103.
; Hirschmann et al., 2012Hirschmann, M.M., Withers, A.C., Ardia, P., Foley, N.T. (2012) Solubility of molecular hydrogen in silicate melts and consequences for volatile evolution of terrestrial planets. Earth and Planetary Science Letters 345-348, 38-48.
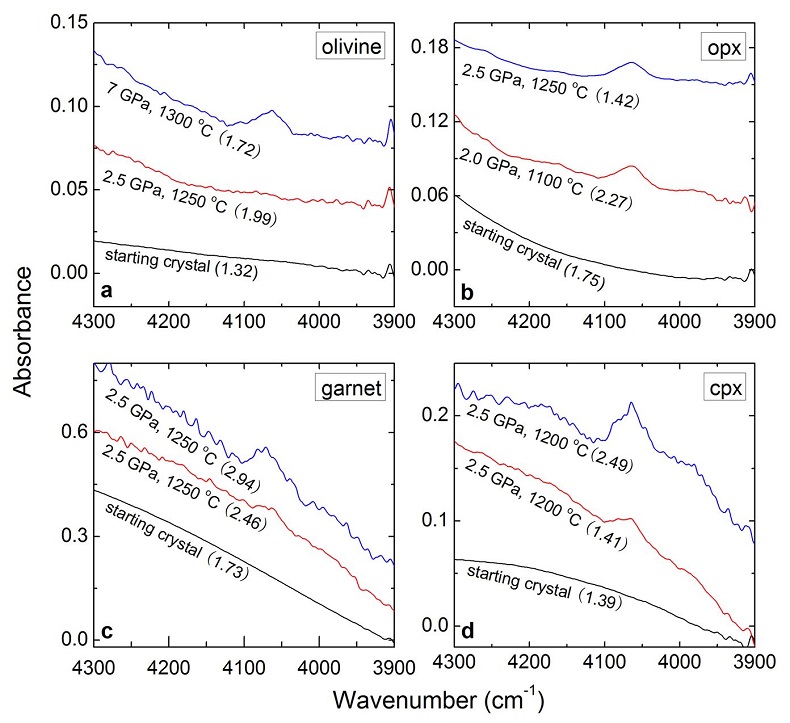
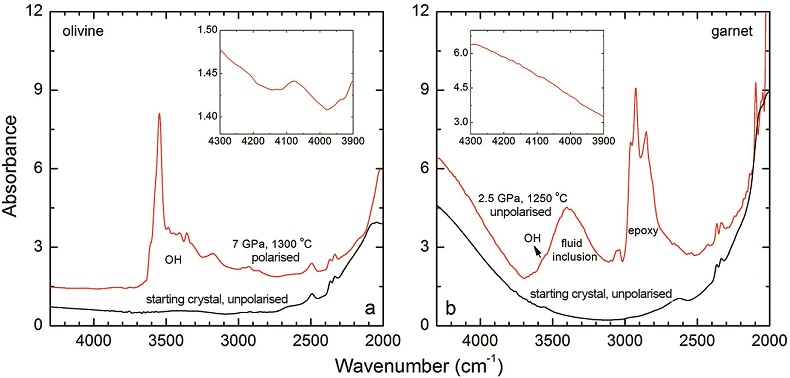
). The peak of H2 in olivine is not obvious at 2.5 GPa and 1250 °C, unlike for opx, cpx and garnet, but is markedly enhanced at 7 GPa and 1300 °C (Fig. 2). This suggests a profound role of pressure on H2 dissolution in silicate minerals, similar to that observed for silicate glasses (Hirschmann et al., 2012Hirschmann, M.M., Withers, A.C., Ardia, P., Foley, N.T. (2012) Solubility of molecular hydrogen in silicate melts and consequences for volatile evolution of terrestrial planets. Earth and Planetary Science Letters 345-348, 38-48.
). For the same annealed cpx or garnet sample, the intensity of the H2 peak, i.e. either the linear or integral absorbance, decreases with crystal thickness upon further polishing (Table 1 and Fig. 2c-d), as expected by the Beer-Lambert Law. However, the garnet sample shows much stronger absorbance at a greater thickness, which may be due to a zoned H distribution in the crystal or some loss of H2 during the polishing process.
Figure 2 Unpolarised FTIR spectra of (a) olivine, (b) orthopyroxene, (c) garnet, and (d) clinopyroxene containing dissolved molecular H2. Experimental conditions are given below each spectrum; numbers in parentheses are the thickness (mm) of the polished crystal. The spectra were not normalised to constant thickness, but vertically offset. The two spectra for either the annealed (c) garnet or (d) clinopyroxene were measured on the same recovered crystal after polishing to different thickness.
Quantification of H2 in these samples is not easy; methods such as ion microprobe (SIMS) are unsuitable, as SIMS can only measure the total H content, including the contribution from OH. To quantify H2, we therefore carried out two-stage annealing experiments on an opx crystal (see Supplementary Information). The crystal was first annealed in H2 and then re-annealed at high fO2 to convert the dissolved H2 into OH; the increased OH absorbance was measured by FTIR and converted into water contents. Blank experiments confirmed the reliability of the method. This yields absorption coefficients for polarised FTIR measurements of H2 in opx of ~4.63 ppm-1 H2O cm-2 for the integral intensity and of ~0.13 ppm-1 H2O cm-1 for the linear intensity, where the concentration of dissolved H2 is expressed as the equivalent form of H2O. By applying these values together with an orientation factor of 1/3 to the unpolarised spectra, H2 contents in the samples can be estimated. The use of the same extinction coefficient for different minerals is justified, since the position and shape of the H2 band is virtually the same. Observed hydrogen contents are mostly ~15-40 ppm H2O. The data for olivine clearly show that hydrogen solubility increases with pressure, as expected from the increase of hydrogen fugacity. Moreover, the hydrogen contents given in Table 1 should be considered as minimum values. This is because the hydrogen contents are so small that it is conceivable that in the two-stage calibration runs, not all the H2O produced by oxidation of H2 was re-dissolved in the crystal; some may remain adsorbed on the surface. This could lead to some systematic underestimation of hydrogen solubility. Only for reference, Table 1 also contains hydrogen contents calculated using the linear calibration coefficient for H2 in SiO2 glass (Shelby, 1994
Shelby, J.E. (1994) Protonic species in vitreous silica. Journal of Non-crystalline Solids 179, 137-147.
). This would yield numbers higher by a factor of ~100. However, the position of the H2 peak differs between SiO2 glass and minerals, and accordingly, the extinction coefficient is likely also different.Additional evidence for an appreciable solubility of H2 in mantle minerals comes from two recent studies. At otherwise similar conditions (1.5 GPa and 1200 °C), the OH solubility of olivine measured by FTIR is ~50 % lower for experiments buffered by Fe-FeO than by the more oxidising Ni-NiO buffer (Yang, 2016
Yang, X. (2016) Effect of oxygen fugacity on OH dissolution in olivine under peridotite-saturated conditions: an experimental study at 1.5-7 GPa and 1100-1300 °C. Geochimica et Cosmochimica Acta 173, 319-336.
). This may reflect the higher water fugacity at Ni-NiO buffer conditions, where the fluid consists of nearly pure water, while at the Fe-FeO buffer, the fluid consists of a mixture of H2O and H2 in comparable molar fractions (Yang, 2016Yang, X. (2016) Effect of oxygen fugacity on OH dissolution in olivine under peridotite-saturated conditions: an experimental study at 1.5-7 GPa and 1100-1300 °C. Geochimica et Cosmochimica Acta 173, 319-336.
). However, SIMS measurements that measure total H (i.e. OH + H2) found only a reduction of bulk hydrogen contents of ~5 % in the Fe-FeO as compared to the Ni-NiO buffer runs (Gaetani et al., 2014Gaetani, G.A., O'Leary, J.A., Koga, K.T., Hauri, E.H., Rose-Koga, E.F., Monteleone, B.D. (2014) Hydration of mantle olivine under variable water and oxygen fugacity conditions. Contributions to Mineralogy and Petrology 167, 968, doi: 910.1007/s00410-00014-00965-y.
). This would be consistent with a significant dissolution of H2 in the sample under reducing conditions, which nearly compensated for the decrease in OH content.top
Discussion
The solubility of H2 measured in this study is about one order of magnitude lower than the water/OH solubility in minerals under comparable conditions (Keppler and Smyth, 2006
Keppler, H., Smyth, J.R. (2006) Water in Nominally Anhydrous Minerals. Mineralogical Society of America, Washington DC., USA, 478 pp.
). However, the observed solubility is not small on a planetary scale. While the measured contents are only ~15-40 ppm of H2O (Table 1), they will increase with pressure and hydrogen fugacity in the deeper mantle so that solubilities of hundreds of ppm should easily be achievable at higher pressures. 100 ppm of H2O in the bulk mantle would already be equivalent to 0.3 ocean masses. The data in Table 1 suggest that the H2 solubility in minerals of very different structure and composition is quite similar. This is in line with the observation that the peak of H2 in the FTIR spectra is always at the same position, irrespective of structural details. Very likely, H2 does not substitute on a specific cation/anion site, but due to its small size, it fills interstitial positions. This would imply a broadly similar mechanism of H2 dissolution in all silicate minerals of the entire mantle.Current models of the origin of water on Earth usually assume that hydrogen was contained in the chondritic material from which Earth accreted, with a possible contribution from icy objects that formed beyond the snow line in the outer solar system and were later scattered inward (Morbidelli et al., 2000
Morbidelli, A., Chambers, J., Lunine, J.I., Petit, J.M., Robert, F., Valsecchi, G.B., Cyr, K.E. (2000) Source regions and timescales for the delivery of water to the Earth. Meteoritics & Planetary Science 35, 1309-1320.
; Marty and Yokochi, 2006Marty, B., Yokochi, R. (2006) Water in the Early Earth. Reviews in Mineralogy and Geochemistry 62, 421-450.
; Rubie et al., 2011Rubie, D.C., Frost, D.J., Mann, U., Asahara, Y., Nimmo, F., Tsuno, K., Kegler, P., Holzheid, A., Palme, H. (2011) Heterogeneous accretion, composition and core-mantle differentiation of the Earth. Earth and Planetary Science Letters 301, 31-42.
; Marty, 2012Marty, B. (2012) The origins and concentrations of water, carbon, nitrogen and noble gases on Earth. Earth and Planetary Science Letters 313-314, 56-66.
). Such models necessarily imply that planets formed close to the sun are relatively dry, compared to those formed at larger heliocentric distances. The observation of significant solubility of H2 in mantle minerals of this study suggests that some of the hydrogen on Earth could also have been sequestered directly from the solar nebula, in agreement with the recent discovery of a component with very low D/H ratio in the deep mantle (Hallis et al., 2015Hallis, L.J., Huss, G.R., Nagashima, K., Taylor, G.J., Halldórsson, S.A., Hilton, D.R., Mottl, M.J., Meech, K.J. (2015) Evidence for primordial water in Earth's deep mantle. Science 350, 795-797.
). Hydrogen from a dense nebular atmosphere (Ikoma and Genda, 2006Ikoma, M., Genda, H. (2006) Constraints on the mass of a habitable planet with water of nebular origin. Astrophysical Journal 648, 696-706.
; Genda and Ikoma, 2008Genda, H., Ikoma, M. (2008) Origin of the ocean on the Earth: early evolution of water D/H in a hydrogen-rich atmosphere. Icarus 194, 42-52.
) could have first dissolved in the magma ocean (Hirschmann et al., 2012Hirschmann, M.M., Withers, A.C., Ardia, P., Foley, N.T. (2012) Solubility of molecular hydrogen in silicate melts and consequences for volatile evolution of terrestrial planets. Earth and Planetary Science Letters 345-348, 38-48.
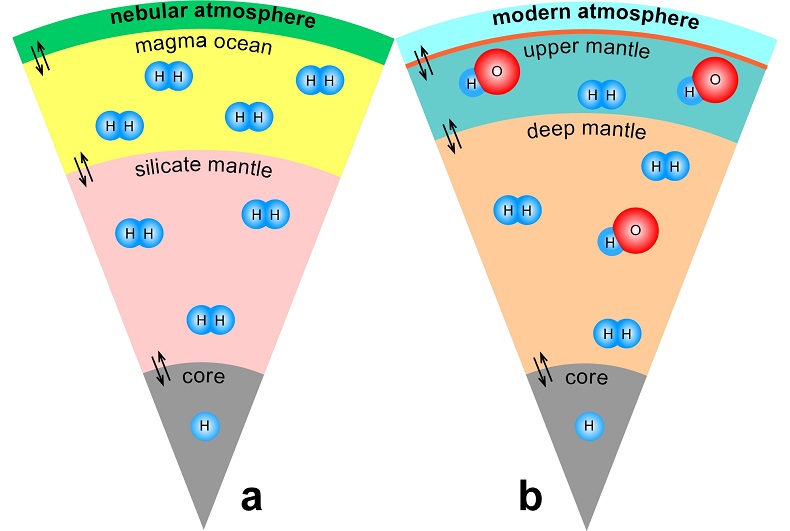
) and then have been trapped in the silicate minerals of the mantle (Fig. 3a). Such a mechanism would allow sequestration of hydrogen into a planet at any heliocentric distance, implying that planets close to the sun do not necessarily have to be poor in hydrogen.
Figure 3 Schematic illustration of water storage (a) in the early mantle during the magma ocean stage and (b) in the modern mantle (not to scale). In the early Earth, where highly reducing conditions were prevailing, H2 might have been distributed between different reservoirs through equilibrium partitioning. In the modern Earth, where plate tectonics and mantle redox stratification are present, hydrogen in the oxidised shallow upper mantle is mostly dissolved in minerals as OH groups, while significant amounts of H2 are likely still present in the deep reduced mantle.
Mantle plumes reaching down to the lowermost mantle are believed to be the source of ocean island basalts (McKenzie and O’Nions, 1995
McKenzie, D., O'Nions, R.K. (1995) The source regions of ocean island basalts. Journal of Petrology 36, 133-159.
; French and Romanowicz, 2015French, S.W., Romanowicz, B. (2015) Broad plumes rooted at the base of the Earth's mantle beneath major hotspots. Nature 525, 95-99.
). There is ample evidence showing that this deep mantle source is also a major reservoir of volatiles (Dixon et al., 2002Dixon, J.E., Leist, L., Langmuir, C.H., Schilling, J.G. (2002) Recycled dehydrated lithosphere observed in plume-influenced mid-ocean-ridge basalt. Nature 420, 385-389.
; Saal et al., 2002Saal, A.E., Hauri, E.H., Langmuir, C.H., Perfit, M.R. (2002) Vapor undersaturation in primitive mid-ocean-ridge basalt and the volatile content of Earth's upper mantle. Nature 419, 451-455.
), with hydrogen contents that are several times higher than in the MORB source of the upper mantle. This observation is, however, in striking contrast to experimental data, which show that (Fe,Mg)O ferropericlase and (Mg,Fe)SiO3 bridgmanite, the main minerals of the lower mantle, may dissolve at most a few ppm of OH in their structure (Bolfan-Casanova et al., 2000Bolfan-Casanova, N., Keppler, H., Rubie, D.C. (2000) Water partitioning between nominally anhydrous minerals in the MgO-SiO2-H2O system up to 24 GPa: implications for the distribution of water in the Earth's mantle. Earth and Planetary Science Letters 182, 209-221.
, 2002Bolfan-Casanova, N., Mackwell, S., Keppler, H., McCammon, C., Rubie, D.C. (2002) Pressure dependence of H solubility in magnesiowüstite up to 25 GPa: implications for the storage of water in the Earth's lower mantle. Geophysical Research Letters 29, 1029-1032.
, 2003Bolfan-Casanova, N., Keppler, H., Rubie, D.C. (2003) Water partitioning at 660 km depth and evidence for very low water solubility in magnesium silicate perovskite. Geophysical Research Letters 30, 1905, doi: 10.1029/2003GL017182.
; Panero et al., 2015Panero, W.R., Pigott, J.S., Reaman, D.M., Kabbes, J.E., Liu, Z. (2015) Dry (Mg,Fe)SiO3 perovskite in the Earth's lower mantle. Journal of Geophysical Research 120, 894-908.
). The presence of some H2 in the lattice of these two minerals could easily reconcile these observations (Fig. 3b). Upon upwelling from the lower mantle, fO2 changes (Frost and McCammon, 2008Frost, D.J., McCammon, C.A. (2008) The redox state of the Earth's mantle. Annual Review of Earth and Planetary Sciences 36, 389-420.
), partially due to the phase change from bridgmanite, which stabilises Fe3+, to upper mantle minerals that mainly incorporate Fe2+. Accordingly, molecular H2 stored in the lower mantle may be converted to H2O or OH during the ascent of the mantle plume (H2 + Fe2O3 = H2O + 2FeO). It therefore appears that not only the deep cycle of carbon, but also the deep hydrogen cycle may be strongly coupled to the redox state of the mantle. Similar to carbon (Stagno et al., 2013Stagno, V., Ojwang, D.O., McCammon, C.A., Frost, D.J. (2013) The oxidation state of the mantle and the extraction of carbon from Earth's interior. Nature 493, 84-88.
), the oxidation of H2 to H2O could also trigger partial melting, since H2O is much more soluble in silicate melts than H2 (Hirschmann et al., 2012Hirschmann, M.M., Withers, A.C., Ardia, P., Foley, N.T. (2012) Solubility of molecular hydrogen in silicate melts and consequences for volatile evolution of terrestrial planets. Earth and Planetary Science Letters 345-348, 38-48.
).top
Acknowledgements
Comments by Fabrice Gaillard and one anonymous reviewer helped to improve the manuscript. This work was supported by grants to X.Y. from the National Basic Research Program of China (2014CB845904), the National Science Foundation of China (41590622 and 41372041), the Recruitment Program of Global Young Experts (China), and partly the Bayerisches Geoinstitut Visitors Program.
Editor: Bruce Watson
top
References
Bell, D.R., Rossman, G.R. (1992) Water in Earth's mantle: the role of nominally anhydrous minerals. Science 255, 1391-1397.
 Show in context
 The formation of OH defects in nominally anhydrous minerals (Bell and Rossman, 1992; Keppler and Smyth, 2006) requires a sufficiently high oxygen fugacity, ƒO2, to oxidise hydrogen to molecular H2O or OH groups.
View in article
Bolfan-Casanova, N., Keppler, H., Rubie, D.C. (2000) Water partitioning between nominally anhydrous minerals in the MgO-SiO2-H2O system up to 24 GPa: implications for the distribution of water in the Earth's mantle. Earth and Planetary Science Letters 182, 209-221.
Show in context This observation is, however, in striking contrast to experimental data, which show that (Fe,Mg)O ferropericlase and (Mg,Fe)SiO3 bridgmanite, the main minerals of the lower mantle, may dissolve at most a few ppm of OH in their structure (Bolfan-Casanova et al., 2000, 2002, 2003; Panero et al., 2015).
View in article
Bolfan-Casanova, N., Mackwell, S., Keppler, H., McCammon, C., Rubie, D.C. (2002) Pressure dependence of H solubility in magnesiowüstite up to 25 GPa: implications for the storage of water in the Earth's lower mantle. Geophysical Research Letters 29, 1029-1032.
Show in contextThis observation is, however, in striking contrast to experimental data, which show that (Fe,Mg)O ferropericlase and (Mg,Fe)SiO3 bridgmanite, the main minerals of the lower mantle, may dissolve at most a few ppm of OH in their structure (Bolfan-Casanova et al., 2000, 2002, 2003; Panero et al., 2015).
View in article
Bolfan-Casanova, N., Keppler, H., Rubie, D.C. (2003) Water partitioning at 660 km depth and evidence for very low water solubility in magnesium silicate perovskite. Geophysical Research Letters 30, 1905, doi: 10.1029/2003GL017182.
Show in contextThis observation is, however, in striking contrast to experimental data, which show that (Fe,Mg)O ferropericlase and (Mg,Fe)SiO3 bridgmanite, the main minerals of the lower mantle, may dissolve at most a few ppm of OH in their structure (Bolfan-Casanova et al., 2000, 2002, 2003; Panero et al., 2015).
View in article
Dixon, J.E., Leist, L., Langmuir, C.H., Schilling, J.G. (2002) Recycled dehydrated lithosphere observed in plume-influenced mid-ocean-ridge basalt. Nature 420, 385-389.
Show in context There is ample evidence showing that this deep mantle source is also a major reservoir of volatiles (Dixon et al., 2002; Saal et al., 2002), with hydrogen contents that are several times higher than in the MORB source of the upper mantle.
View in article
French, S.W., Romanowicz, B. (2015) Broad plumes rooted at the base of the Earth's mantle beneath major hotspots. Nature 525, 95-99.
Show in context Mantle plumes reaching down to the lowermost mantle are believed to be the source of ocean island basalts (McKenzie and O’Nions, 1995; French and Romanowicz, 2015).
View in article
Frost, D.J., McCammon, C.A. (2008) The redox state of the Earth's mantle. Annual Review of Earth and Planetary Sciences 36, 389-420.
Show in context However, highly reducing conditions may prevail deep in the modern Earth (Frost and McCammon, 2008), as well as on the Moon and on Mars (Wadhwa, 2008).
View in article
Upon upwelling from the lower mantle, ƒO2 changes (Frost and McCammon, 2008), partially due to the phase change from bridgmanite, which stabilises Fe3+, to upper mantle minerals that mainly incorporate Fe2+.
View in article
Gaetani, G.A., O'Leary, J.A., Koga, K.T., Hauri, E.H., Rose-Koga, E.F., Monteleone, B.D. (2014) Hydration of mantle olivine under variable water and oxygen fugacity conditions. Contributions to Mineralogy and Petrology 167, 968, doi: 910.1007/s00410-00014-00965-y.
Show in contextHowever, SIMS measurements that measure total H (i.e. OH + H2) found only a reduction of bulk hydrogen contents of ~5 % in the Fe-FeO as compared to the Ni-NiO buffer runs (Gaetani et al., 2014).
View in article
Genda, H., Ikoma, M. (2008) Origin of the ocean on the Earth: early evolution of water D/H in a hydrogen-rich atmosphere. Icarus 194, 42-52.
Show in context Hydrogen from a dense nebular atmosphere (Ikoma and Genda, 2006; Genda and Ikoma, 2008) could have first dissolved in the magma ocean (Hirschmann et al., 2012) and then have been trapped in the silicate minerals of the mantle (Fig. 3a).
View in article
Hallis, L.J., Huss, G.R., Nagashima, K., Taylor, G.J., Halldórsson, S.A., Hilton, D.R., Mottl, M.J., Meech, K.J. (2015) Evidence for primordial water in Earth's deep mantle. Science 350, 795-797.
Show in context The observation of significant solubility of H2 in mantle minerals of this study suggests that some of the hydrogen on Earth could also have been sequestered directly from the solar nebula, in agreement with the recent discovery of a component with very low D/H ratio in the deep mantle (Hallis et al., 2015).
View in article
Hirschmann, M.M., Withers, A.C., Ardia, P., Foley, N.T. (2012) Solubility of molecular hydrogen in silicate melts and consequences for volatile evolution of terrestrial planets. Earth and Planetary Science Letters 345-348, 38-48.
Show in contextIt is known from previous studies on glasses that the interaction with the surrounding silicate matrix can produce an induced dipole in the H2 molecule, which makes it slightly infrared active (Shelby, 1994; Schmidt and Holtz, 1998; Hirschmann et al., 2012).
View in article
The H2 frequency observed in this study is lower than in silicate glasses by 30-70 cm-1 (4105-4140 cm-1), which in turn is ~50 cm-1 lower than in vapour (Shelby, 1994; Schmidt and Holtz, 1998; Hirschmann et al., 2012).
View in article
This suggests a profound role of pressure on H2 dissolution in silicate minerals, similar to that observed for silicate glasses (Hirschmann et al., 2012).
View in article
Hydrogen from a dense nebular atmosphere (Ikoma and Genda, 2006; Genda and Ikoma, 2008) could have first dissolved in the magma ocean (Hirschmann et al., 2012) and then have been trapped in the silicate minerals of the mantle (Fig. 3a).
View in article
Similar to carbon (Stagno et al., 2013), the oxidation of H2 to H2O could also trigger partial melting, since H2O is much more soluble in silicate melts than H2 (Hirschmann et al., 2012).
View in article
Ikoma, M., Genda, H. (2006) Constraints on the mass of a habitable planet with water of nebular origin. Astrophysical Journal 648, 696-706.
Show in context Hydrogen from a dense nebular atmosphere (Ikoma and Genda, 2006; Genda and Ikoma, 2008) could have first dissolved in the magma ocean (Hirschmann et al., 2012) and then have been trapped in the silicate minerals of the mantle (Fig. 3a).
View in article
Keppler, H., Smyth, J.R. (2006) Water in Nominally Anhydrous Minerals. Mineralogical Society of America, Washington DC., USA, 478 pp.
Show in contextThe formation of OH defects in nominally anhydrous minerals (Bell and Rossman, 1992; Keppler and Smyth, 2006) requires a sufficiently high oxygen fugacity, ƒO2, to oxidise hydrogen to molecular H2O or OH groups.
View in article
The solubility of H2 measured in this study is about one order of magnitude lower than the water/OH solubility in minerals under comparable conditions (Keppler and Smyth, 2006).
View in article
Marty, B. (2012) The origins and concentrations of water, carbon, nitrogen and noble gases on Earth. Earth and Planetary Science Letters 313-314, 56-66.
Show in contextCurrent models of the origin of water on Earth usually assume that hydrogen was contained in the chondritic material from which Earth accreted, with a possible contribution from icy objects that formed beyond the snow line in the outer solar system and were later scattered inward (Morbidelli et al., 2000; Marty and Yokochi, 2006; Rubie et al., 2011; Marty, 2012).
View in article
Marty, B., Yokochi, R. (2006) Water in the Early Earth. Reviews in Mineralogy and Geochemistry 62, 421-450.
Show in context Current models of the origin of water on Earth usually assume that hydrogen was contained in the chondritic material from which Earth accreted, with a possible contribution from icy objects that formed beyond the snow line in the outer solar system and were later scattered inward (Morbidelli et al., 2000; Marty and Yokochi, 2006; Rubie et al., 2011; Marty, 2012).
View in article
McKenzie, D., O'Nions, R.K. (1995) The source regions of ocean island basalts. Journal of Petrology 36, 133-159.
Show in context Mantle plumes reaching down to the lowermost mantle are believed to be the source of ocean island basalts (McKenzie and O’Nions, 1995; French and Romanowicz, 2015).
View in article
Mierdel, K., Keppler, H., Smyth, J.R., Langenhorst, F. (2007) Water solubility in aluminous orthopyroxene and the origin of Earth's asthenosphere. Science 315, 364-368.
Show in contextThe presence of hydrogen in the silicate mantle is a key parameter in influencing Earth’s climate, habitability, and geochemical evolution; without some hydrogen in the mantle, plate tectonics would likely not exist on Earth (Regenauer-Lieb et al., 2001; Mierdel et al., 2007).
View in article
Morbidelli, A., Chambers, J., Lunine, J.I., Petit, J.M., Robert, F., Valsecchi, G.B., Cyr, K.E. (2000) Source regions and timescales for the delivery of water to the Earth. Meteoritics & Planetary Science 35, 1309-1320.
Show in context Current models of the origin of water on Earth usually assume that hydrogen was contained in the chondritic material from which Earth accreted, with a possible contribution from icy objects that formed beyond the snow line in the outer solar system and were later scattered inward (Morbidelli et al., 2000; Marty and Yokochi, 2006; Rubie et al., 2011; Marty, 2012).
View in article
Panero, W.R., Pigott, J.S., Reaman, D.M., Kabbes, J.E., Liu, Z. (2015) Dry (Mg,Fe)SiO3 perovskite in the Earth's lower mantle. Journal of Geophysical Research 120, 894-908.
Show in contextThis observation is, however, in striking contrast to experimental data, which show that (Fe,Mg)O ferropericlase and (Mg,Fe)SiO3 bridgmanite, the main minerals of the lower mantle, may dissolve at most a few ppm of OH in their structure (Bolfan-Casanova et al., 2000, 2002, 2003; Panero et al., 2015).
View in article
Parman, S.W., Kurz, M.D., Hart, S.R., Grove, T.L. (2005) Helium solubility in olivine and implications for high 3He/4He in ocean island basalts. Nature 437, 1140-1143.
Show in context This does not appear implausible from available data on He solubility in olivine (Parman et al., 2005).
View in article
Regenauer-Lieb, K., Yuen, D.A., Branlund, J. (2001) The initiation of subduction: criticality by addition of water? Science 294, 578-580.
Show in contextThe presence of hydrogen in the silicate mantle is a key parameter in influencing Earth’s climate, habitability, and geochemical evolution; without some hydrogen in the mantle, plate tectonics would likely not exist on Earth (Regenauer-Lieb et al., 2001; Mierdel et al., 2007).
View in article
Rubie, D.C., Frost, D.J., Mann, U., Asahara, Y., Nimmo, F., Tsuno, K., Kegler, P., Holzheid, A., Palme, H. (2011) Heterogeneous accretion, composition and core-mantle differentiation of the Earth. Earth and Planetary Science Letters 301, 31-42.
Show in context The early Earth (Yang et al., 2014), especially during its early accretion (Rubie et al., 2011), was likely extremely reduced, with ƒO2 far below the Fe-FeO buffer.
View in article
Current models of the origin of water on Earth usually assume that hydrogen was contained in the chondritic material from which Earth accreted, with a possible contribution from icy objects that formed beyond the snow line in the outer solar system and were later scattered inward (Morbidelli et al., 2000; Marty and Yokochi, 2006; Rubie et al., 2011; Marty, 2012).
View in article
Saal, A.E., Hauri, E.H., Langmuir, C.H., Perfit, M.R. (2002) Vapor undersaturation in primitive mid-ocean-ridge basalt and the volatile content of Earth's upper mantle. Nature 419, 451-455.
Show in context There is ample evidence showing that this deep mantle source is also a major reservoir of volatiles (Dixon et al., 2002; Saal et al., 2002), with hydrogen contents that are several times higher than in the MORB source of the upper mantle.
View in article
Schmidt, B.C., Holtz, F.M. (1998) Incorporation of H2 in vitreous silica, qualitative and quantitative determination from Raman and infrared spectroscopy. Journal of Non-crystalline Solids 240, 91-103.
Show in contextIt is known from previous studies on glasses that the interaction with the surrounding silicate matrix can produce an induced dipole in the H2 molecule, which makes it slightly infrared active (Shelby, 1994; Schmidt and Holtz, 1998; Hirschmann et al., 2012).
View in article
The H2 frequency observed in this study is lower than in silicate glasses by 30-70 cm-1 (4105-4140 cm-1), which in turn is ~50 cm-1 lower than in vapour (Shelby, 1994; Schmidt and Holtz, 1998; Hirschmann et al., 2012).
View in article
Shelby, J.E. (1994) Protonic species in vitreous silica. Journal of Non-crystalline Solids 179, 137-147.
Show in context Table 1 [...] d Estimated by the reported extinction coefficient of 0.26 L/mol .cm for SiO2 glass by Shelby (1994).
View in article
It is known from previous studies on glasses that the interaction with the surrounding silicate matrix can produce an induced dipole in the H2 molecule, which makes it slightly infrared active (Shelby, 1994; Schmidt and Holtz, 1998; Hirschmann et al., 2012).
View in article
The H2 frequency observed in this study is lower than in silicate glasses by 30-70 cm-1 (4105-4140 cm-1), which in turn is ~50 cm-1 lower than in vapour (Shelby, 1994; Schmidt and Holtz, 1998; Hirschmann et al., 2012).
View in article
Only for reference, Table 1 also contains hydrogen contents calculated using the linear calibration coefficient for H2 in SiO2 glass (Shelby, 1994).
View in article
Stagno, V., Ojwang, D.O., McCammon, C.A., Frost, D.J. (2013) The oxidation state of the mantle and the extraction of carbon from Earth's interior. Nature 493, 84-88.
Show in context Similar to carbon (Stagno et al., 2013), the oxidation of H2 to H2O could also trigger partial melting, since H2O is much more soluble in silicate melts than H2 (Hirschmann et al., 2012).
View in article
Wadhwa, M. (2008) Redox conditions on small bodies, the Moon and Mars. Reviews in Mineralogy and Geochemistry 68, 493-510.
Show in contextHowever, highly reducing conditions may prevail deep in the modern Earth (Frost and McCammon, 2008), as well as on the Moon and on Mars (Wadhwa, 2008).
View in article
Yang, X. (2016) Effect of oxygen fugacity on OH dissolution in olivine under peridotite-saturated conditions: an experimental study at 1.5-7 GPa and 1100-1300 °C. Geochimica et Cosmochimica Acta 173, 319-336.
Show in context Table 1 [...] For the opx crystal, the absorbance of unpolarised analysis is about 1/3 the total absorbance of polarised analyses, probably due to the orientation effect. ƒH2 is the calculated equilibrium H2 fugacity (see details in Yang, 2016).
View in article
At otherwise similar conditions (1.5 GPa and 1200 °C), the OH solubility of olivine measured by FTIR is ~50 % lower for experiments buffered by Fe-FeO than by the more oxidising Ni-NiO buffer (Yang, 2016).
View in article
This may reflect the higher water fugacity at Ni-NiO buffer conditions, where the fluid consists of nearly pure water, while at the Fe-FeO buffer, the fluid consists of a mixture of H2O and H2 in comparable molar fractions (Yang, 2016).
View in article
Yang, X., Gaillard, F., Scaillet, B. (2014) A relatively reduced Hadean continental crust and implications for the early atmosphere and crustal rheology. Earth and Planetary Science Letters 393, 210-219.
Show in contextThe early Earth (Yang et al., 2014), especially during its early accretion (Rubie et al., 2011), was likely extremely reduced, with ƒO2 far below the Fe-FeO buffer.
View in article
top
Supplementary Information
Additional Information and Methods
H2 dissolution
The starting materials were gem-quality single crystals of olivine from Liaohe (China), orthopyroxene from Kilosa (Tanzania), clinopyroxene from Siberia (Russia) and garnet from Same (Tanzania). The composition of each mineral is homogenous, as demonstrated by multi-points electron microprobe analyses, and the average data are given in Table S-1. Blocks of ~2 × 2 × 3 mm of these crystals were cut either with an orientation parallel to their crystallographic axes, as determined with an X-ray precession camera, or parallel to three random but orthogonal directions. H-annealing experiments were carried out at 2-2.5 GPa in an end-loaded piston-cylinder press, with 1.3 cm sample assemblies made of talc, Pyrex glass, graphite, pyrophyllite and crushable Al2O3. Experiments at 7 GPa were carried out in a Kawai-type multi-anvil apparatus, with 25/15 sample assemblies made of MgO, graphite, molybdenum and crushable ZrO2. For each experiment, the single crystal embedded in fine powder of the same mineral or of a spinel peridotite of broadly equilibrium composition, FeO + Fe and distilled water (~3-7 wt. % relative) were loaded into a capsule (Fe-capsule for piston-cylinder runs: OD 5.0 mm, ID 4.2 mm, length 10.0 mm – sealed by mechanical compression; PtRh5-capsule for multi-anvil runs: OD 3.7 mm, ID 3.2 mm, length 5.0 mm – sealed by arc-welding). Similar fO2 buffering techniques, frequently adopted in experimental studies, have been recently used in H-annealing studies of melts and olivine (e.g., Hirschman et al., 2012
Hirschmann, M.M., Withers, A.C., Ardia, P., Foley, N.T. (2012) Solubility of molecular hydrogen in silicate melts and consequences for volatile evolution of terrestrial planets. Earth and Planetary Science Letters 345-348, 38-48.
; Gaetani et al., 2014Gaetani, G.A., O'Leary, J.A., Koga, K.T., Hauri, E.H., Rose-Koga, E.F., Monteleone, B.D. (2014) Hydration of mantle olivine under variable water and oxygen fugacity conditions. Contributions to Mineralogy and Petrology 167, 968, doi: 910.1007/s00410-00014-00965-y.
; Yang, 2016Yang, X. (2016) Effect of oxygen fugacity on OH dissolution in olivine under peridotite-saturated conditions: an experimental study at 1.5-7 GPa and 1100-1300 °C. Geochimica et Cosmochimica Acta 173, 319-336.
). Because Fe-capsules may fracture during a rapid quenching at high pressure, a thin Pt-tube (OD 4.0 mm, ID 3.7 mm, length 8.0 mm) was placed inside to protect the crystal. Run durations were 16-24 hr. S-type and D-type thermocouples were used to monitor the temperature in the piston-cylinder and multi-anvil experiments, respectively. At the end of each run, the sample was quenched to room temperature by switching off the power to the heating circuit, and the pressure was slowly released over 15-23 hr to avoid significant cracking of the annealed crystals.Table S-1 Average composition of the starting minerals from microprobe analyses (wt. %).
| SiO2 | TiO2 | Al2O3 | Cr2O3 | FeO | MnO | MgO | CaO | Na2O | K2O | NiO | Total | |
| olivine | 39.89 | 0.01 | 0.01 | 0.04 | 8.63 | 0.13 | 50.38 | 0.03 | 0.07 | 0.03 | 0.46 | 99.66 |
| opx | 57.83 | 0.03 | 0.28 | 0.01 | 6.13 | 0.24 | 35.04 | 0.15 | 0.1 | 0.03 | 0.02 | 99.82 |
| cpx | 53.88 | 0.04 | 0.22 | 0.52 | 1.21 | 0.06 | 18.53 | 24.83 | 0.42 | 0.02 | 0.02 | 99.74 |
| garnet | 40.93 | 0.03 | 23.63 | 0.03 | 16.32 | 0.44 | 18.33 | 0.75 | 0.13 | 0.03 | <0.01 | 100.61 |
All Fe is reported as FeO.
Download in ExcelFluids were observed to bubble out of recovered and unfractured capsules upon piercing. Recovered capsules were embedded in epoxy resin at room temperature and doubly-polished until crystal surfaces were exposed. Usually, a slight change of crystal colour was observed, probably due to the reduction of Fe3+ by H2. The samples were then examined by a Bruker IFS120 FTIR spectrometer coupled with a Bruker IR microscope (tungsten source, CaF2 beam splitter, MCT detector, wire-strip polariser on KRS-5 substrate) or a Bruker Vertex 70V FTIR spectrometer coupled with a Hyperion 2000 microscope (globar source, KBr beam splitter, MCT detector, Zn-Se wire-grid polariser). To minimise diffusion loss of H2, the recovered samples were not subjected to any heating. Polishing and FTIR analyses were performed within 1 day upon completing the experiments. Typical analytical conditions were 100-2000 scans, an aperture size of 100 μm in diameter or a 100 × 100 μm rectangular aperture and a spectral resolution of 4 cm-1.
H2 quantification
To quantify H2 solubility in the samples, two-stage experiments were carried out on an oriented orthopyroxene (opx) crystal:
(1) The 1st stage H2 dissolution run: an opx crystal-block was H2-saturated at 2 GPa, 1100 °C and buffered by Fe-FeO, opx powder and distilled water with an Fe-capsule and a Pt-tube for 24 hr (similar to the above mentioned H2 dissolution experiments). H2 and OH groups in the H-annealed crystal were quantified by polarised FTIR measurements.
(2) The 2nd stage H2 oxidation run: the opx crystal H2-saturated in the 1st stage run was wrapped by Au foil, together with some dry Ag2O powder, and was annealed again at 2.5 GPa, 1200 °C and using Ni-BN-Pt capsules for 20 hr (Pt-capsule: OD 3.0 mm, ID 2.7 mm, length 5.0 mm; hexagonal BN-capsule: OD 4.2 mm, ID 3.0 mm, length 9.0 mm; Ni-capsule: OD 5.0 mm, ID 4.2 mm, length 10.0 mm). The Pt capsule was sealed by pulse arc welding, and BN and Ni capsules were mechanically sealed. At the experimental conditions, H2 reacted with Ag2O to yield H2O (H2 + Ag2O = 2Ag + H2O), which was then dissolved as OH in the opx crystal. OH groups in the recovered crystal were measured by polarised FTIR analyses.
The difference in the OH contents between the 2nd and 1st stage annealed opx crystals was used to quantify the amount of H2 dissolved in the crystal from the 1st stage run. However, the calibration could be affected by contamination with water adsorbed on surfaces. Moreover, the method assumes that all H2O produced by oxidisation of H2 is dissolved in the opx crystal; this is only possible if OH saturation is not reached. To address these issues, another two experiments under otherwise identical conditions as in the 2nd stage run were conducted with the starting opx crystal:
(1) Blank run: a crystal block was annealed with some dry Ag2O, and OH groups in the run product were measured by polarised FTIR analyses. The difference in the OH contents between the annealed and the starting opx crystal can be used to evaluate the potential effect of contamination in the 2nd stage run.
(2) Solubility run: a crystal block was annealed with distilled water, and OH groups in the run product were measured by polarised FTIR analyses. The yielded OH solubility can be used to evaluate if the OH content in the 2nd stage run reached water saturation.
Some precautions were taken to minimise contamination by water in both the 2nd stage and the blank run. All experimental materials, except the opx crystal, were preheated at 136 °C for 20 hr; after loading the materials, the open Pt capsules were stored in a room-temperature desiccator over drying agent for a whole day prior to welding, and during welding, subsequent assembling of various parts and the following compression, laboratory humidity was <20 %.
Concerning background corrections of the spectra, several reasonable baseline fittings in Gaussian or Lorentz forms were conducted to a representative spectrum, and the relative arbitrary uncertainty due to manual fitting was <3 %. The mineral-specific integral calibration coefficient, 15.6 ppm-1 H2O cm-2, reported for opx by Bell et al. (1995)
Bell, D.R., Ihinger, P.D., Rossman, G.R. (1995) Quantitative analysis of trace OH in garnet and pyroxenes. American Mineralogist 80, 465-474.
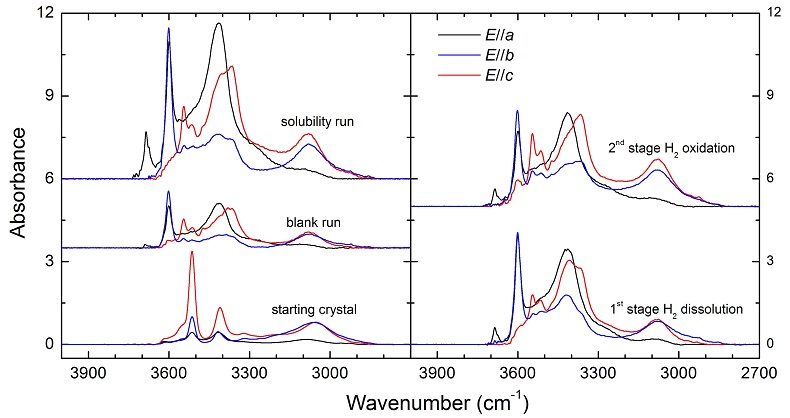
, was used to calculate the OH contents. Details of the experiments and OH contents in the samples are given in Table S-2, and polarised FTIR spectra of OH in the samples are illustrated in Figure S-1. The OH content of opx in the blank run is nearly the same as the starting crystal, 55 vs. 49 ppm H2O, and the OH content of opx in the 2nd stage run is less than the solubility, 160 vs. 197 ppm H2O. Therefore, the H2 peak in the 1st stage annealed opx corresponds to ~15 ppm H2O (or ~1.67 ppm H2):Eq. S-1
160 (2nd stage) - 138 (1st stage) - [55 (blank run) - 49 (starting crystal) ] = ~15
By applying this value to the determined absorbance along a, b and c axes, either the integral or linear absorbance, the following extinction coefficients can be obtained: ~4.63 ppm-1 H2O cm-2 for the integral extinction coefficient or ~0.13 ppm-1 H2O cm-1 for the linear extinction coefficient.
Table S-2 Experimental conditions and FTIR characterisation of OH in opx.
| P (GPa) | T (°C) | ƒO2 buffer | Duration (hr) | Capsule | ppm H2O | Notes | |
| starting | - | - | - | - | - | 49 | starting crystal |
| 1st stage run | 2 | 1100 | Fe-FeO | 24 | Fe | 138 | H2 dissolution |
| 2nd stage run | 2.5 | 1200 | - | 20 | Ni-BN-Pt-Au | 160 | H2 oxidation to OH |
| blank run | 2.5 | 1200 | - | 20 | Ni-BN-Pt-Au | 55 | evaluation of contamination |
| solubility run | 2.5 | 1200 | - | 20 | Ni-BN-Pt-Au | 197 | max-OH dissolution |

Figure S-1 Polarised FTIR spectra for the quantification of OH in orthopyroxene, including the starting crystal, the blank run, the solubility run, the 1st stage H2 dissolution run and the 2nd stage H2 oxidation run. All spectra were normalised to 1 cm thickness.

Figure S-2 Unpolarised FTIR spectrum of an orthopyroxene crystal H2-saturated at 2.5 GPa, 1250 °C and under very oxidising conditions buffered by Fe2O3-Fe3O4. The experiment was conducted using a Pt capsule (OD 5.0 mm, ID 4.6 mm, length 10.0 mm) for 24-hr duration. Because H2 in the system is negligible, a peak at ~4062 cm-1, if present, would definitely be caused by the overtones of OH. The spectrum was normalised to 1 cm thickness. Inset is an enlarged view of the spectrum at 4300-3900 cm-1, and no peak is observed ~4062 cm-1. Crystal thickness for the measurement is 1.31 mm.
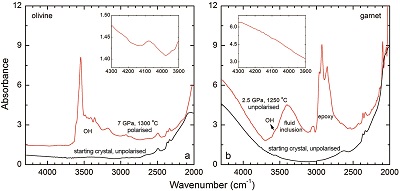
Figure S-3 FTIR spectra of a H2-saturated (a) olivine and (b) garnet under Fe-FeO buffered conditions. Spectra of the starting crystals in Figure 2 are also shown. If the peak at ~4062 cm-1 were caused by contamination of epoxy resin, crystals with significant IR bands due to epoxy resin (2750-3000 cm-1) would be characterised by a marked peak at ~4062 cm-1, and vice versa. The spectra were normalised to 1 cm thickness. Insets are the enlarged view of the spectra at 4300-3900 cm-1. The spectra are from unpolarised analyses except the spectrum of the annealed olivine, which was polarised parallel to a random direction. The annealed garnet crystal (2.08 mm thick) demonstrates strong absorption bands of epoxy resin at ~3000-2750 cm-1, but no absorption peaks are observed at ~4100-4000 cm-1; in contrast, the annealed olivine crystal (1.99 mm thick) has an apparent peak at ~4062 cm-1, but with negligible signals of epoxy resin. These data show that the ~4062 cm-1 band cannot be due to contamination.
Supplementary Information References
Bell, D.R., Ihinger, P.D., Rossman, G.R. (1995) Quantitative analysis of trace OH in garnet and pyroxenes. American Mineralogist 80, 465-474.
Show in context The mineral-specific integral calibration coefficient, 15.6 ppm-1 H2O cm-2, reported for opx by Bell et al. (1995), was used to calculate the OH contents.
View in Supplementary Information
Gaetani, G.A., O'Leary, J.A., Koga, K.T., Hauri, E.H., Rose-Koga, E.F., Monteleone, B.D. (2014) Hydration of mantle olivine under variable water and oxygen fugacity conditions. Contributions to Mineralogy and Petrology 167, 968, doi: 910.1007/s00410-00014-00965-y.
Show in contextSimilar ƒO2 buffering techniques, frequently adopted in experimental studies, have been recently used in H-annealing studies of melts and olivine (e.g., Hirschman et al., 2012; Gaetani et al., 2014; Yang, 2016).
View in Supplementary Information
Hirschmann, M.M., Withers, A.C., Ardia, P., Foley, N.T. (2012) Solubility of molecular hydrogen in silicate melts and consequences for volatile evolution of terrestrial planets. Earth and Planetary Science Letters 345-348, 38-48.
Show in contextSimilar ƒO2 buffering techniques, frequently adopted in experimental studies, have been recently used in H-annealing studies of melts and olivine (e.g., Hirschman et al., 2012; Gaetani et al., 2014; Yang, 2016).
View in Supplementary Information
Yang, X. (2016) Effect of oxygen fugacity on OH dissolution in olivine under peridotite-saturated conditions: an experimental study at 1.5-7 GPa and 1100-1300 °C. Geochimica et Cosmochimica Acta 173, 319-336.
Show in context Similar ƒO2 buffering techniques, frequently adopted in experimental studies, have been recently used in H-annealing studies of melts and olivine (e.g., Hirschman et al., 2012; Gaetani et al., 2014; Yang, 2016).
View in Supplementary Information