Pressure-induced ion pairing in MgSO4 solutions: Implications for the oceans of icy worlds
Affiliations | Corresponding Author | Cite as | Funding informationKeywords: water structure, ion association, pressure, Raman spectroscopy, planetary fluids
- Share this article


Article views:7,268Cumulative count of HTML views and PDF downloads.
- Download Citation
- Rights & Permissions
Abstract
Figures and Tables
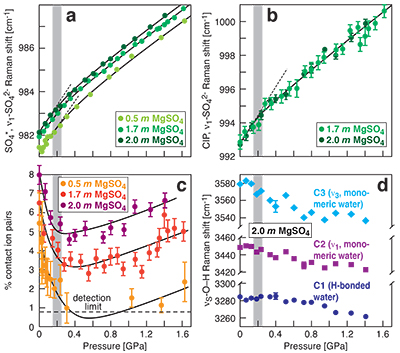 Figure 1 Raman spectroscopic results at 21 ± 1 °C as a function of pressure. The shadowed band is the pressure range of the LDW-HDW transition at about 20 °C (Fanetti et al., 2014). (a-b) Raman shift ω of the ν1-SO42- mode of the SO4* component (a) and of the CIP component (b). Dashed lines denote the (∂ω/∂P)T=21°C slopes in cm-1GPa-1 from linear fits of data at <0.17 GPa. (c) Percentage of contact ion-pairs as a function of pressure at 21 °C. (d) Raman shift of fitted band components in the νS-O–H region of the 2.0 molal MgSO4 solution. | 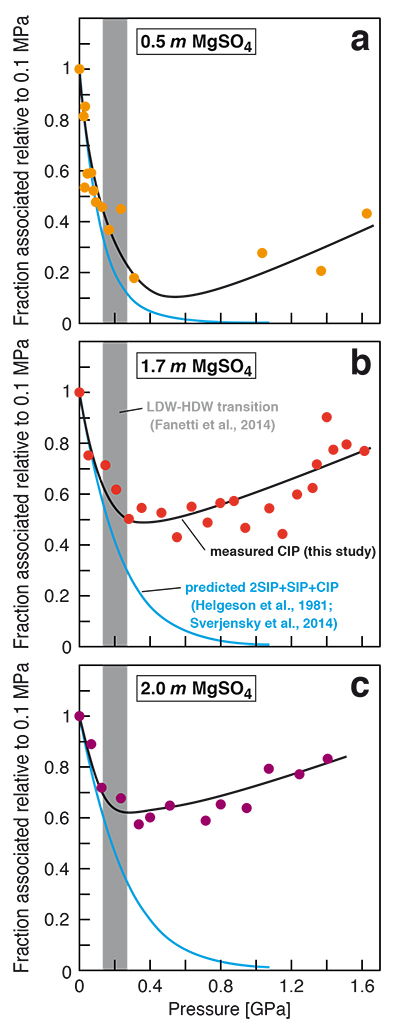 Figure 2 Fraction of MgSO4 associated at 21 ± 1 °C relative to that at ambient pressure, as determined by Raman spectroscopy and thermodynamic modelling, for 0.5 (a), 1.7 (b), and 2 molal solutions (c). Thick black lines are trend lines for the fraction of CIP from Raman spectroscopic data fit by eye. Blue lines denote the fraction of the sum of the CIP, SIP and 2SIP ion pairs calculated from a thermodynamic model based on the DEW model (Sverjensky et al., 2014) and the Helgeson-Kirkham-Flowers ion activity model (Helgeson et al., 1981). The comparison assumes that the proportionality between equilibrium constants associated with expelling separating H2O molecules is constant and independent of pressure. This assumption yields a minimum difference in predicted and observed CIP. The shadowed band is the pressure range of the LDW-HDW transition at about 20 °C (Fanetti et al., 2014). | 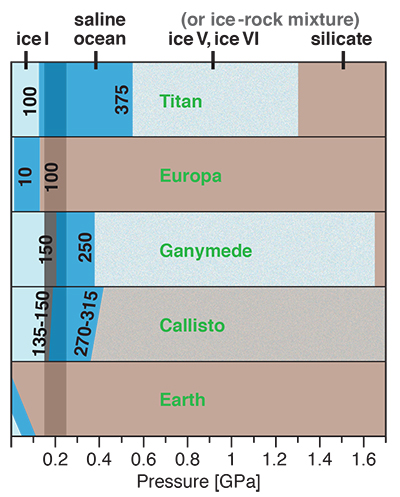 Figure 3 Comparison of models of the interiors of Titan (Tobie et al., 2012), Europa (Spohn and Schubert, 2003; Hand and Chyba, 2007; Valenti et al., 2012), Ganymede (Vance et al., 2014; Saur et al., 2015), and Callisto (Kuskov and Kronrod, 2005) with approximate depths of the subsurface ocean boundaries in km. The shadowed band is the pressure range of the LDW-HDW transition at about 20 °C (Fanetti et al., 2014). |
| Figure 1 | Figure 2 | Figure 3 |
Supplementary Figures and Tables
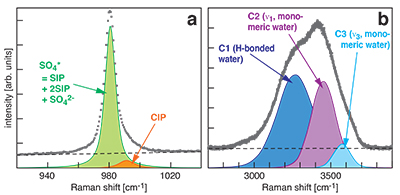 Figure S-1 Raman spectra of a 2.0 molal MgSO4 solution at 21 °C, 0.1 MPa. The fitted baselines are shown as dashed lines. (a) ν1-SO42- region, with two fitted band components assigned to CIP (contact ion pairs) and SO4* (including solvent-separated ion pairs (SIP, 2SIP) and unassociated SO42- ions). (b) O–H stretching region, with three fitted band components, C1 (mostly from hydrogen-bonded water), C2 (assigned to the symmetric stretching vibration, ν1, of H2O monomers), and C3 (assigned to the antisymmetric stretching vibration, ν3, of H2O monomers). | 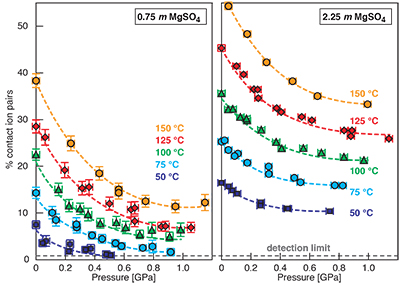 Figure S-2 Percentage of contact ion pairs in 0.75 and 2.25 molal MgSO4 solutions as a function of pressure along isotherms (dark blue, 50 °C; cyan, 75 °C; green, 100 °C; red, 125 °C; orange, 150 °C). Vertical error bars, 2 standard errors; horizontal error bars, uncertainty in the pressure obtained from the shift in the wavenumber of the 464 cm-1 Raman line of quartz. |
| Figure S-1 | Figure S-2 |
top
Introduction
The physical properties of liquid water at ambient temperature consistently display anomalous behaviour upon compression to densities of ~1.1 g cm-3. These include e.g., radial distribution functions from X-ray scattering (Okhulkov et al., 1994
Okhulkov, A.V., Demianets, Y.N., Gorbaty, Y.E. (1994) X-ray scattering in liquid water at pressures of up to 7.7 kbar: Test of a fluctuation model. Journal of Chemical Physics 100, 1578–1588.
) and neutron diffraction (Soper and Ricci, 2000Soper, A.K., Ricci, M.A. (2000) Structures of high-density and low-density water. Physical Review Letters 84, 2881–2884.
), a distinct anomaly in the high-frequency sound velocity from inelastic X-ray scattering experiments (Krisch et al., 2002Krisch, M., Loubeyre, P., Ruocco, G., Sette, F., Cunsolo, A., D’Astuto, M., LeToullec, R., Lorenzen, M., Mermet, A., Monaco, G., Verbeni, R. (2002) Pressure evolution of the high-frequency sound velocity in liquid water. Physical Review Letters 89, 125502.
), the Raman shift of the O–H stretching vibration (Kawamoto et al., 2004Kawamoto, T., Ochiai, S., Kagi, H. (2004) Changes in the structure of water deduced from the pressure dependence of the Raman OH frequency. Journal of Chemical Physics 120, 5867–5870.
), the sound velocity from Brillouin spectroscopy (Li et al., 2005Li, F., Cui, C.L., He, Z., Cui, T., Zhang, J., Zhou, Q., Zou, G.T., Sasaki, S. (2005) High pressure-temperature Brillouin study of liquid water: Evidence of the structural transition from low-density water to high-density water. Journal of Chemical Physics 123, 174511.
), and the isothermal compressibility (Mirwald, 2005Mirwald, P. (2005) Evidence of PVT anomaly boundaries of water at high pressure from compression and NaCl·2H2O dehydration experiments. Journal of Chemical Physics 123, 124715.
). The experiments indicate a transition from an open structure in low-density water (LDW) to a structure with a collapsed second coordination shell in high-density water (HDW) (Soper and Ricci, 2000Soper, A.K., Ricci, M.A. (2000) Structures of high-density and low-density water. Physical Review Letters 84, 2881–2884.
). Based on femtosecond infrared pump-probe spectroscopy on a D2O-H2O mixture, the LDW-HDW transition is at ~0.25 GPa at 273 K and ~0.2 GPa at 298 K, but not observed at 363 K (Fanetti et al., 2014Fanetti, S., Lapini, A., Paglai, M., Citroni, M., Di Donato, M., Scandolo, S., Righini, R., Bini, R. (2014) Structure and dynamics of low-density and high-density liquid water at high pressure. Journal of Physical Chemistry Letters 5, 235–240.
).Dissolved salts also disrupt the hydrogen-bonded dynamic H2O structure due to formation of hydration shells around the ions. It is not clear if, and by how much, the structure outside the first hydration shell is affected (Marcus, 2009
Marcus, Y. (2009) Effect of ions on the structure of water. Chemical Reviews 109, 1346–1370.
), but there is considerable evidence that the LDW-HDW transition persists in saline solutions even at fairly high solute concentrations (Mirwald, 2005Mirwald, P. (2005) Evidence of PVT anomaly boundaries of water at high pressure from compression and NaCl·2H2O dehydration experiments. Journal of Chemical Physics 123, 124715.
; Schmidt, 2009Schmidt, C. (2009) Raman spectroscopic study of a H2O + Na2SO4 solution at 21–600 °C and 0.1 MPa to 1.1 GPa: Relative differential ν1-SO42- Raman scattering cross sections and evidence of the liquid–liquid transition. Geochimica et Cosmochimica Acta 73, 425–437.
; Valenti et al., 2012Valenti, P., Bodnar, R.J., Schmidt, C. (2012) Experimental determination of H2O–NaCl liquidi to 25 mass% NaCl and 1.4 GPa: Application to the Jovian satellite Europa. Geochimica et Cosmochimica Acta 92, 117–128.
). However, the effects of the transition on solute-solute interactions have not been investigated. Here, we studied the pressure-dependent variation in contact ion pairing in MgSO4 solutions at 21 °C over a large range in pressure across the LDW-HDW transition until the sample solidified upon compression. We used MgSO4 solutions because they are thought to be important components of planetary oceans (Zolotov and Shock, 2001Zolotov, M.Y., Shock, E.L. (2001) Composition and stability of salts on the surface of Europa and their oceanic origin. Journal of Geophysical Research 106, 32815–32827.
) and because Raman scattering from the symmetric stretching vibration of sulphate (ν1-SO42-) provides direct information about the fraction of contact ion pairs.top
Compression-Enhanced Contact Ion Pairing
At all conditions, the Raman band shape in the ν1-SO42- region was accurately described using two Gaussian + Lorentzian components (Fig. S-1a). The higher wavenumber component is assigned to contact ion pairs Mg2+SO42-(aq) (CIP), and the lower wavenumber component, here designated SO4*, includes Raman-indistinguishable contributions from unassociated SO42-(aq) ions, solvent-shared ion pairs Mg2+(OH2)SO42-(aq) (SIP), and double solvent-separated ion pairs Mg2+(OH2)2SO42-(aq) (2SIP) (Rudolph et al., 2003
Rudolph, W.W., Irmer, G., Hefter, G.T. (2003) Raman spectroscopic investigation of speciation in MgSO4(aq). Physical Chemistry Chemical Physics 5, 5253–5261.
). Spectra in the O–H stretching region were recorded for the 2.0 molal solution. A three component model yielded good fits with internally consistent results for all spectra (Fig. S-1b). We assign the components C2 and C3 at ~3450 cm-1 and ~3580 cm-1 to ν1 and ν3 of H2O monomers (e.g., Walrafen, 1962Walrafen, G.E. (1962) Raman spectral studies of the effects of electrolytes on water structure. Journal of Chemical Physics 36, 1035–1042.
). The component C1 at ~3280 cm-1 is assigned to O–H stretching vibrations of strongly hydrogen-bonded, polymerised water species because the relative intensity of this component correlates with the dependence of polymerisation on pressure and temperature (e.g., Sahle et al., 2013Sahle, C., Sternemann, C., Schmidt, C., Lehtola, S., Jahn, S., Simonelli, L., Huotari, S., Hakala, M., Pylkkänen, T., Nyrow, A., Mende, K., Tolan, M., Hämäläinen, K., Wilke, M. (2013) Microscopic structure of water at elevated pressures and temperatures. Proceedings of the National Academy of Sciences of the United States of America 110, 6301–6306.
) and decreases with addition of salt (e.g., Walrafen, 1962Walrafen, G.E. (1962) Raman spectral studies of the effects of electrolytes on water structure. Journal of Chemical Physics 36, 1035–1042.
).In our experiments at 21 ± 1 °C, we obtained data for the ν1-SO42- Raman shift of the SO4* and CIP components (1a and 1b), the abundance of contact ion pairs, as calculated from the relative integrated intensities of the CIP and SO4* components (Fig. 1c), and the Raman shifts of the three band components in the O–H stretching region (Fig. 1d). At each studied concentration of 0.5, 1.7 and 2.0 molal MgSO4, increasing pressure produces linear changes in the ν1-SO42- Raman shift of SO4* of ~6 cm-1GPa-1 for the data to 0.17 GPa (Fig. 1a). Above 0.7 GPa, the pressure dependence of that Raman shift is also linear and independent of composition, but the slope is shallower (~3 cm-1GPa-1). All data show systematic negative departures from linearity beginning at 0.17 GPa, which corresponds to the LDW-HDW transition (Fig. 1a) and agrees with a previous study on NaSO4 solutions (Schmidt, 2009
Schmidt, C. (2009) Raman spectroscopic study of a H2O + Na2SO4 solution at 21–600 °C and 0.1 MPa to 1.1 GPa: Relative differential ν1-SO42- Raman scattering cross sections and evidence of the liquid–liquid transition. Geochimica et Cosmochimica Acta 73, 425–437.
). Departures from linearity continue to ~0.6 GPa. Similar behaviour is observed in the Raman shift of the CIP component in the same pressure interval (Fig. 1b).
Figure 1 Raman spectroscopic results at 21 ± 1 °C as a function of pressure. The shadowed band is the pressure range of the LDW-HDW transition at about 20 °C (Fanetti et al., 2014
Fanetti, S., Lapini, A., Paglai, M., Citroni, M., Di Donato, M., Scandolo, S., Righini, R., Bini, R. (2014) Structure and dynamics of low-density and high-density liquid water at high pressure. Journal of Physical Chemistry Letters 5, 235–240.
). (a-b) Raman shift ω of the ν1-SO42- mode of the SO4* component (a) and of the CIP component (b). Dashed lines denote the (∂ω/∂P)T=21°C slopes in cm-1GPa-1 from linear fits of data at <0.17 GPa. (c) Percentage of contact ion pairs as a function of pressure at 21 °C. (d) Raman shift of fitted band components in the νS-O–H region of the 2.0 molal MgSO4 solution.At 21 °C, the percentage of Mg2+SO42-(aq) CIP initially decreases with pressure along the isotherms at each concentration (Fig. 1c). Above ~0.4 GPa, however, it increases nearly linearly with rising pressure in 1.7 and 2.0 molal solutions. The 0.5 molal solution is consistent with this behaviour, although errors are larger and the abundance of CIPs is below the detection limit at about 0.4–0.9 GPa. This was not observed at 50–150 °C, where the percentage of CIP in 0.75 and 2.25 molal MgSO4 solutions generally decreased with pressure along all isotherms (Fig. S-2). The data for the pressure dependence of the νS-O–H Raman shift for C1, C2 and C3 in the 2.0 molal solution generally suggest declining frequency with rising pressure (Fig. 1d), consistent with lengthening of the O–H-bonds and thus shorter hydrogen bonds between the water molecules. The scatter in these data is fairly large because the νS-O–H components are very broad and overlap (Fig. S-1b).
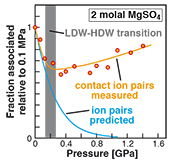
The finding of compression-enhanced contact ion pairing above ~0.2 GPa at 21 °C (Fig. 1c) is contrary to the predicted trend of increasing salt dissociation with pressure. Previous Raman spectroscopic and electrical conductivity studies (Ritzert and Franck, 1968
Ritzert, G., Franck, E.U. (1968) Electrical conductivity of aqueous solutions at high temperatures and pressures. 1. KCl, BaCl2, Ba(OH)2 and MgSO4 up to 750 °C and 6 kbar. Berichte der Bunsengesellschaft für physikalische Chemie 72, 798–808.
; Chatterjee et al., 1974Chatterjee, R.M., Adams, W.A., Davis, A.R. (1974) A high-pressure laser Raman spectroscopic investigation of aqueous magnesium sulfate solutions. Journal of Physical Chemistry 78, 246–250.
) at less than about 0.5 GPa and near ambient temperatures indicated increasing dissociation of MgSO4 in aqueous solution upon compression. Thermodynamic modelling also yields a continually increasing extent of ion pair dissociation with rising pressure, unaffected by the LDW-HDW transition (Fig. 2), but data used in such models are based on correlations and extrapolations typically derived from conductivity data at very different pressures and temperatures. The static dielectric constant of H2O is a key parameter governing the extent of ion association in aqueous solutions; however, it does not decrease with increasing pressure in the HDW field (Fernandez et al., 1995Fernandez, D.P., Mulev, Y., Goodwin, A.R.H., Levelt Sengers, J.M.H. (1995) A database for the static dielectric constant of water and steam. Journal of Physical and Chemical Reference Data 24, 33–53.
). Based on Coulomb’s law, the observed increased contact ion pairing must therefore be caused by a decrease in the distance between cation and anion. An increasing tendency to form ion pairs with pressure can thus be related to increased hydrogen-bond breaking with pressure resulting in a collapsed second coordination shell in HDW (Soper and Ricci, 2000Soper, A.K., Ricci, M.A. (2000) Structures of high-density and low-density water. Physical Review Letters 84, 2881–2884.
; Krisch et al., 2002Krisch, M., Loubeyre, P., Ruocco, G., Sette, F., Cunsolo, A., D’Astuto, M., LeToullec, R., Lorenzen, M., Mermet, A., Monaco, G., Verbeni, R. (2002) Pressure evolution of the high-frequency sound velocity in liquid water. Physical Review Letters 89, 125502.
; Fanetti et al., 2014Fanetti, S., Lapini, A., Paglai, M., Citroni, M., Di Donato, M., Scandolo, S., Righini, R., Bini, R. (2014) Structure and dynamics of low-density and high-density liquid water at high pressure. Journal of Physical Chemistry Letters 5, 235–240.
). Therefore, the inferred relationship between water structure and ion pairing implies that significant interaction between ions and water exists at distances larger than the first shell, which has long been a matter of debate (c.f. Marcus, 2009Marcus, Y. (2009) Effect of ions on the structure of water. Chemical Reviews 109, 1346–1370.
).
Figure 2 Fraction of MgSO4 associated at 21 ± 1 °C relative to that at ambient pressure, as determined by Raman spectroscopy and thermodynamic modelling, for 0.5 (a), 1.7 (b), and 2 molal solutions (c). Thick black lines are trend lines for the fraction of CIP from Raman spectroscopic data fit by eye. Blue lines denote the fraction of the sum of the CIP, SIP and 2SIP ion pairs calculated from a thermodynamic model based on the DEW model (Sverjensky et al., 2014
Sverjensky, D.A., Harrison, B., Azzolini, D. (2014) Water in the deep Earth: The dielectric constant and the solubilities of quartz and corundum to 60 kb and 1200 °C. Geochimica et Cosmochimica Acta 129, 125–145.
) and the Helgeson-Kirkham-Flowers ion activity model (Helgeson et al., 1981Helgeson, H.C., Kirkham, D.H., Flowers, G.C. (1981) Theoretical prediction of the thermodynamic behavior of aqueous electrolytes at high pressures and temperatures. IV. Calculation of activity coefficients, osmotic coefficients, and apparent molal and standard and relative partial molal properties to 5 kb and 600°C. American Journal of Science 281, 1241–1516.
). The comparison assumes that the proportionality between equilibrium constants associated with expelling the H2O molecules between ions is constant and independent of pressure. This assumption yields a minimum difference in predicted and observed CIP. The shadowed band is the pressure range of the LDW-HDW transition at about 20 °C (Fanetti et al., 2014Fanetti, S., Lapini, A., Paglai, M., Citroni, M., Di Donato, M., Scandolo, S., Righini, R., Bini, R. (2014) Structure and dynamics of low-density and high-density liquid water at high pressure. Journal of Physical Chemistry Letters 5, 235–240.
).top
Implications for Planetary Oceans and Interiors
Generally, the increase in ion pairing with pressure affects properties such as solubility, viscosity, sound absorption and electrical conductance. For a given salinity, isothermal salt re-association will yield lower ionic strength (and thus ion activity) than predicted from extrapolation of low-pressure behaviour, and also lower conductivity of deep ocean waters, which is relevant for the interpretation of spacecraft-based magnetometric data (e.g., Hand and Chyba, 2007
Hand, K.P., Chyba, C.F. (2007) Empirical constraints on the salinity of the Europan ocean and implications for a thin ice shell. Icarus 189, 424–438.
).Our results show that high pressures and fairly low temperatures are required for pressure-induced ion pairing in salty water. In nature, it will therefore only occur in relatively large, cool planetary bodies with thick liquid water shells. Extrasolar ice planets may well meet these requirements, as well as some ocean planets such as Kepler-62e and -62f (Kaltenegger et al., 2013
Kaltenegger, L., Sasselov, D., Rugheimer, S. (2013) Water-planets in the habitable zone: Atmospheric chemistry, observable features, and the case of Kepler-62e and -62f. Astrophysical Journal Letters 775, L47.
). So too would cold, deep, aqueous planetary settings in our solar system, which include the interiors of Pluto and the largest icy moons of Jupiter and Saturn. There is considerable evidence for a subsurface ocean in Europa, but plausible basal ocean pressure is too low (Spohn and Schubert, 2003Spohn, T., Schubert, G. (2003) Oceans in the icy Galilean satellites of Jupiter? Icarus 161, 456–467.
; Hand and Chyba, 2007Hand, K.P., Chyba, C.F. (2007) Empirical constraints on the salinity of the Europan ocean and implications for a thin ice shell. Icarus 189, 424–438.
) for salt re-association (Fig. 3). However, Ganymede (Vance et al., 2014Vance, S., Bouffard, M., Choukroun, M., Sotin, C. (2014) Ganymede’s internal structure including thermodynamics of magnesium sulfate oceans in contact with ice. Planetary and Space Science 96, 62–70.
; Saur et al., 2015Saur, J., Duling, S., Roth, L., Jia, X., Strobel, D.F., Feldman, P.D., Christensen, U.R., Retherford, K.D., McGrath, M.A., Musacchio, F., Wennmacher, A., Neubauer, F.M., Simon, S., Hartkorn, O. (2015) The search for a subsurface ocean in Ganymede with Hubble Space Telescope observations of its auroral ovals. Journal of Geophysical Research 120, 1715–1737.
) and Saturn’s moon Titan (Grasset and Pargamin, 2005Grasset, O., Pargamin, J. (2005) The ammonia-water system at high pressures: Implications for the methane of Titan. Planetary and Space Science 53, 371–384.
; Tobie et al., 2012Tobie, G., Gautier, D., Hersant, F. (2012) Titan’s bulk composition constrained by Cassini-Huygens: implication for internal outgassing. Astrophysical Journal 752, 125.
) likely possess deep subsurface oceans with substantial portions of the liquid water column in the LDW-HDW transition region (Fig. 3). Deep ocean waters of Pluto, and an at least partly differentiated Callisto, would also exceed 0.2 GPa (Spohn and Schubert, 2003Spohn, T., Schubert, G. (2003) Oceans in the icy Galilean satellites of Jupiter? Icarus 161, 456–467.
; Kuskov and Kronrod, 2005Kuskov, O.L., Kronrod, V.A. (2005) Internal structure of Europa and Callisto. Icarus 177, 550–569.
; Hammond et al., 2016Hammond, N.P., Barr, A.C., Parmentier, E.M. (2016) Recent tectonic activity on Pluto driven by phase changes in the ice shell. Geophysical Research Letters 43, 6775–6782.
). As in Europa, the existence of a thick saline subsurface ocean in Callisto is indicated by a conductive layer at a depth of less than about 300 km inferred from magnetic field perturbations observed by the Galileo spacecraft (Zimmer et al., 2000Zimmer, C., Khurana, K.K., Kivelson, M.G. (2000) Subsurface oceans on Europa and Callisto: Constraints from Galileo magnetometer observations. Icarus 147, 329–347.
).
Figure 3 Comparison of models of the interiors of Titan (Tobie et al., 2012
Tobie, G., Gautier, D., Hersant, F. (2012) Titan’s bulk composition constrained by Cassini-Huygens: implication for internal outgassing. Astrophysical Journal 752, 125.
), Europa (Spohn and Schubert, 2003Spohn, T., Schubert, G. (2003) Oceans in the icy Galilean satellites of Jupiter? Icarus 161, 456–467.
; Hand and Chyba, 2007Hand, K.P., Chyba, C.F. (2007) Empirical constraints on the salinity of the Europan ocean and implications for a thin ice shell. Icarus 189, 424–438.
; Valenti et al., 2012Valenti, P., Bodnar, R.J., Schmidt, C. (2012) Experimental determination of H2O–NaCl liquidi to 25 mass% NaCl and 1.4 GPa: Application to the Jovian satellite Europa. Geochimica et Cosmochimica Acta 92, 117–128.
), Ganymede (Vance et al., 2014Vance, S., Bouffard, M., Choukroun, M., Sotin, C. (2014) Ganymede’s internal structure including thermodynamics of magnesium sulfate oceans in contact with ice. Planetary and Space Science 96, 62–70.
; Saur et al., 2015Saur, J., Duling, S., Roth, L., Jia, X., Strobel, D.F., Feldman, P.D., Christensen, U.R., Retherford, K.D., McGrath, M.A., Musacchio, F., Wennmacher, A., Neubauer, F.M., Simon, S., Hartkorn, O. (2015) The search for a subsurface ocean in Ganymede with Hubble Space Telescope observations of its auroral ovals. Journal of Geophysical Research 120, 1715–1737.
), and Callisto (Kuskov and Kronrod, 2005Kuskov, O.L., Kronrod, V.A. (2005) Internal structure of Europa and Callisto. Icarus 177, 550–569.
) with approximate depths of the subsurface ocean boundaries in km. The shadowed band is the pressure range of the LDW-HDW transition at about 20 °C (Fanetti et al., 2014Fanetti, S., Lapini, A., Paglai, M., Citroni, M., Di Donato, M., Scandolo, S., Righini, R., Bini, R. (2014) Structure and dynamics of low-density and high-density liquid water at high pressure. Journal of Physical Chemistry Letters 5, 235–240.
).In this context, our finding of increasing ion association with pressure is important for understanding the coupled evolution of ocean salinity and the silicate interiors of the icy satellites. The salts of planetary oceans are acquired chiefly from sub-seafloor weathering reactions (Zolotov and Shock, 2001
Zolotov, M.Y., Shock, E.L. (2001) Composition and stability of salts on the surface of Europa and their oceanic origin. Journal of Geophysical Research 106, 32815–32827.
). About 75 % of the salts produced by low-temperature aqueous alteration of chondrite under oxidising conditions are magnesium sulphate hydrates (Hogenboom et al., 1995Hogenboom, D.L., Kargel, J.S., Ganasan, J.P., Lee, L. (1995) Magnesium sulfate-water to 400 MPa using a novel piezometer: densities, phase-equilibria, and planetological implications. Icarus 115, 258–277.
). Thus, H2O + MgSO4 is one of the most relevant model systems for planetary oceans. Consumption of ions by ion pair formation viaEq. 1
Mg2+ + SO42- = MgSO40
Eq. 2
Mg2SiO4 + 2H+ = Mg2+ + 2SiO2 + 2H2O
Vance, S., Bouffard, M., Choukroun, M., Sotin, C. (2014) Ganymede’s internal structure including thermodynamics of magnesium sulfate oceans in contact with ice. Planetary and Space Science 96, 62–70.
).top
Acknowledgements
This research was supported by the former GFZ visitors program and NSF EAR 1347987 to CEM.
Editor: Wendy Mao
top
References
Chatterjee, R.M., Adams, W.A., Davis, A.R. (1974) A high-pressure laser Raman spectroscopic investigation of aqueous magnesium sulfate solutions. Journal of Physical Chemistry 78, 246–250.
 Show in context
 Previous Raman spectroscopic and electrical conductivity studies (Ritzert and Franck, 1968; Chatterjee et al., 1974) at less than about 0.5 GPa and near ambient temperatures indicated increasing dissociation of MgSO4 in aqueous solution upon compression.
View in article
Fanetti, S., Lapini, A., Paglai, M., Citroni, M., Di Donato, M., Scandolo, S., Righini, R., Bini, R. (2014) Structure and dynamics of low-density and high-density liquid water at high pressure. Journal of Physical Chemistry Letters 5, 235–240.
 Show in context
 Based on femtosecond infrared pump-probe spectroscopy on a D2O-H2O mixture, the LDW-HDW transition is at ~0.25 GPa at 273 K and ~0.2 GPa at 298 K, but not observed at 363 K (Fanetti et al., 2014).
View in article
Figure 1 [...] The shadowed band is the pressure range of the LDW-HDW transition at about 20 °C (Fanetti et al., 2014).
View in article
An increasing tendency to form ion pairs with pressure can thus be related to increased hydrogen-bond breaking with pressure resulting in a collapsed second coordination shell in HDW (Soper and Ricci, 2000; Krisch et al., 2002; Fanetti et al., 2014).
View in article
Figure 2 [...] The shadowed band is the pressure range of the LDW-HDW transition at about 20 °C (Fanetti et al., 2014).
View in article
Figure 3 [...] The shadowed band is the pressure range of the LDW-HDW transition at about 20 °C (Fanetti et al., 2014).
View in article
Fernandez, D.P., Mulev, Y., Goodwin, A.R.H., Levelt Sengers, J.M.H. (1995) A database for the static dielectric constant of water and steam. Journal of Physical and Chemical Reference Data 24, 33–53.
 Show in context
 The static dielectric constant of H2O is a key parameter governing the extent of ion association in aqueous solutions; however, it does not decrease with increasing pressure in the HDW field (Fernandez et al., 1995).
View in article
Grasset, O., Pargamin, J. (2005) The ammonia-water system at high pressures: Implications for the methane of Titan. Planetary and Space Science 53, 371–384.
 Show in context
 However, Ganymede (Vance et al., 2014; Saur et al., 2015) and Saturn’s moon Titan (Grasset and Pargamin, 2005; Tobie et al., 2012) likely possess deep subsurface oceans with substantial portions of the liquid water column in the LDW-HDW transition region (Fig. 3).
View in article
Hammond, N.P., Barr, A.C., Parmentier, E.M. (2016) Recent tectonic activity on Pluto driven by phase changes in the ice shell. Geophysical Research Letters 43, 6775–6782.
 Show in context
 Deep ocean waters of Pluto, and an at least partly differentiated Callisto, would also exceed 0.2 GPa (Spohn and Schubert, 2003; Kuskov and Kronrod, 2005; Hammond et al., 2016).
View in article
Hand, K.P., Chyba, C.F. (2007) Empirical constraints on the salinity of the Europan ocean and implications for a thin ice shell. Icarus 189, 424–438.
 Show in context
 For a given salinity, isothermal salt re-association will yield lower ionic strength (and thus ion activity) than predicted from extrapolation of low-pressure behaviour, and also lower conductivity of deep ocean waters, which is relevant for the interpretation of spacecraft-based magnetometric data (e.g., Hand and Chyba, 2007).
View in article
There is considerable evidence for a subsurface ocean in Europa, but plausible basal ocean pressure is too low (Spohn and Schubert, 2003; Hand and Chyba, 2007) for salt re-association (Fig. 3).
View in article
Figure 3 Comparison of models of the interiors of Titan (Tobie et al., 2012), Europa (Spohn and Schubert, 2003; Hand and Chyba, 2007; Valenti et al., 2012), Ganymede (Vance et al., 2014; Saur et al., 2015), and Callisto (Kuskov and Kronrod, 2005) with approximate depths of the subsurface ocean boundaries in km.
View in article
Helgeson, H.C., Kirkham, D.H., Flowers, G.C. (1981) Theoretical prediction of the thermodynamic behavior of aqueous electrolytes at high pressures and temperatures. IV. Calculation of activity coefficients, osmotic coefficients, and apparent molal and standard and relative partial molal properties to 5 kb and 600°C. American Journal of Science 281, 1241–1516.
 Show in context
 Figure 2 [...] Blue lines denote the fraction of the sum of the CIP, SIP and 2SIP ion pairs calculated from a thermodynamic model based on the DEW model (Sverjensky et al., 2014) and the Helgeson-Kirkham-Flowers ion activity model (Helgeson et al., 1981).
View in article
Hogenboom, D.L., Kargel, J.S., Ganasan, J.P., Lee, L. (1995) Magnesium sulfate-water to 400 MPa using a novel piezometer: densities, phase-equilibria, and planetological implications. Icarus 115, 258–277.
 Show in context
 About 75 % of the salts produced by low-temperature aqueous alteration of chondrite under oxidising conditions are magnesium sulphate hydrates (Hogenboom et al., 1995).
View in article
Kaltenegger, L., Sasselov, D., Rugheimer, S. (2013) Water-planets in the habitable zone: Atmospheric chemistry, observable features, and the case of Kepler-62e and -62f. Astrophysical Journal Letters 775, L47.
 Show in context
Extrasolar ice planets may well meet these requirements, as well as some ocean planets such as Kepler-62e and -62f (Kaltenegger et al., 2013).
View in article
Kawamoto, T., Ochiai, S., Kagi, H. (2004) Changes in the structure of water deduced from the pressure dependence of the Raman OH frequency. Journal of Chemical Physics 120, 5867–5870.
 Show in context
 These include e.g., radial distribution functions from X-ray scattering (Okhulkov et al., 1994) and neutron diffraction (Soper and Ricci, 2000), a distinct anomaly in the high-frequency sound velocity from inelastic X-ray scattering experiments (Krisch et al., 2002), the Raman shift of the O–H stretching vibration (Kawamoto et al., 2004), the sound velocity from Brillouin spectroscopy (Li et al., 2005), and the isothermal compressibility (Mirwald, 2005).
View in article
Krisch, M., Loubeyre, P., Ruocco, G., Sette, F., Cunsolo, A., D’Astuto, M., LeToullec, R., Lorenzen, M., Mermet, A., Monaco, G., Verbeni, R. (2002) Pressure evolution of the high-frequency sound velocity in liquid water. Physical Review Letters 89, 125502.
 Show in context
 These include e.g., radial distribution functions from X-ray scattering (Okhulkov et al., 1994) and neutron diffraction (Soper and Ricci, 2000), a distinct anomaly in the high-frequency sound velocity from inelastic X-ray scattering experiments (Krisch et al., 2002), the Raman shift of the O–H stretching vibration (Kawamoto et al., 2004), the sound velocity from Brillouin spectroscopy (Li et al., 2005), and the isothermal compressibility (Mirwald, 2005).
View in article
An increasing tendency to form ion pairs with pressure can thus be related to increased hydrogen-bond breaking with pressure resulting in a collapsed second coordination shell in HDW (Soper and Ricci, 2000; Krisch et al., 2002; Fanetti et al., 2014).
View in article
Kuskov, O.L., Kronrod, V.A. (2005) Internal structure of Europa and Callisto. Icarus 177, 550–569.
 Show in context
 Deep ocean waters of Pluto, and an at least partly differentiated Callisto, would also exceed 0.2 GPa (Spohn and Schubert, 2003; Kuskov and Kronrod, 2005; Hammond et al., 2016).
View in article
Figure 3 Comparison of models of the interiors of Titan (Tobie et al., 2012), Europa (Spohn and Schubert, 2003; Hand and Chyba, 2007; Valenti et al., 2012), Ganymede (Vance et al., 2014; Saur et al., 2015), and Callisto (Kuskov and Kronrod, 2005) with approximate depths of the subsurface ocean boundaries in km.
View in article
Li, F., Cui, C.L., He, Z., Cui, T., Zhang, J., Zhou, Q., Zou, G.T., Sasaki, S. (2005) High pressure-temperature Brillouin study of liquid water: Evidence of the structural transition from low-density water to high-density water. Journal of Chemical Physics 123, 174511.
 Show in context
 These include e.g., radial distribution functions from X-ray scattering (Okhulkov et al., 1994) and neutron diffraction (Soper and Ricci, 2000), a distinct anomaly in the high-frequency sound velocity from inelastic X-ray scattering experiments (Krisch et al., 2002), the Raman shift of the O–H stretching vibration (Kawamoto et al., 2004), the sound velocity from Brillouin spectroscopy (Li et al., 2005), and the isothermal compressibility (Mirwald, 2005).
View in article
Marcus, Y. (2009) Effect of ions on the structure of water. Chemical Reviews 109, 1346–1370.
 Show in context
 It is not clear if, and by how much, the structure outside the first hydration shell is affected (Marcus, 2009), but there is considerable evidence that the LDW-HDW transition persists in saline solutions even at fairly high solute concentrations (Mirwald, 2005; Schmidt, 2009; Valenti et al., 2012).
View in article
Therefore, the inferred relationship between water structure and ion pairing implies that significant interaction between ions and water exists at distances larger than the first shell, which has long been a matter of debate (c.f. Marcus, 2009).
View in article
Mirwald, P. (2005) Evidence of PVT anomaly boundaries of water at high pressure from compression and NaCl·2H2O dehydration experiments. Journal of Chemical Physics 123, 124715.
 Show in context
 These include e.g., radial distribution functions from X-ray scattering (Okhulkov et al., 1994) and neutron diffraction (Soper and Ricci, 2000), a distinct anomaly in the high-frequency sound velocity from inelastic X-ray scattering experiments (Krisch et al., 2002), the Raman shift of the O–H stretching vibration (Kawamoto et al., 2004), the sound velocity from Brillouin spectroscopy (Li et al., 2005), and the isothermal compressibility (Mirwald, 2005).
View in article
It is not clear if, and by how much, the structure outside the first hydration shell is affected (Marcus, 2009), but there is considerable evidence that the LDW-HDW transition persists in saline solutions even at fairly high solute concentrations (Mirwald, 2005; Schmidt, 2009; Valenti et al., 2012).
View in article
Okhulkov, A.V., Demianets, Y.N., Gorbaty, Y.E. (1994) X-ray scattering in liquid water at pressures of up to 7.7 kbar: Test of a fluctuation model. Journal of Chemical Physics 100, 1578–1588.
 Show in context
 These include e.g., radial distribution functions from X-ray scattering (Okhulkov et al., 1994) and neutron diffraction (Soper and Ricci, 2000), a distinct anomaly in the high-frequency sound velocity from inelastic X-ray scattering experiments (Krisch et al., 2002), the Raman shift of the O–H stretching vibration (Kawamoto et al., 2004), the sound velocity from Brillouin spectroscopy (Li et al., 2005), and the isothermal compressibility (Mirwald, 2005).
View in article
Ritzert, G., Franck, E.U. (1968) Electrical conductivity of aqueous solutions at high temperatures and pressures. 1. KCl, BaCl2, Ba(OH)2 and MgSO4 up to 750 °C and 6 kbar. Berichte der Bunsengesellschaft für physikalische Chemie 72, 798–808.
 Show in context
 Previous Raman spectroscopic and electrical conductivity studies (Ritzert and Franck, 1968; Chatterjee et al., 1974) at less than about 0.5 GPa and near ambient temperatures indicated increasing dissociation of MgSO4 in aqueous solution upon compression.
View in article
Rudolph, W.W., Irmer, G., Hefter, G.T. (2003) Raman spectroscopic investigation of speciation in MgSO4(aq). Physical Chemistry Chemical Physics 5, 5253–5261.
 Show in context
 The higher wavenumber component is assigned to contact ion pairs Mg2+SO42-(aq) (CIP), and the lower wavenumber component, here designated SO4*, includes Raman-indistinguishable contributions from un-associated SO42-(aq) ions, solvent-shared ion pairs Mg2+(OH2)SO42-(aq) (SIP), and double solvent-separated ion pairs Mg2+(OH2)2SO42-(aq) (2SIP) (Rudolph et al., 2003).
View in article
Sahle, C., Sternemann, C., Schmidt, C., Lehtola, S., Jahn, S., Simonelli, L., Huotari, S., Hakala, M., Pylkkänen, T., Nyrow, A., Mende, K., Tolan, M., Hämäläinen, K., Wilke, M. (2013) Microscopic structure of water at elevated pressures and temperatures. Proceedings of the National Academy of Sciences of the United States of America 110, 6301–6306.
 Show in context
 The component C1 at ~3280 cm-1 is assigned to O–H stretching vibrations of strongly hydrogen-bonded, polymerised water species because the relative intensity of this component correlates with the dependence of polymerisation on pressure and temperature (e.g., Sahle et al., 2013) and decreases with addition of salt (e.g., Walrafen, 1962).
View in article
Saur, J., Duling, S., Roth, L., Jia, X., Strobel, D.F., Feldman, P.D., Christensen, U.R., Retherford, K.D., McGrath, M.A., Musacchio, F., Wennmacher, A., Neubauer, F.M., Simon, S., Hartkorn, O. (2015) The search for a subsurface ocean in Ganymede with Hubble Space Telescope observations of its auroral ovals. Journal of Geophysical Research 120, 1715–1737.
 Show in context
 However, Ganymede (Vance et al., 2014; Saur et al., 2015) and Saturn’s moon Titan (Grasset and Pargamin, 2005; Tobie et al., 2012) likely possess deep subsurface oceans with substantial portions of the liquid water column in the LDW-HDW transition region (Fig. 3).
View in article
Figure 3 Comparison of models of the interiors of Titan (Tobie et al., 2012), Europa (Spohn and Schubert, 2003; Hand and Chyba, 2007; Valenti et al., 2012), Ganymede (Vance et al., 2014; Saur et al., 2015), and Callisto (Kuskov and Kronrod, 2005) with approximate depths of the subsurface ocean boundaries in km.
View in article
Schmidt, C. (2009) Raman spectroscopic study of a H2O + Na2SO4 solution at 21–600 °C and 0.1 MPa to 1.1 GPa: Relative differential ν1-SO42- Raman scattering cross sections and evidence of the liquid–liquid transition. Geochimica et Cosmochimica Acta 73, 425–437.
 Show in context
 It is not clear if, and by how much, the structure outside the first hydration shell is affected (Marcus, 2009), but there is considerable evidence that the LDW-HDW transition persists in saline solutions even at fairly high solute concentrations (Mirwald, 2005; Schmidt, 2009; Valenti et al., 2012).
View in article
All data show systematic negative departures from linearity beginning at 0.17 GPa, which corresponds to the LDW-HDW transition (Fig. 1a) and agrees with a previous study on NaSO4 solutions (Schmidt, 2009).
View in article
Soper, A.K., Ricci, M.A. (2000) Structures of high-density and low-density water. Physical Review Letters 84, 2881–2884.
 Show in context
 These include e.g., radial distribution functions from X-ray scattering (Okhulkov et al., 1994) and neutron diffraction (Soper and Ricci, 2000), a distinct anomaly in the high-frequency sound velocity from inelastic X-ray scattering experiments (Krisch et al., 2002), the Raman shift of the O–H stretching vibration (Kawamoto et al., 2004), the sound velocity from Brillouin spectroscopy (Li et al., 2005), and the isothermal compressibility (Mirwald, 2005).
View in article
The experiments indicate a transition from an open structure in low-density water (LDW) to a structure with a collapsed second coordination shell in high-density water (HDW) (Soper and Ricci, 2000).
View in article
An increasing tendency to form ion pairs with pressure can thus be related to increased hydrogen-bond breaking with pressure resulting in a collapsed second coordination shell in HDW (Soper and Ricci, 2000; Krisch et al., 2002; Fanetti et al., 2014).
View in article
Spohn, T., Schubert, G. (2003) Oceans in the icy Galilean satellites of Jupiter? Icarus 161, 456–467.
 Show in context
 There is considerable evidence for a subsurface ocean in Europa, but plausible basal ocean pressure is too low (Spohn and Schubert, 2003; Hand and Chyba, 2007) for salt re-association (Fig. 3).
View in article
Deep ocean waters of Pluto, and an at least partly differentiated Callisto, would also exceed 0.2 GPa (Spohn and Schubert, 2003; Kuskov and Kronrod, 2005; Hammond et al., 2016).
View in article
Figure 3 Comparison of models of the interiors of Titan (Tobie et al., 2012), Europa (Spohn and Schubert, 2003; Hand and Chyba, 2007; Valenti et al., 2012), Ganymede (Vance et al., 2014; Saur et al., 2015), and Callisto (Kuskov and Kronrod, 2005) with approximate depths of the subsurface ocean boundaries in km.
View in article
Sverjensky, D.A., Harrison, B., Azzolini, D. (2014) Water in the deep Earth: The dielectric constant and the solubilities of quartz and corundum to 60 kb and 1200 °C. Geochimica et Cosmochimica Acta 129, 125–145.
 Show in context
 Figure 2 [...] Blue lines denote the fraction of the sum of the CIP, SIP and 2SIP ion pairs calculated from a thermodynamic model based on the DEW model (Sverjensky et al., 2014) and the Helgeson-Kirkham-Flowers ion activity model (Helgeson et al., 1981).
View in article
Tobie, G., Gautier, D., Hersant, F. (2012) Titan’s bulk composition constrained by Cassini-Huygens: implication for internal outgassing. Astrophysical Journal 752, 125.
 Show in context
 However, Ganymede (Vance et al., 2014; Saur et al., 2015) and Saturn’s moon Titan (Grasset and Pargamin, 2005; Tobie et al., 2012) likely possess deep subsurface oceans with substantial portions of the liquid water column in the LDW-HDW transition region (Fig. 3).
View in article
Figure 3 Comparison of models of the interiors of Titan (Tobie et al., 2012), Europa (Spohn and Schubert, 2003; Hand and Chyba, 2007; Valenti et al., 2012), Ganymede (Vance et al., 2014; Saur et al., 2015), and Callisto (Kuskov and Kronrod, 2005) with approximate depths of the subsurface ocean boundaries in km.
View in article
Valenti, P., Bodnar, R.J., Schmidt, C. (2012) Experimental determination of H2O–NaCl liquidi to 25 mass% NaCl and 1.4 GPa: Application to the Jovian satellite Europa. Geochimica et Cosmochimica Acta 92, 117–128.
 Show in context
 It is not clear if, and by how much, the structure outside the first hydration shell is affected (Marcus, 2009), but there is considerable evidence that the LDW-HDW transition persists in saline solutions even at fairly high solute concentrations (Mirwald, 2005; Schmidt, 2009; Valenti et al., 2012).
View in article
Figure 3 Comparison of models of the interiors of Titan (Tobie et al., 2012), Europa (Spohn and Schubert, 2003; Hand and Chyba, 2007; Valenti et al., 2012), Ganymede (Vance et al., 2014; Saur et al., 2015), and Callisto (Kuskov and Kronrod, 2005) with approximate depths of the subsurface ocean boundaries in km.
View in article
Vance, S., Bouffard, M., Choukroun, M., Sotin, C. (2014) Ganymede’s internal structure including thermodynamics of magnesium sulfate oceans in contact with ice. Planetary and Space Science 96, 62–70.
 Show in context
 However, Ganymede (Vance et al., 2014; Saur et al., 2015) and Saturn’s moon Titan (Grasset and Pargamin, 2005; Tobie et al., 2012) likely possess deep subsurface oceans with substantial portions of the liquid water column in the LDW-HDW transition region (Fig. 3).
View in article
Figure 3 Comparison of models of the interiors of Titan (Tobie et al., 2012), Europa (Spohn and Schubert, 2003; Hand and Chyba, 2007; Valenti et al., 2012), Ganymede (Vance et al., 2014; Saur et al., 2015), and Callisto (Kuskov and Kronrod, 2005) with approximate depths of the subsurface ocean boundaries in km.
View in article
Ganymede might have a stack of several ocean layers separated by different phases of ice, with the lowest liquid layer adjacent to the rocky mantle below (Vance et al., 2014).
View in article
Walrafen, G.E. (1962) Raman spectral studies of the effects of electrolytes on water structure. Journal of Chemical Physics 36, 1035–1042.
 Show in context
 We assign the components C2 and C3 at ~3450 cm-1 and ~3580 cm-1 to ν1 and ν3 of H2O monomers (e.g., Walrafen, 1962).
View in article
The component C1 at ~3280 cm-1 is assigned to O–H stretching vibrations of strongly hydrogen-bonded, polymerised water species because the relative intensity of this component correlates with the dependence of polymerisation on pressure and temperature (e.g., Sahle et al., 2013) and decreases with addition of salt (e.g., Walrafen, 1962).
View in article
Zimmer, C., Khurana, K.K., Kivelson, M.G. (2000) Subsurface oceans on Europa and Callisto: Constraints from Galileo magnetometer observations. Icarus 147, 329–347.
 Show in context
 As in Europa, the existence of a thick saline subsurface ocean in Callisto is indicated by a conductive layer at a depth of less than about 300 km inferred from magnetic field perturbations observed by the Galileo spacecraft (Zimmer et al., 2000).
View in article
Zolotov, M.Y., Shock, E.L. (2001) Composition and stability of salts on the surface of Europa and their oceanic origin. Journal of Geophysical Research 106, 32815–32827.
 Show in context
 We used MgSO4 solutions because they are thought to be important components of planetary oceans (Zolotov and Shock, 2001) and because Raman scattering from the symmetric stretching vibration of sulphate (ν1-SO42-) provides direct information about the fraction of contact ion pairs.
View in article
The salts of planetary oceans are acquired chiefly from sub-seafloor weathering reactions (Zolotov and Shock, 2001).
View in article
top
Supplementary Information
Methods
An externally heated Bassett-type HDAC (Bassett et al., 1993) equipped with type Ia ultra-low fluorescence and ultra-low birefringence diamond anvils (culet diameter 0.9 mm) was used for all experiments. The temperature in the sample chamber of the cell was measured using K-type thermocouples attached to the diamonds. Temperature was calibrated by measurement of two phase-transition temperatures, water ice melting in presence of liquid and vapour (triple point at 0.01 °C and 0.6 kPa) and the transformation from α-quartz to β-quartz (574 °C at 0.1 MPa). Accuracy and reproducibility of the temperature measurements were about ±0.1 °C between -5 and 0 °C (for measurement of the vapour-saturated liquidus temperature of the MgSO4 solution in the sample chamber) and about ±0.5 °C for experiments at 50 to 150 °C. The power input to the resistive heaters was controlled using Eurotherm® 2408 temperature controllers, which held the set temperature within ±0.2°C during acquisition of Raman spectra. A set of MgSO4 solutions of varying composition was prepared from chromatographic grade H2O (LiChrosolv®, Merck) and analytic grade magnesium sulphate heptahydrate (Merck). For a given experimental series, a piece of natural quartz was loaded with a drop of solution into the HDAC sample chamber formed by a hole with a diameter of 300 or 400 µm in a rhenium gasket separating the anvils. To minimise background fluorescence, care was taken during preparation and loading to avoid contamination by organic materials, particularly by residue made by fingers touching a surface. The procedure for loading and sealing the sample chamber led to minor but unavoidable H2O evaporation, so the MgSO4 concentration in the solution composition needed to be re-determined. This was done by measurement of the vapour-saturated liquidus temperature (cryometry). First, prior to sealing, an air bubble was allowed to grow to about 10 % of the liquid volume by controlled leaking of the chamber. The sample chamber was then sealed by slight compression of the gasket between the anvils, and the sample was frozen. The ice or MgSO4 hydrate melting temperature in the presence of vapour was then determined, giving the MgSO4 concentration from comparison to literature data (Wolf, 1966; Hogenboom et al., 1995; Marion and Farren, 1999). Magnesium sulphate concentrations determined by cryometry were checked by comparison with concentrations calculated from the full width at half maximum of the fitted SO4* component of the ν1-SO42- Raman band (Fig. S-1a), calibrated using MgSO4 standard solutions in glass containers. The results from both techniques were in very good agreement. The error in the reported MgSO4 concentrations is ±0.05 molal. For MgSO4 concentrations of 0.5, 1.7, and 2.0 molal, the experiments were performed along the 21 °C isotherm with stepwise increase of the pressure by compression of the sample chamber until solids formed. At each pressure step, Raman spectra of the fluid were collected in the region of the ν1-SO42- mode and additionally in the region of the O–H stretching vibrations of water in the 2.0 molal MgSO4 experiments. In the runs along the 21 °C isotherm, the pressure was determined by recording Raman spectra of quartz before and after those of the aqueous solution and using the calibrated frequency shift of the 206 cm-1 Raman line of quartz and equation 5 in Schmidt and Ziemann (2000). Two additional experimental series were performed on 0.75 and 2.25 molal MgSO4 solutions along several isochoric or quasi-isochoric paths at 50, 75, 100, 125, and 150 °C. In these runs, pressures above the vapour pressures of the solutions were obtained from the calibrated frequency shift of the 464 cm-1 Raman line of quartz using the equations 2 and 3 in Schmidt and Ziemann (2000). The random error in the obtained pressures was about 10 MPa if the 206 cm-1 Raman line of quartz was used, or about 25 MPa in the case of the 464 cm-1 line. The experiments at elevated temperatures were restricted to T ≤ 150 °C to avoid precipitation of kieserite (MgSO4·H2O) (Hogenboom et al., 1995; Jahn and Schmidt, 2010) and liquid-liquid phase separation (Wang et al., 2013), and terminated upon gasket failure. The unpolarised Raman spectra of solutions and quartz were acquired using a HORIBA Jobin Yvon LabRAM HR800 UV-Vis Raman microprobe (gratings 1800 lines/mm, focal length 800 mm) equipped with a thermoelectrically cooled CCD-detector (1024 × 256 pixel). The spectra were obtained in backscattering geometry with a Nikon MPlan SLWD 40× objective (numerical aperture 0.4), a confocal pinhole aperture of 100 µm, and using the 488.0 nm argon ion laser line for excitation. The laser interference filter was removed to record plasma lines from the Ar+ laser and the Raman lines in the same spectrum. The frequency shift of the quartz lines was calibrated using the plasma lines at 221.54, 351.60, and 520.30 cm-1 and the frequencies of the ν1-SO42- band components by monitoring the plasma lines at 737.28 and 1056.94 cm-1. The laser power was set to 275 mW at the source, which was low enough to avoid laser heating of the sample in the HDAC (Schmidt, 2009). Raman spectra of the solutions were collected with 20 accumulations of 5 s each to minimise spectral noise and to attain low and linear backgrounds of similar intensity. Before acquisition of these spectra, the nominal focal point position was always set to 20 µm below upper sample chamber surface to obtain comparable integrated intensities of the Raman bands (Everall, 2000; Schmidt and Chou, 2012). Spectral fitting was done using the software package PeakFit v4.11 from SYSTAT Software Inc., a linear baseline, and the Gaussian-Lorentzian sum (area) function with the same shape factor (i.e. the same degree of Lorentzian character) for all peaks in an individual fit of the two ν1-SO42- components (Rudolph et al., 2003) and the three components in the O-H stretching region of water (Brubach et al., 2005). The Pearson IV model was used for the Raman lines of quartz and the plasma lines to allow for peak asymmetry (Schmidt and Ziemann, 2000; Schmidt, 2009). This procedure resulted in a very good description of the shape of the recorded Raman bands, i.e. non-statistical residuals were insignificant in all cases. The signal-to-noise ratio in the Raman spectra did not permit reliable fitting of additional components in the O–H stretching region with consistent results.

Figure S-1 Raman spectra of a 2.0 molal MgSO4 solution at 21 °C, 0.1 MPa. The fitted baselines are shown as dashed lines. (a) ν1-SO42- region, with two fitted band components assigned to CIP (contact ion pairs) and SO4* (including solvent-separated ion pairs (SIP, 2SIP) and unassociated SO42- ions). (b) O–H stretching region, with three fitted band components, C1 (mostly from hydrogen-bonded water), C2 (assigned to the symmetric stretching vibration, ν1, of H2O monomers), and C3 (assigned to the antisymmetric stretching vibration, ν3, of H2O monomers).
Discussion of Validity of Results
Our observations point to a previously unrecognised tendency for progressively increasing contact ion pairing with rising pressure in high-density water at ambient temperature. Alternative explanations are not viable. The internal consistency of all collected data at three concentrations argues strongly against an artefact from hypothetical water loss during the experiments and against any non-isoplethic behaviour. Dissolved silica or rhenium can likewise be excluded as causes because the solubilities of Re and quartz (Manning, 1994; Xiong and Wood, 1999) are many orders of magnitude lower than the magnesium sulphate concentration at all pressure-temperature conditions of this study, and no rhenium or other sulphate was observed to form in the sample chamber. An artefact due to variable and nonlinear background can be excluded because all spectra were fitted using the same procedure and had low and very near linear backgrounds in the frequency region of the ν1-SO42- Raman mode. The fluorescence contribution from the solution or the diamond anvils was insignificant. Fitting of spectra in which the measured background of the diamond anvil was subtracted from the spectrum of the solution yielded results that were almost identical. The enhanced contact ion-pairing shown in Figure 1 could have been the result of an increase in temperature by about 10 to 15 °C during isothermal compression, but monitored temperature changes were <1 °C. Laser heating could have increased the percentage of CIP, but the determined fractions of CIP in the solutions in the HDAC at 0.1 MPa are even slightly lower than literature data (Rudolph et al., 2003) from Raman spectra acquired at much higher laser power at the sample. Finally, significantly different pressure dependencies of the ν1-SO42- Raman scattering cross sections of CIP and SO4* are implausible because they stem from the same vibrational mode of SO42-. Furthermore, this would be in conflict with the fact that equal Raman scattering coefficients of CIP and SO4* at ~25 °C, 0.1 MPa are verified by the close agreement of Raman spectroscopic speciation data for MgSO4 solutions with data from electrical conductivity measurements and dielectric relaxation and ultrasound absorption spectroscopy (Fisher, 1962; Davis and Oliver, 1973; Rull et al., 1994; Tomšič et al., 2002; Rudolph et al., 2003; Buchner et al., 2004; Akilan et al., 2006).
Discussion of Results at 50 to 150 °C
For 0.75 and 2.25 molal MgSO4 solutions, we determined the variation in the percentage of Mg2+SO42-(aq) contact ion pairs with pressure at 50, 75, 100, 125, and 150 °C (Fig. S-2). The percentage of CIP generally decreased with pressure along these isotherms. Although the slopes become considerably less negative with pressure, there is no clear evidence for increasing ion association for any isotherm. If our observation of pressure-induced salt association is related to the LDW-HDW transition, then the high temperature data imply that HDW stability either disappears with increasing temperature or moves rapidly to high pressure. Raman, infrared, and Brillouin spectroscopic studies show that the LDW-HDW transition becomes increasingly difficult to detect above ambient temperature, even at 50 °C (Li et al., 2005; Okada et al., 2005; Schmidt, 2009; Fanetti et al., 2014b). There is no consensus on the ∂P/∂T slope of the LDW-HDW transition. The available experimental constraints variously suggest slopes that are strongly positive (0.4 ± 0.1 GPa at 25 °C, 1.0 ± 0.1 GPa at 100 °C, and 1.3 ± 0.1 GPa at 300 °C) (Kawamoto et al., 2004), to slightly negative (0.29 GPa at 293 K, 0.21 GPa at 316 K, and 0.19 GPa at 353 K) (Li et al., 2005), to negative (~0.2 GPa at 273.7 K, ~0.16 GPa at 298.0 K, ~0.11 GPa at 318.0 K, and ~0.08 GPa at 339.0 K) with the interpretation that LDW ceases to exist at ~363 K (Fanetti et al., 2014b). Although the most recent data of Fanetti et al., (2014b) appear to be of high quality, it should be noted that the implied change in the solvent structure at ~363 K would affect volume and entropy of reactions. However, to our knowledge, there are no anomalies in vapour pressure or aqueous solubility curves at about this temperature. At lower temperatures, anomalies in reaction curves exist at pressures near the LDW transition, e.g., a change from a negative to a positive ∂P/∂T slope of the hydrohalite liquidus at -7.5 °C and 140 ± 40 MPa (Valenti et al., 2013) and an inflection in the dehydration curve of NaCl·2H2O at 12 °C, 0.27 GPa (Mirwald, 2005). Moreover, the minimum in the isothermal compressibility of water is at 46.5 °C. Above this temperature, water behaves like a regular liquid, which would be incompatible with a transition from more compressible LDW to less compressible HDW (Li et al., 2005) at about 90 °C. Furthermore, for the ν1-SO42- Raman band of a 1.54 molal Na2SO4 solution, the slopes of the wavenumber with pressure at 100, 200, 300, 400, and 500 °C are similar to that of LDW at 21 °C, and the slopes of the line width with pressure at 100, 200, 300, 400, and 500 °C are much closer to that of LDW than that of HDW at 21 °C (Schmidt, 2009). In summary, the considerations above are consistent with our interpretation that a relationship exists between ion paring behaviour and the LDW-HDW transition, and that this behaviour is a low-temperature phenomenon.

Figure S-2 Percentage of contact ion pairs in 0.75 and 2.25 molal MgSO4 solutions as a function of pressure along isotherms (dark blue, 50 °C; cyan, 75 °C; green, 100 °C; red, 125 °C; orange, 150 °C). Vertical error bars, 2 standard errors; horizontal error bars, uncertainty in the pressure obtained from the shift in the wavenumber of the 464 cm-1 Raman line of quartz.
Supplementary Information References
Bassett, W.A., Shen, A.H., Bucknum, M., Chou I-M. (1993) A new diamond anvil cell for hydrothermal studies to 10 GPa and -190°C to 1100°C. Review of Scientific Instruments 64, 2340–2345.
Brubach, J.B., Mermet, A., Filabozzi, A., Gerschel, A., Roy, P. (2005) Signatures of the hydrogen bonding in the infrared bands of water. Journal of Chemical Physics 1022, 184509.
Buchner, R., Chen, T., Hefter, G. (2004) Complexity in ‘‘simple” electrolyte solutions: ion pairing in MgSO4(aq). Journal of Physical Chemistry B 108, 2365–2375.
Davis, A.R., Oliver, B.G. (1973) Raman spectroscopic evidence for contact ion pairing in aqueous magnesium sulfate solutions. Journal of Physical Chemistry 77, 1315–1316.
Everall, N.J. (2000) Confocal Raman microscopy: why the depth resolution and spatial accuracy can be much worse than you think. Applied Spectroscopy 54, 773–782.
Fanetti, S., Paglai, M., Citroni, M., Lapini, A., Scandolo, S., Righini, R., Bini, R. (2014b) Connecting the water phase diagram to the metastable domain: High-pressure studies in the supercooled regime. Journal of Physical Chemistry Letters 5, 3804–3809.
Fisher, F.H. (1962) The effect of pressure on the equilibrium of magnesium sulfate. Journal of Physical Chemistry 66, 1607–1611.
Hogenboom, D.L., Kargel, J.S., Ganasan, J.P., Lee, L. (1995) Magnesium sulfate-water to 400 MPa using a novel piezometer: densities, phase-equilibria, and planetological implications. Icarus 115, 258–277.
Jahn, S., Schmidt, C. (2010) Speciation in aqueous MgSO4 fluids at high pressures and high temperatures from ab initio molecular dynamics and Raman spectroscopy. Journal of Physical Chemistry B 114, 15565–15572.
Kawamoto, T., Ochiai, S., Kagi, H. (2004) Changes in the structure of water deduced from the pressure dependence of the Raman OH frequency. Journal of Chemical Physics 120, 5867–5870.
Li, F., Cui, C.L., He, Z., Cui, T., Zhang, J., Zhou, Q., Zou, G.T., Sasaki, S. (2005) High pressure-temperature Brillouin study of liquid water: Evidence of the structural transition from low-density water to high-density water. Journal of Chemical Physics 123, 174511.
Manning, C.E. (1994) The solubility of quartz in H2O in the lower crust and upper mantle. Geochimica et Cosmochimica Acta 58, 4831–4839.
Marion, G.M., Farren, R.E. (1999) Mineral solubilities in the Na-K-Mg-Ca-Cl-SO4-H2O system: A re-evaluation of the sulfate chemistry in the Spencer-Møller-Weare model. Geochimica et Cosmochimica Acta 63, 1305–1318.
Mirwald, P. (2005) Evidence of PVT anomaly boundaries of water at high pressure from compression and NaCl·2H2O dehydration experiments. Journal of Chemical Physics 123, 124715.
Okada, T., Komatsu, K., Kawamoto, T., Yamanaka, T., Kagi, H. (2005) Pressure response of Raman spectra of water and its implication to the change in hydrogen bond interaction. Spectrochimica Acta Part A 61, 2423–2427.
Rudolph, W.W., Irmer, G., Hefter, G.T. (2003) Raman spectroscopic investigation of speciation in MgSO4(aq). Physical Chemistry Chemical Physics 5, 5253–5261.
Rull, F., Balarew, C., Alvarez, J.L., Sobron, F., Rodriguez, A. (1994) Raman spectroscopic study of ion association in aqueous magnesium-sulfate solutions. Journal of Raman Spectroscopy 25, 933–941.
Schmidt, C. (2009) Raman spectroscopic study of a H2O + Na2SO4 solution at 21–600 °C and 0.1 MPa to 1.1 GPa: Relative differential ν1-SO42- Raman scattering cross sections and evidence of the liquid–liquid transition. Geochimica et Cosmochimica Acta 73, 425–437.
Schmidt, C., Ziemann, M.A. (2000) In-situ Raman spectroscopy of quartz: A pressure sensor for hydrothermal diamond-anvil cell experiments at elevated temperatures. American Mineralogist 85, 1725–1734.
Schmidt, C., Chou, I-M. (2012) The hydrothermal diamond anvil cell (HDAC) for Raman spectroscopic studies of geological fluids at high pressures and temperatures. In: Dubessy, J., Caumon, M.-C., Rull, F. (Eds.) Raman Spectroscopy applied to Earth Sciences and Cultural Heritage. EMU Notes in Mineralogy, Vol. 12, 247–276.
Tomšič, M., Bester-Rogač, M., Jamnik, A., Neueder, R., Barthel, J. (2002) Conductivity of magnesium sulfate in water from 5 to 35°C and from infinite dilution to saturation. Journal of Solution Chemistry 31, 19–31.
Valenti, P., Bodnar, R.J., Schmidt, C. (2012) Experimental determination of H2O–NaCl liquidi to 25 mass% NaCl and 1.4 GPa: Application to the Jovian satellite Europa. Geochimica et Cosmochimica Acta 92, 117–128.
Wang, X., Chou, I-M., Hu, W., Burruss, R.C. (2013) In-situ observations of liquid-liquid phase separation in aqueous MgSO4 solutions: Geological and geochemical implications. Geochimica et Cosmochimica Acta 103, 1–10.
Wolf, A.V. (1966) Aqueous solutions and body fluids: their concentrative properties and conversion tables. Harper & Row, New York.
Xiong, Y., Wood, S.A. (1999) Experimental determination of the solubility of ReO2 and the dominant oxidation state of rhenium in hydrothermal solutions. Chemical Geology 158, 245–256.
Figures and Tables
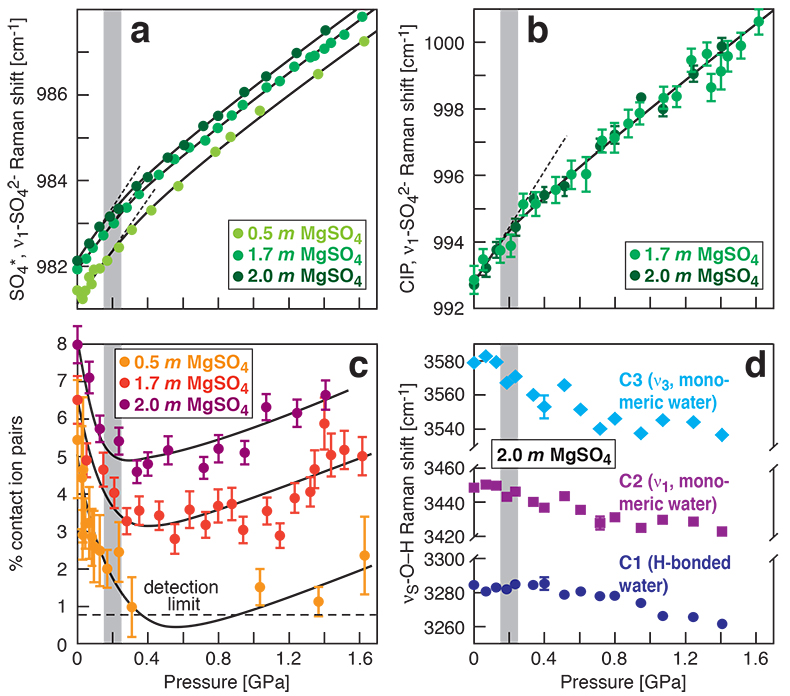
Figure 1 Raman spectroscopic results at 21 ± 1 °C as a function of pressure. The shadowed band is the pressure range of the LDW-HDW transition at about 20 °C (Fanetti et al., 2014
Fanetti, S., Lapini, A., Paglai, M., Citroni, M., Di Donato, M., Scandolo, S., Righini, R., Bini, R. (2014) Structure and dynamics of low-density and high-density liquid water at high pressure. Journal of Physical Chemistry Letters 5, 235–240.
). (a-b) Raman shift ω of the ν1-SO42- mode of the SO4* component (a) and of the CIP component (b). Dashed lines denote the (∂ω/∂P)T=21°C slopes in cm-1GPa-1 from linear fits of data at <0.17 GPa. (c) Percentage of contact ion pairs as a function of pressure at 21 °C. (d) Raman shift of fitted band components in the νS-O–H region of the 2.0 molal MgSO4 solution.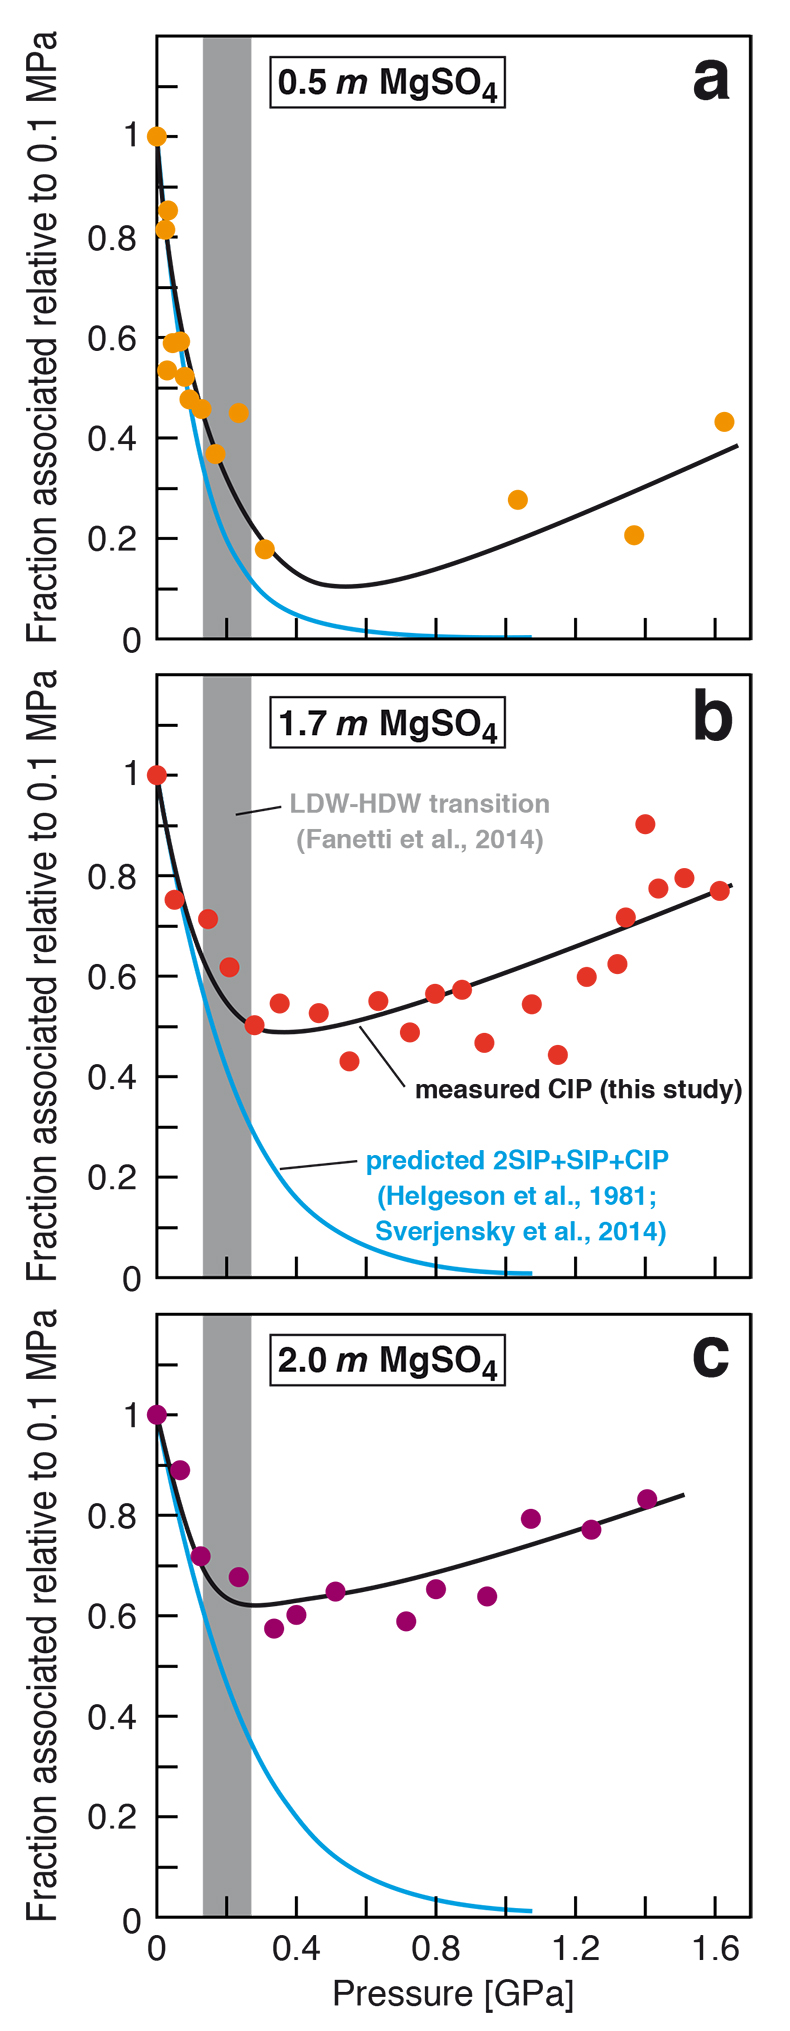
Figure 2 Fraction of MgSO4 associated at 21 ± 1 °C relative to that at ambient pressure, as determined by Raman spectroscopy and thermodynamic modelling, for 0.5 (a), 1.7 (b), and 2 molal solutions (c). Thick black lines are trend lines for the fraction of CIP from Raman spectroscopic data fit by eye. Blue lines denote the fraction of the sum of the CIP, SIP and 2SIP ion pairs calculated from a thermodynamic model based on the DEW model (Sverjensky et al., 2014
Sverjensky, D.A., Harrison, B., Azzolini, D. (2014) Water in the deep Earth: The dielectric constant and the solubilities of quartz and corundum to 60 kb and 1200 °C. Geochimica et Cosmochimica Acta 129, 125–145.
) and the Helgeson-Kirkham-Flowers ion activity model (Helgeson et al., 1981Helgeson, H.C., Kirkham, D.H., Flowers, G.C. (1981) Theoretical prediction of the thermodynamic behavior of aqueous electrolytes at high pressures and temperatures. IV. Calculation of activity coefficients, osmotic coefficients, and apparent molal and standard and relative partial molal properties to 5 kb and 600°C. American Journal of Science 281, 1241–1516.
). The comparison assumes that the proportionality between equilibrium constants associated with expelling the H2O molecules between ions is constant and independent of pressure. This assumption yields a minimum difference in predicted and observed CIP. The shadowed band is the pressure range of the LDW-HDW transition at about 20 °C (Fanetti et al., 2014Fanetti, S., Lapini, A., Paglai, M., Citroni, M., Di Donato, M., Scandolo, S., Righini, R., Bini, R. (2014) Structure and dynamics of low-density and high-density liquid water at high pressure. Journal of Physical Chemistry Letters 5, 235–240.
).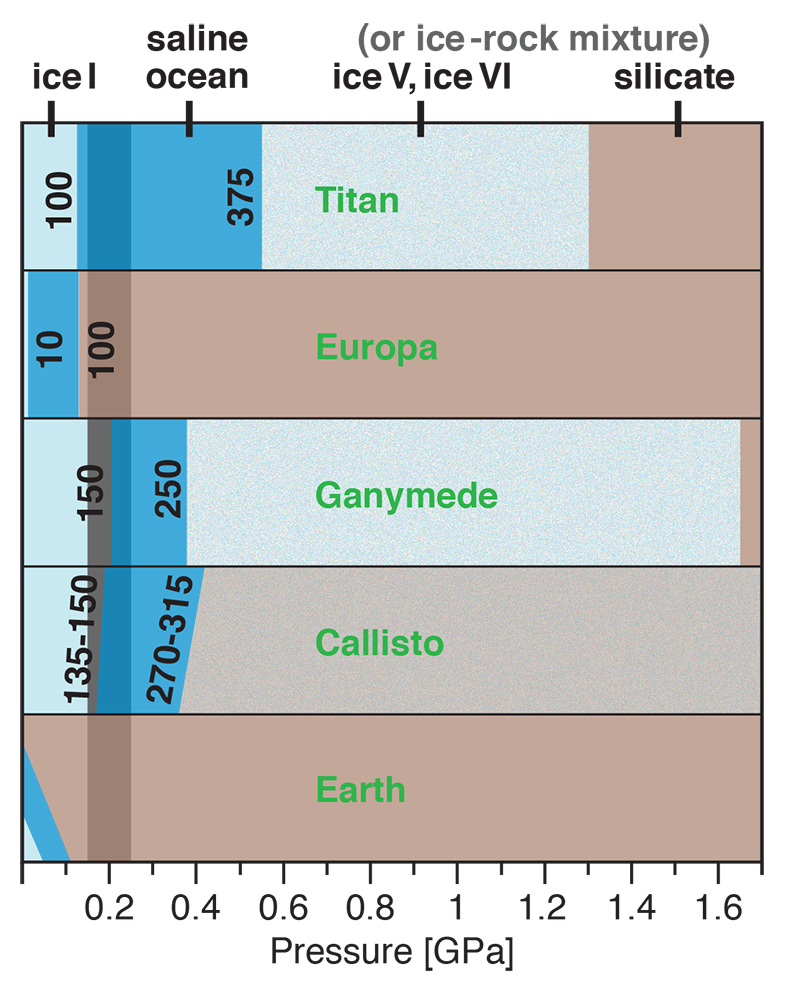
Figure 3 Comparison of models of the interiors of Titan (Tobie et al., 2012
Tobie, G., Gautier, D., Hersant, F. (2012) Titan’s bulk composition constrained by Cassini-Huygens: implication for internal outgassing. Astrophysical Journal 752, 125.
), Europa (Spohn and Schubert, 2003Spohn, T., Schubert, G. (2003) Oceans in the icy Galilean satellites of Jupiter? Icarus 161, 456–467.
; Hand and Chyba, 2007Hand, K.P., Chyba, C.F. (2007) Empirical constraints on the salinity of the Europan ocean and implications for a thin ice shell. Icarus 189, 424–438.
; Valenti et al., 2012Valenti, P., Bodnar, R.J., Schmidt, C. (2012) Experimental determination of H2O–NaCl liquidi to 25 mass% NaCl and 1.4 GPa: Application to the Jovian satellite Europa. Geochimica et Cosmochimica Acta 92, 117–128.
), Ganymede (Vance et al., 2014Vance, S., Bouffard, M., Choukroun, M., Sotin, C. (2014) Ganymede’s internal structure including thermodynamics of magnesium sulfate oceans in contact with ice. Planetary and Space Science 96, 62–70.
; Saur et al., 2015Saur, J., Duling, S., Roth, L., Jia, X., Strobel, D.F., Feldman, P.D., Christensen, U.R., Retherford, K.D., McGrath, M.A., Musacchio, F., Wennmacher, A., Neubauer, F.M., Simon, S., Hartkorn, O. (2015) The search for a subsurface ocean in Ganymede with Hubble Space Telescope observations of its auroral ovals. Journal of Geophysical Research 120, 1715–1737.
), and Callisto (Kuskov and Kronrod, 2005Kuskov, O.L., Kronrod, V.A. (2005) Internal structure of Europa and Callisto. Icarus 177, 550–569.
) with approximate depths of the subsurface ocean boundaries in km. The shadowed band is the pressure range of the LDW-HDW transition at about 20 °C (Fanetti et al., 2014Fanetti, S., Lapini, A., Paglai, M., Citroni, M., Di Donato, M., Scandolo, S., Righini, R., Bini, R. (2014) Structure and dynamics of low-density and high-density liquid water at high pressure. Journal of Physical Chemistry Letters 5, 235–240.
).Back to article
Supplementary Figures and Tables
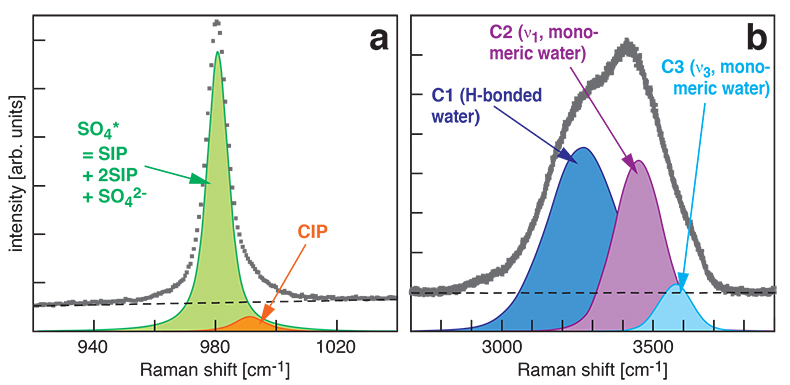
Figure S-1 Raman spectra of a 2.0 molal MgSO4 solution at 21 °C, 0.1 MPa. The fitted baselines are shown as dashed lines. (a) ν1-SO42- region, with two fitted band components assigned to CIP (contact ion pairs) and SO4* (including solvent-separated ion pairs (SIP, 2SIP) and unassociated SO42- ions). (b) O–H stretching region, with three fitted band components, C1 (mostly from hydrogen-bonded water), C2 (assigned to the symmetric stretching vibration, ν1, of H2O monomers), and C3 (assigned to the antisymmetric stretching vibration, ν3, of H2O monomers).
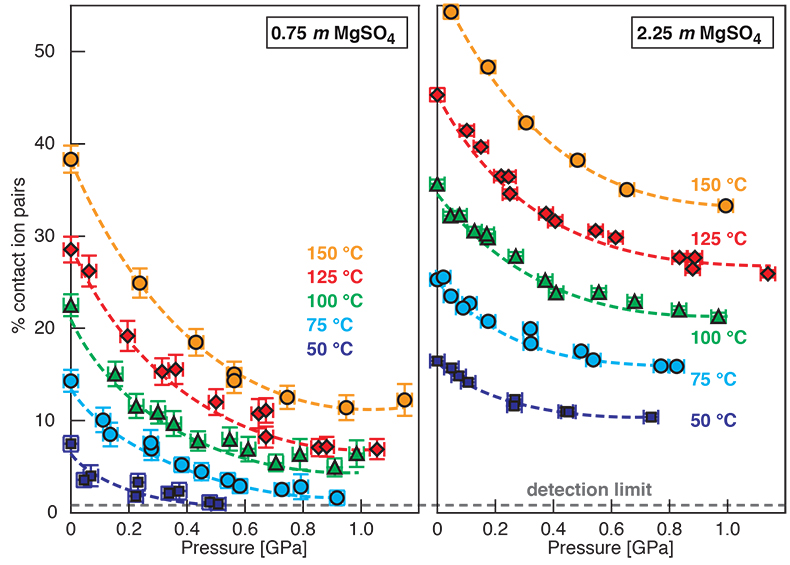
Figure S-2 Percentage of contact ion pairs in 0.75 and 2.25 molal MgSO4 solutions as a function of pressure along isotherms (dark blue, 50 °C; cyan, 75 °C; green, 100 °C; red, 125 °C; orange, 150 °C). Vertical error bars, 2 standard errors; horizontal error bars, uncertainty in the pressure obtained from the shift in the wavenumber of the 464 cm-1 Raman line of quartz.


