Orbitally forced sphalerite growth in the Upper Mississippi Valley District
Affiliations | Corresponding Author | Cite as | Funding information- Share this article


Article views:4,791Cumulative count of HTML views and PDF downloads.
- Download Citation
- Rights & Permissions
top
Abstract
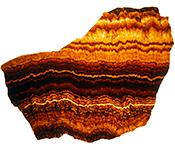
Figures and Tables
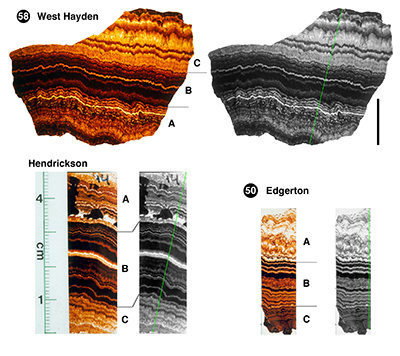 Figure 1 Sphalerite samples from West Hayden, Hendrickson, and Edgerton orebodies. Coloured photographs are shown with three growth stages of A (early), B (middle), and C (late) following McLimans et al. (1980). The rock colour grayscale profile was measured along the traverse (green) in grayscale images. Length of the black bar is 2 cm. Samples from Hendrickson and Edgerton orebodies share the same scale. | 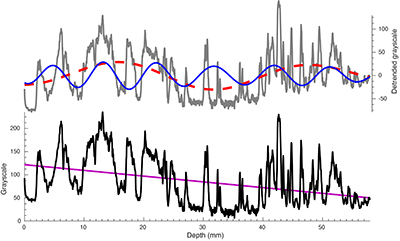 Figure 2 Grayscale trace of a cross section of sphalerite (black) and its linear trend (purple). De-trended data (gray) are shown with its 32 mm (dashed red) and 9 mm (solid blue) Gauss bandpass filtered cycles (passband: 0.031 ± 0.008 and 0.11 ± 0.02 cycles/mm, respectively). | 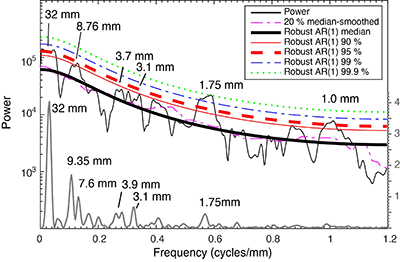 Figure 3 2π MTM power spectrum (thin black) and periodogram (gray) of the grayscale series shown with robust red-noise models. The red-noise fit to the spectrum is based on the best fit to the log power of the 20 % median smoothed spectrum (dashed pink). The 90 % (solid red), 95 % (dashed red), 99 % (blue dashed line), and 99.9 % (dot green) confidence limits are shown. Cycle wavelengths are also marked. | 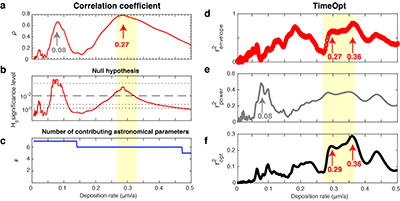 Figure 4 Sphalerite deposition rate. (a) The COCO analysis shows optimal deposition rate at 0.27 μm/a. (b) Null hypothesis testing of the data series indicates that 0.08 μm/a and 0.27 μm/a deposition rates have significance levels less than 1 %. (c) Number of contributing astronomical parameters. (d) Squared correlation coefficient for the amplitude envelope fit (r2envelope) and (e) the spectral power fit (r2power). (f) Combined envelope and spectral power fit (r2opt) at test deposition rate. |
| Figure 1 | Figure 2 | Figure 3 | Figure 4 |
top
Introduction
Mississippi Valley Type deposits yield about 24 % of the global commercial zinc and lead resources (Leach et al., 2010
Leach, D.L., Taylor, R.D., Fey, D.L., Diehl, S.F., Saltus, R.W. (2010) A deposit model for Mississippi Valley-type lead-zinc ores. Chapter A of mineral deposit models for resource assessment: USGS, Scientific Investigations Report.
). The Upper Mississippi Valley District in Iowa, Illinois and Wisconsin of the United States is typical of the lower temperature hydrothermal ores of the Mississippi Valley Type.From extensive research by many scientists, a genetic model has been developed for the Upper Mississippi Valley District (review in Barnes, 2015
Barnes, H.L. (2015) Hydrothermal processes. Geochemical Perspectives 4, 1-93.
). The hydrothermal fluids that carried the ore components apparently originated as ground waters high in the Southern Appalachians, a source that was elevated during the Permian by the Alleghenian Orogeny. These brines flowed northwestward about 1100 km descending through and beyond the Illinois basin (Fig. S-1). Along that geochemically tracked path, the waters became geothermally heated and collected ore solution components (Barnes, 2015Barnes, H.L. (2015) Hydrothermal processes. Geochemical Perspectives 4, 1-93.
). The geochemistry of the depositional reactions is consistent with a process of mixing of the geothermal solution with local groundwaters which caused oxidation and cooling of the ore-transporting fluid and precipitation of its minerals. The dominant product was sphalerite with vivid yellow-brown-black bands caused by variation in the FeS solid solution in the ZnS. The banding was found by McLimans (1977)McLimans, R.K. (1977) Geological, fluid inclusion, and stable isotope studies of the Upper Mississippi Valley zinc-lead district, southwest Wisconsin. PhD Dissertation. The Pennsylvania State University, Pennsylvania.
to be remarkably similar across hundreds of square kilometres. This regularity implies that the mixing process was consistent over large areas and that the contribution to the process by hydrothermal solution flow and by areal groundwater input were surprisingly consistent. The maximum deposition depth was about 1 km, based on palaeostratigraphic reconstruction (Rowan and Goldhaber, 1996Rowan, E.L., Goldhaber, M.B. (1996) Fluid inclusions and biomarkers in the Upper Mississippi Valley zinc-lead district: implications for the fluid-flow and thermal history of the Illinois basin. USGS Numbered Series Bulletin 2094F, doi: 10.3133/b2094F.
). In essence, the banding recorded variability in geochemical conditions from groundwater penetration and mixing at the depths of the depositional sites. Testing of a correlation of the banding in the sphalerite with periodicities of weather and their causes is our means of evaluating the reliability of this hypothesis.Groundwater plays an essential role in global water cycles via feedback between groundwater and the climate system (Maher and Chamberlain, 2014
Maher, K., Chamberlain, C.P. (2014) Hydrologic Regulation of Chemical Weathering and the Geologic Carbon Cycle. Science 343, 1502-1504.
). The upper 2 km of continental crust preserves approximately 22.6 million km3 volume of total groundwater, which is equivalent to a 180 m deep layer of flood water if spread evenly across the global land surface (Gleeson et al., 2016Gleeson, T., Befus, K.M., Jasechko, S., Luijendijk, E., Cardenas, M.B. (2016) The global volume and distribution of modern groundwater. Nature Geoscience 9, 161-167.
). Small changes in the volume of groundwater can have significant impacts on the global water balance and lead to large sea level changes (Gleeson et al., 2016Gleeson, T., Befus, K.M., Jasechko, S., Luijendijk, E., Cardenas, M.B. (2016) The global volume and distribution of modern groundwater. Nature Geoscience 9, 161-167.
). The hypothesis of groundwater-driven sea level changes might be the most promising interpretation of high amplitude sea level changes at the 104-106 year scale that regulated climate in the greenhouse world with no ice sheet (Wagreich et al., 2014Wagreich, M., Lein, R., Sames, B. (2014) Eustasy, its controlling factors and the Limno-eustatic hypothesis—concepts inspired by Eduard Suess. Austrian Journal of Earth Sciences 107, 115-131.
; Li et al., 2018aLi, M., Hinnov, L.A., Huang, C., Ogg, J.G. (2018a) Sedimentary noise and sea levels linked to land–ocean water exchange and obliquity forcing. Nature Communications 9, 1004, doi: 10.1038/s41467-018-03454-y.
). However, lack of geological evidence of groundwater activity restricted the understanding of the driving force and timing of groundwater activity and, furthermore, hampered the robustness of the sea level projection by the Intergovernmental Panel on Climate Change (IPCC) (Church et al., 2013Church, J.A., Clark, P.U., Cazenave, A., Gregory, J.M., Jevrejeva, S., Levermann, A., Merrifield, M.A., Milne, G.A., Nerem, R.S., Nunn, P.D., Payne, A.J., Pfeffer, W.T., Stammer, D., Unnikrishnan, A.S. (2013) 2013: Sea Level Change. In: Stocker, T.F., Qin, D., Plattner, G.-K., Tignor, M., Allen, S.K., Boschung, J., Nauels, A., Xia, Y., Bex, V., Midgley, P.M. (Eds.) Climate Change 2013: The Physical Science Basis. Contribution of Working Group I to the Fifth Assessment Report of the Intergovernmental Panel on Climate Change. Cambridge University Press, Cambridge, United Kingdom and New York, NY, USA, 1137-1216.
).The objective here is to determine the time dependence of the sphalerite banding in order to resolve the regional climate and groundwater activity in this district during the Permian. According to the Milankovitch theory, the Earth’s climate is affected by quasi-periodic changes in Earth orbital parameters which affect the insolation received at the top of the atmosphere at a 104–105 year scale (Laskar et al., 2004
Laskar, J., Robutel, P., Joutel, F., Gastineau, M., Correia, A.C.M., Levrard, B. (2004) A long-term numerical solution for the insolation quantities of the Earth. Astronomy & Astrophysics 428, 261-285.
). Here, time series analysis demonstrates that oscillations of grayscale profiles of the sphalerite banding correlate with Milankovitch cycles. This study provides geological evidence that astronomical forcing had significant impact on sphalerite growth due to the oxygen activity in groundwater.top
Materials and Method
The sphalerite sample analysed here was collected from the West Hayden orebody near Shullsburg, Wisconsin (Fig. 1). The colour banding in sphalerite is caused by variation in the FeS content of sphalerite (McLimans et al., 1980
McLimans, R.K., Barnes, H.L., Ohmoto, H. (1980) Sphalerite stratigraphy of the upper Mississippi Valley zinc-lead district, southwest Wisconsin. Economic Geology 75, 351-361.
). The high grayscale value is an indication of a dark coloured mineral with a high FeS content, and vice versa (McLimans et al., 1980McLimans, R.K., Barnes, H.L., Ohmoto, H. (1980) Sphalerite stratigraphy of the upper Mississippi Valley zinc-lead district, southwest Wisconsin. Economic Geology 75, 351-361.
). A grayscale profile of sphalerite banding (Fig. 2) was digitalised and analysed using Acycle software (Li et al., 2019Li, M., Hinnov, L., Kump, L. (2019) Acycle: Time-series analysis software for paleoclimate research and education. Computers & Geosciences 127, 12-22.
). In order to identify optimal deposition rate and test the null hypothesis (H0) that no astronomical forcing drove oscillations of the colour banding, we ran the statistical methods of correlation coefficient (COCO) (Li et al., 2018bLi, M., Kump, L.R., Hinnov, L.A., Mann, M.E. (2018b) Tracking variable sedimentation rates and astronomical forcing in Phanerozoic paleoclimate proxy series with evolutionary correlation coefficients and hypothesis testing. Earth and Planetary Science Letters 501, 165-179.
) and TimeOpt (Meyers, 2015Meyers, S.R. (2015) The evaluation of eccentricity‐related amplitude modulation and bundling in paleoclimate data: An inverse approach for astrochronologic testing and time scale optimization. Paleoceanography doi: 10.1002/2015PA002850.
). The COCO and TimeOpt methods are both designed to estimate the optimal sedimentation rate from a palaeoclimate series in stratigraphic domain and are detailed in the Supplementary Information.
Figure 1 Sphalerite samples from West Hayden, Hendrickson, and Edgerton orebodies. Coloured photographs are shown with three growth stages of A (early), B (middle), and C (late) following McLimans et al. (1980)
McLimans, R.K., Barnes, H.L., Ohmoto, H. (1980) Sphalerite stratigraphy of the upper Mississippi Valley zinc-lead district, southwest Wisconsin. Economic Geology 75, 351-361.
. The rock colour grayscale profile was measured along the traverse (green) in grayscale images. Length of the black bar is 2 cm. Samples from Hendrickson and Edgerton orebodies share the same scale.
Figure 2 Grayscale trace of a cross section of sphalerite (black) and its linear trend (purple). De-trended data (gray) are shown with its 32 mm (dashed red) and 9 mm (solid blue) Gauss bandpass filtered cycles (passband: 0.031 ± 0.008 and 0.11 ± 0.02 cycles/mm, respectively).
top
Results
Power spectral analysis of grayscale data indicate significant frequency peaks corresponding to 32 mm, 9.4-7.6 mm, 1.75 mm, 1.0 mm, and 0.58 mm cycles (Fig. 3). There are also high amplitude peaks corresponding to wavelengths at 3.9-3.7 mm and 3.1 mm. Statistical analysis using both COCO and TimeOpt methods give similar results. In Figure 4a-c, the COCO results suggest the correlation coefficient value reaches the higher peak at the depositional rate of 0.27 μm/a at which the null hypothesis (H0, no orbital forcing) significance level is 0.20 %. There is a peak at 0.08 μm/a but the correlation coefficient is much lower than that at 0.27 μm/a. In comparison, the TimeOpt analysis indicates the highest r2envelope peak occurs at 0.27-0.36 μm/a, the highest peak of r2power at 0.08 μm/a, and the highest r2opt peak at 0.29-0.36 μm/a. A combination of the above analyses suggests that the optimal depositional rate of the studied sphalerite sample is probably 0.27 μm/a. Periods of Milankovitch cycles at 270 Ma were 413 kyr, 123 kyr, 95 kyr, 44.3 kyr, 35.1 kyr, 21.0, and 17.6 kyr (Berger et al., 1989
Berger, A., Loutre, M.-F., Dehant, V. (1989) Pre-quaternary Milankovitch frequencies. Nature, 342, 133.
). The null hypothesis can be rejected at a confidence level of 99.80 % and the dominant 32 mm cycles in the banding correlate with 118.5 kyr (probably short eccentricity) cycles, and the 9.4-7.6 mm, 3.9-3.7 mm, 3.1 mm, 1.75-1.0 mm and 0.58 mm cycles are probably 34.8-28.1 kyr (obliquity), ~14 kyr (probably precession), 11.5 kyr, 6.5-3.7 kyr and 2.1 kyr (sub-Milankovitch) cycles, respectively.
Figure 3 2π MTM power spectrum (thin black) and periodogram (gray) of the grayscale series shown with robust red-noise models. The red-noise fit to the spectrum is based on the best fit to the log power of the 20 % median smoothed spectrum (dashed pink). The 90 % (solid red), 95 % (dashed red), 99 % (blue dashed line), and 99.9 % (dot green) confidence limits are shown. Cycle wavelengths are also marked.

Figure 4 Sphalerite deposition rate. (a) The COCO analysis shows optimal deposition rate at 0.27 μm/a. (b) Null hypothesis testing of the data series indicates that 0.08 μm/a and 0.27 μm/a deposition rates have significance levels less than 1 %. (c) Number of contributing astronomical parameters. (d) Squared correlation coefficient for the amplitude envelope fit (r2envelope) and (e) the spectral power fit (r2power). (f) Combined envelope and spectral power fit (r2opt) at test deposition rate.
top
Discussion
Sphalerite depositional process linked to groundwater flow. Barnes (2015)
Barnes, H.L. (2015) Hydrothermal processes. Geochemical Perspectives 4, 1-93.
concluded that inorganic complexes were insufficiently stable to carry dissolved base metals into these ores. With alternative, unspecified organic ligands L, that could have complexed the (Zn, Fe)S, a schematic reaction may be proposed for deposition by oxidation as in Sicree and Barnes (1996)Sicree, A.A., Barnes, H.L. (1996) Upper Mississippi Valley district ore fluid model: the role of organic complexes. Ore Geology Reviews 11, 105-131.
:Eq. 1

The iron content of the sphalerite is set by the oxidation state of the ore solution which controls partitioning of aqueous iron species between sphalerite and pyrite as in
Eq. 2

where the oxidation could be promoted by O2 (often about 8 ppm in groundwater) or other oxidants. The colour banding in this sphalerite is apparently caused by the variation in oxidation state during precipitation which must be controlled by the depth penetration of circulating groundwater which is controlled by the ambient climate.
Astronomical forcing. The colour banding of the sphalerite from the Upper Mississippi Valley District was first suggested to be periodic by Roedder (1968)
Roedder, E. (1968) The non-colloidal origin of 'colloform' textures in sphalerite ores. Economic Geology 63, 451-471.
. He argued that the periodic bandings are annual “varves” and reported similar “varved” samples from Belgium, Germany, Austria, Tirol, Italy, Poland and the United States and most of these “varves” have a thickness ranging from 1 to 7 μm (up to 16 μm in Moresnet, Belgium). However, from radiometric dating and modelling of diffusion and heat and flow rates, about 270 Myr ago apparently sphalerite in the Upper Mississippi Valley District was deposited for about 0.25 Myr in layers up to 5 cm total thickness at a rate of about 0.2 μm/a (Barnes, 2015Barnes, H.L. (2015) Hydrothermal processes. Geochemical Perspectives 4, 1-93.
); this conclusion is in agreement with an independent estimation of 0.212 Myr in duration (Rowan and Goldhaber, 1996Rowan, E.L., Goldhaber, M.B. (1996) Fluid inclusions and biomarkers in the Upper Mississippi Valley zinc-lead district: implications for the fluid-flow and thermal history of the Illinois basin. USGS Numbered Series Bulletin 2094F, doi: 10.3133/b2094F.
). The depositional rate of 1-7 μm/a by Roedder (1968)Roedder, E. (1968) The non-colloidal origin of 'colloform' textures in sphalerite ores. Economic Geology 63, 451-471.
is one order of magnitude higher than our result derived from statistical methods. In comparison, the depositional rate by Barnes (2015)Barnes, H.L. (2015) Hydrothermal processes. Geochemical Perspectives 4, 1-93.
of 0.2 μm/a is supported by our estimated depositional rate of 0.27 μm/a. An overview of similar results from other quickly deposited samples and possible modelling of the hydrothermal conditions is summarised in the Supplementary Information.Non-hydrothermal mineral growth paced by astronomically forced climate oscillations has been reported in many Quaternary studies. For example, the Devil Hole, Nevada preserved a thick (>14 cm) layer of calcite that precipitated continuously from calcite supersaturated groundwater over the past 200 kyr with a sedimentation rate of ~0.6-1 μm/a (Moseley et al., 2016
Moseley, G.E., Edwards, R.L., Wendt, K.A., Cheng, H., Dublyansky, Y., Lu, Y., Boch, R., Spötl, C. (2016) Reconciliation of the Devils Hole climate record with orbital forcing. Science 351, 165-168.
). Comparison between δ18O of calcite samples and insolation suggested that the calcite precipitated from groundwater recorded astronomically forced climate.The power spectral analysis suggests changes in the sphalerite deposition rate were dominated by eccentricity and obliquity forcing (Fig. 3). Based on the calculated sphalerite growth rate of 0.2 μm/a, high amplitude ~30 mm and 10 mm periodicities in iron content of this sample were assigned to 150 kyr and 50 kyr cycles, respectively by Mason (1987)
Mason, S.E. (1987) Periodicities in color banding in sphalerite of the Upper Mississippi Valley District. M.S. Thesis. The Pennsylvania State University, Pennsylvania.
, this is roughly comparable to our interpretation. The eccentricity signal is expected because eccentricity forcing controls the extreme seasonal contrasts and thus intensity of precipitation at 105 year scale. Considering the small influence of obliquity in insolation in low latitude region, such as the Upper Mississippi Valley District, the significant obliquity signal must be attributed to the indirect climate response to obliquity forcing. Actually, during the time of the sphalerite deposition at 270 Ma, the Earth was suffering the Late Palaeozoic icehouse (Montañez and Poulsen, 2013Montañez, I.P., Poulsen, C.J. (2013) The Late Paleozoic ice age: an evolving paradigm. Annual Review of Earth and Planetary Sciences 41, 629-656.
). It is widely accepted that the primary climate beat in the Cenozoic icehouse is in the obliquity band, regardless of the location of ice sheets and other boundary conditions; this is because the ice sheets in the polar region are sensitive to high latitude insolation that is controlled by obliquity forcing (Zachos et al., 2001Zachos, J., Pagani, M., Sloan, L., Thomas, E., Billups, K. (2001) Trends, rhythms, and aberrations in global climate 65 Ma to present. Science 292, 686-693.
). Indeed, the obliquity signal in sphalerite banding is not alone; strong obliquity signals are also recorded in a low latitude carbonate succession in South China in 262-269 Ma (Fang et al., 2017Fang, Q., Wu, H., Hinnov, L.A., Jing, X., Wang, X., Yang, T., Li, H., Zhang, S. (2017) Astronomical cycles of Middle Permian Maokou Formation in South China and their implications for sequence stratigraphy and paleoclimate. Palaeogeography, Palaeoclimatology, Palaeoecology 474, 130-139.
). Therefore, the interpretation of the eccentricity and obliquity signals in the sphalerite banding is that astronomically-forced flux of heat and precipitation (cf. Raymo and Nisancioglu, 2003Raymo, M.E., Nisancioglu, K. (2003) The 41 kyr world: Milankovitch's other unsolved mystery. Paleoceanography 18, 1011, doi: 10.1029/2002PA000791.
) drove the penetration of near surface groundwater into deep groundwaters.Groundwater. Deep groundwater is often not formally considered in global Earth system due to a lack of understanding of the mechanism and timescale of groundwater activity. Recent studies of groundwater in the geological past provided insight into fundamental questions such as what the missing link is for reconciling geological evidence of 104 – 106 year scale, high amplitude sea level changes and models of eustasy change during non-glacial times, e.g., in the Early Triassic and the mid-Cretaceous (Wagreich et al., 2014
Wagreich, M., Lein, R., Sames, B. (2014) Eustasy, its controlling factors and the Limno-eustatic hypothesis—concepts inspired by Eduard Suess. Austrian Journal of Earth Sciences 107, 115-131.
; Li et al., 2018aLi, M., Hinnov, L.A., Huang, C., Ogg, J.G. (2018a) Sedimentary noise and sea levels linked to land–ocean water exchange and obliquity forcing. Nature Communications 9, 1004, doi: 10.1038/s41467-018-03454-y.
). However, all these studies relied on indirect estimates of palaeo-lake levels as an indicator of groundwater table and are under a coarse geochronology with a resolution of 105 – 106 year scale.Our study suggests that globally distributed sphalerite banding provides a record of groundwater activities with an ultra-high time resolution. The maximum deposition depth of the sphalerite was about 1 km (Rowan and Goldhaber, 1996
Rowan, E.L., Goldhaber, M.B. (1996) Fluid inclusions and biomarkers in the Upper Mississippi Valley zinc-lead district: implications for the fluid-flow and thermal history of the Illinois basin. USGS Numbered Series Bulletin 2094F, doi: 10.3133/b2094F.
). The banding of sphalerite clearly demonstrates Milankovitch and sub-Milankovitch forcing of climate that have a significant impact on a groundwater reservoir at a depth of up to 1 km. The time to affect a groundwater reservoir significantly after changes in global hydrological cycle is hypothesised to be on the order of 104 – 105 years (Hay and Leslie, 1990Hay, W.W., Leslie, M.A. (1990) Could possible changes in global groundwater reservoir cause eustatic sea-level fluctuations. Sea-Level Change. National Academy Press, Washington D.C., 161-170.
; Li et al., 2018aLi, M., Hinnov, L.A., Huang, C., Ogg, J.G. (2018a) Sedimentary noise and sea levels linked to land–ocean water exchange and obliquity forcing. Nature Communications 9, 1004, doi: 10.1038/s41467-018-03454-y.
). The time scale of deep groundwater activity can be on the order of 103 – 105 years, supporting this hypothesis.top
Conclusions
Statistical analysis of grayscale data of sphalerite in the Upper Mississippi Valley District provides constraints on the mechanism and timing of sphalerite deposition processes. The sphalerite deposition process was paced by Earth’s eccentricity, obliquity, and precession forcing. We propose that the astronomical forcing paced the flux of heat and precipitation that regulated the amount of near surface groundwater. The penetration of deeply circulating groundwater affected the colour banding in the sphalerite via controlling the variation in oxidation state during precipitation. Astronomical forcing has significant impact on the deep (up to 1 km) groundwater at a time scale of 103 – 105 years. This study indicates that sphalerite banding can be used as a fingerprint of groundwater in the geological past. Groundwater is crucial for understanding global sea level change (Gleeson et al., 2016
Gleeson, T., Befus, K.M., Jasechko, S., Luijendijk, E., Cardenas, M.B. (2016) The global volume and distribution of modern groundwater. Nature Geoscience 9, 161-167.
; Li et al., 2018aLi, M., Hinnov, L.A., Huang, C., Ogg, J.G. (2018a) Sedimentary noise and sea levels linked to land–ocean water exchange and obliquity forcing. Nature Communications 9, 1004, doi: 10.1038/s41467-018-03454-y.
), chemical weathering and landscape evolution (Maher and Chamberlain, 2014Maher, K., Chamberlain, C.P. (2014) Hydrologic Regulation of Chemical Weathering and the Geologic Carbon Cycle. Science 343, 1502-1504.
), and this study helps us discern the role of groundwater in the Earth system.top
Acknowledgements
This paper evolved from Scott Mason’s exploration of this problem in his M. S. Thesis in 1987 through advances in district data and in periodicity analyses. Critical reviews of our manuscript by Antonio C. Lasaga and Andrew Sicree led to substantial improvements. We thank editor Eric H. Oelkers, Bruce Yardley, and one anonymous reviewer for their constructive comments.
Editor: Eric H. Oelkers
top
References
Barnes, H.L. (2015) Hydrothermal processes. Geochemical Perspectives 4, 1-93.
 Show in context
 From extensive research by many scientists, a genetic model has been developed for the Upper Mississippi Valley District (review in Barnes, 2015).
View in article
Along that geochemically tracked path, the waters became geothermally heated and collected ore solution components (Barnes, 2015).
View in article
Barnes (2015) concluded that inorganic complexes were insufficiently stable to carry dissolved base metals into these ores.
View in article
However, from radiometric dating and modelling of diffusion and heat and flow rates, about 270 Myr ago apparently sphalerite in the Upper Mississippi Valley District was deposited for about 0.25 Myr in layers up to 5 cm total thickness at a rate of about 0.2 μm/a (Barnes, 2015); this conclusion is in agreement with an independent estimation of 0.212 Myr in duration (Rowan and Goldhaber, 1996).
View in article
In comparison, the depositional rate by Barnes (2015) of 0.2 μm/a is supported by our estimated depositional rate of 0.27 μm/a.
View in article
Berger, A., Loutre, M.-F., Dehant, V. (1989) Pre-quaternary Milankovitch frequencies. Nature, 342, 133.
 Show in context
 Periods of Milankovitch cycles at 270 Ma were 413 kyr, 123 kyr, 95 kyr, 44.3 kyr, 35.1 kyr, 21.0, and 17.6 kyr (Berger et al., 1989).
View in article
Church, J.A., Clark, P.U., Cazenave, A., Gregory, J.M., Jevrejeva, S., Levermann, A., Merrifield, M.A., Milne, G.A., Nerem, R.S., Nunn, P.D., Payne, A.J., Pfeffer, W.T., Stammer, D., Unnikrishnan, A.S. (2013) 2013: Sea Level Change. In: Stocker, T.F., Qin, D., Plattner, G.-K., Tignor, M., Allen, S.K., Boschung, J., Nauels, A., Xia, Y., Bex, V., Midgley, P.M. (Eds.) Climate Change 2013: The Physical Science Basis. Contribution of Working Group I to the Fifth Assessment Report of the Intergovernmental Panel on Climate Change. Cambridge University Press, Cambridge, United Kingdom and New York, NY, USA, 1137-1216.
 Show in context
 However, lack of geological evidence of groundwater activity restricted the understanding of the driving force and timing of groundwater activity and, furthermore, hampered the robustness of the sea level projection by the Intergovernmental Panel on Climate Change (IPCC) (Church et al., 2013).
View in article
Fang, Q., Wu, H., Hinnov, L.A., Jing, X., Wang, X., Yang, T., Li, H., Zhang, S. (2017) Astronomical cycles of Middle Permian Maokou Formation in South China and their implications for sequence stratigraphy and paleoclimate. Palaeogeography, Palaeoclimatology, Palaeoecology 474, 130-139.
 Show in context
 Indeed, the obliquity signal in sphalerite banding is not alone; strong obliquity signals are also recorded in a low latitude carbonate succession in South China in 262-269 Ma (Fang et al., 2017).
View in article
Gleeson, T., Befus, K.M., Jasechko, S., Luijendijk, E., Cardenas, M.B. (2016) The global volume and distribution of modern groundwater. Nature Geoscience 9, 161-167.
 Show in context
 The upper 2 km of continental crust preserves approximately 22.6 million km3 volume of total groundwater, which is equivalent to a 180 m deep layer of flood water if spread evenly across the global land surface (Gleeson et al., 2016).
View in article
Small changes in the volume of groundwater can have significant impacts on the global water balance and lead to large sea level changes (Gleeson et al., 2016).
View in article
Groundwater is crucial for understanding global sea level change (Gleeson et al., 2016; Li et al., 2018a), chemical weathering and landscape evolution (Maher and Chamberlain, 2014), and this study helps us discern the role of groundwater in the Earth system.
View in article
Hay, W.W., Leslie, M.A. (1990) Could possible changes in global groundwater reservoir cause eustatic sea-level fluctuations. Sea-Level Change. National Academy Press, Washington D.C., 161-170.
 Show in context
 The time to affect a groundwater reservoir significantly after changes in global hydrological cycle is hypothesised to be on the order of 104 – 105 years (Hay and Leslie, 1990; Li et al., 2018a).
View in article
Laskar, J., Robutel, P., Joutel, F., Gastineau, M., Correia, A.C.M., Levrard, B. (2004) A long-term numerical solution for the insolation quantities of the Earth. Astronomy & Astrophysics 428, 261-285.
 Show in context
 According to the Milankovitch theory, the Earth’s climate is affected by quasi-periodic changes in Earth orbital parameters which affect the insolation received at the top of the atmosphere at a 104–105 year scale (Laskar et al., 2004).
View in article
Leach, D.L., Taylor, R.D., Fey, D.L., Diehl, S.F., Saltus, R.W. (2010) A deposit model for Mississippi Valley-type lead-zinc ores. Chapter A of mineral deposit models for resource assessment: USGS, Scientific Investigations Report.
 Show in context
 Mississippi Valley Type deposits yield about 24 % of the global commercial zinc and lead resources (Leach et al., 2010).
View in article
Li, M., Hinnov, L.A., Huang, C., Ogg, J.G. (2018a) Sedimentary noise and sea levels linked to land–ocean water exchange and obliquity forcing. Nature Communications 9, 1004, doi: 10.1038/s41467-018-03454-y.
 Show in context
 The hypothesis of groundwater-driven sea level changes might be the most promising interpretation of high amplitude sea level changes at the 104-106 year scale that regulated climate in the greenhouse world with no ice sheet (Wagreich et al., 2014; Li et al., 2018a).
View in article
Recent studies of groundwater in the geological past provided insight into fundamental questions such as what the missing link is for reconciling geological evidence of 104-106 year scale, high amplitude sea level changes and models of eustasy change during non-glacial times, e.g., in the Early Triassic and the mid-Cretaceous (Wagreich et al., 2014; Li et al., 2018a).
View in article
The time to affect a groundwater reservoir significantly after changes in global hydrological cycle is hypothesised to be on the order of 104 – 105 years (Hay and Leslie, 1990; Li et al., 2018a).
View in article
Groundwater is crucial for understanding global sea level change (Gleeson et al., 2016; Li et al., 2018a), chemical weathering and landscape evolution (Maher and Chamberlain, 2014), and this study helps us discern the role of groundwater in the Earth system.
View in article
Li, M., Kump, L.R., Hinnov, L.A., Mann, M.E. (2018b) Tracking variable sedimentation rates and astronomical forcing in Phanerozoic paleoclimate proxy series with evolutionary correlation coefficients and hypothesis testing. Earth and Planetary Science Letters 501, 165-179.
 Show in context
 In order to identify optimal deposition rate and test the null hypothesis (H0) that no astronomical forcing drove oscillations of the colour banding, we ran the statistical methods of correlation coefficient (COCO) (Li et al., 2018b) and TimeOpt (Meyers, 2015).
View in article
Li, M., Hinnov, L., Kump, L. (2019) Acycle: Time-series analysis software for paleoclimate research and education. Computers & Geosciences 127, 12-22.
 Show in context
 A grayscale profile of sphalerite banding (Fig. 2) was digitalised and analysed using Acycle software (Li et al., 2019).
View in article
Maher, K., Chamberlain, C.P. (2014) Hydrologic Regulation of Chemical Weathering and the Geologic Carbon Cycle. Science 343, 1502-1504.
 Show in context
 Groundwater plays an essential role in global water cycles via feedback between groundwater and the climate system (Maher and Chamberlain, 2014).
View in article
Groundwater is crucial for understanding global sea level change (Gleeson et al., 2016; Li et al., 2018a), chemical weathering and landscape evolution (Maher and Chamberlain, 2014), and this study helps us discern the role of groundwater in the Earth system.
View in article
Mason, S.E. (1987) Periodicities in color banding in sphalerite of the Upper Mississippi Valley District. M.S. Thesis. The Pennsylvania State University, Pennsylvania.
 Show in context
 Based on the calculated sphalerite growth rate of 0.2 μm/a, high amplitude ~30 mm and 10 mm periodicities in iron content of this sample were assigned to 150 kyr and 50 kyr cycles, respectively by Mason (1987), this is roughly comparable to our interpretation.
View in article
McLimans, R.K. (1977) Geological, fluid inclusion, and stable isotope studies of the Upper Mississippi Valley zinc-lead district, southwest Wisconsin. PhD Dissertation. The Pennsylvania State University, Pennsylvania.
 Show in context
 The banding was found by McLimans (1977) to be remarkably similar across hundreds of square kilometres.
View in article
McLimans, R.K., Barnes, H.L., Ohmoto, H. (1980) Sphalerite stratigraphy of the upper Mississippi Valley zinc-lead district, southwest Wisconsin. Economic Geology 75, 351-361.
 Show in context
 The colour banding in sphalerite is caused by variation in the FeS content of sphalerite (McLimans et al., 1980).
View in article
The high grayscale value is an indication of a dark coloured mineral with a high FeS content, and vice versa (McLimans et al., 1980).
View in article
Figure 1 [...] Coloured photographs are shown with three growth stages of A (early), B (middle), and C (late) following McLimans et al. (1980).
View in article
Meyers, S.R. (2015) The evaluation of eccentricity‐related amplitude modulation and bundling in paleoclimate data: An inverse approach for astrochronologic testing and time scale optimization. Paleoceanography doi: 10.1002/2015PA002850.
 Show in context
 In order to identify optimal deposition rate and test the null hypothesis (H0) that no astronomical forcing drove oscillations of the colour banding, we ran the statistical methods of correlation coefficient (COCO) (Li et al., 2018b) and TimeOpt (Meyers, 2015).
View in article
Montañez, I.P., Poulsen, C.J. (2013) The Late Paleozoic ice age: an evolving paradigm. Annual Review of Earth and Planetary Sciences 41, 629-656.
 Show in context
 Actually, during the time of the sphalerite deposition at 270 Ma, the Earth was suffering the Late Palaeozoic icehouse (Montañez and Poulsen, 2013).
View in article
Moseley, G.E., Edwards, R.L., Wendt, K.A., Cheng, H., Dublyansky, Y., Lu, Y., Boch, R., Spötl, C. (2016) Reconciliation of the Devils Hole climate record with orbital forcing. Science 351, 165-168.
 Show in context
 For example, the Devil Hole, Nevada preserved a thick (>14 cm) layer of calcite that precipitated continuously from calcite supersaturated groundwater over the past 200 kyr with a sedimentation rate of ~0.6-1 μm/a (Moseley et al., 2016).
View in article
Raymo, M.E., Nisancioglu, K. (2003) The 41 kyr world: Milankovitch's other unsolved mystery. Paleoceanography 18, 1011, doi: 10.1029/2002PA000791.
 Show in context
 Therefore, the interpretation of the eccentricity and obliquity signals in the sphalerite banding is that astronomically-forced flux of heat and precipitation (cf. Raymo and Nisancioglu, 2003) drove the penetration of near surface groundwater into deep groundwaters.
View in article
Roedder, E. (1968) The non-colloidal origin of 'colloform' textures in sphalerite ores. Economic Geology 63, 451-471.
 Show in context
 The colour banding of the sphalerite from the Upper Mississippi Valley District was first suggested to be periodic by Roedder (1968).
View in article
The depositional rate of 1-7 μm/a by Roedder (1968) is one order of magnitude higher than our result derived from statistical methods.
View in article
Rowan, E.L., Goldhaber, M.B. (1996) Fluid inclusions and biomarkers in the Upper Mississippi Valley zinc-lead district: implications for the fluid-flow and thermal history of the Illinois basin. USGS Numbered Series Bulletin 2094F, doi: 10.3133/b2094F.
 Show in context
 The maximum deposition depth was about 1 km, based on palaeostratigraphic reconstruction (Rowan and Goldhaber, 1996).
View in article
However, from radiometric dating and modelling of diffusion and heat and flow rates, about 270 Myr ago apparently sphalerite in the Upper Mississippi Valley District was deposited for about 0.25 Myr in layers up to 5 cm total thickness at a rate of about 0.2 μm/a (Barnes, 2015); this conclusion is in agreement with an independent estimation of 0.212 Myr in duration (Rowan and Goldhaber, 1996).
View in article
The maximum deposition depth of the sphalerite was about 1 km (Rowan and Goldhaber, 1996).
View in article
Sicree, A.A., Barnes, H.L. (1996) Upper Mississippi Valley district ore fluid model: the role of organic complexes. Ore Geology Reviews 11, 105-131.
 Show in context
 With alternative, unspecified organic ligands L, that could have complexed the (Zn, Fe)S, a schematic reaction may be proposed for deposition by oxidation as in Sicree and Barnes (1996):
View in article
Wagreich, M., Lein, R., Sames, B. (2014) Eustasy, its controlling factors and the Limno-eustatic hypothesis—concepts inspired by Eduard Suess. Austrian Journal of Earth Sciences 107, 115-131.
 Show in context
 The hypothesis of groundwater-driven sea level changes might be the most promising interpretation of high amplitude sea level changes at the 104-106 year scale that regulated climate in the greenhouse world with no ice sheet (Wagreich et al., 2014; Li et al., 2018a).
View in article
Recent studies of groundwater in the geological past provided insight into fundamental questions such as what the missing link is for reconciling geological evidence of 104-106 year scale, high amplitude sea level changes and models of eustasy change during non-glacial times, e.g., in the Early Triassic and the mid-Cretaceous (Wagreich et al., 2014; Li et al., 2018a).
View in article
Zachos, J., Pagani, M., Sloan, L., Thomas, E., Billups, K. (2001) Trends, rhythms, and aberrations in global climate 65 Ma to present. Science 292, 686-693.
 Show in context
 It is widely accepted that the primary climate beat in the Cenozoic icehouse is in the obliquity band, regardless of the location of ice sheets and other boundary conditions; this is because the ice sheets in the polar region are sensitive to high latitude insolation that is controlled by obliquity forcing (Zachos et al., 2001).
View in article
top
Supplementary Information
The Supplementary Information includes:
- Materials and Methods
- Supplementary Text
- Tables S-1 and S-2
- Figures S-1 to S-12
- Supplementary Information References
Download the Supplementary Information (PDF).
Figures and Tables
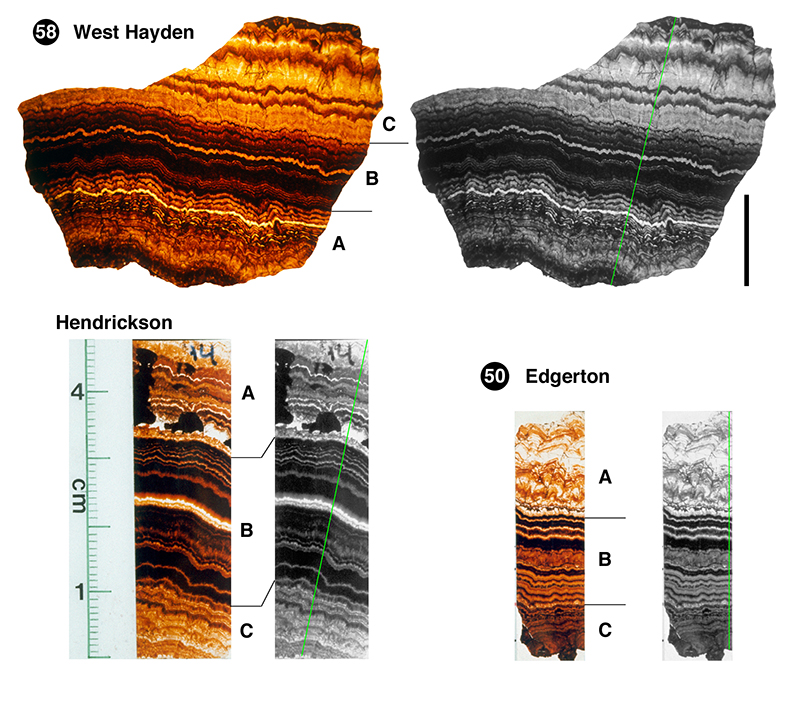
Figure 1 Sphalerite samples from West Hayden, Hendrickson, and Edgerton orebodies. Coloured photographs are shown with three growth stages of A (early), B (middle), and C (late) following McLimans et al. (1980)
McLimans, R.K., Barnes, H.L., Ohmoto, H. (1980) Sphalerite stratigraphy of the upper Mississippi Valley zinc-lead district, southwest Wisconsin. Economic Geology 75, 351-361.
. The rock colour grayscale profile was measured along the traverse (green) in grayscale images. Length of the black bar is 2 cm. Samples from Hendrickson and Edgerton orebodies share the same scale.
Figure 2 Grayscale trace of a cross section of sphalerite (black) and its linear trend (purple). De-trended data (gray) are shown with its 32 mm (dashed red) and 9 mm (solid blue) Gauss bandpass filtered cycles (passband: 0.031 ± 0.008 and 0.11 ± 0.02 cycles/mm, respectively).
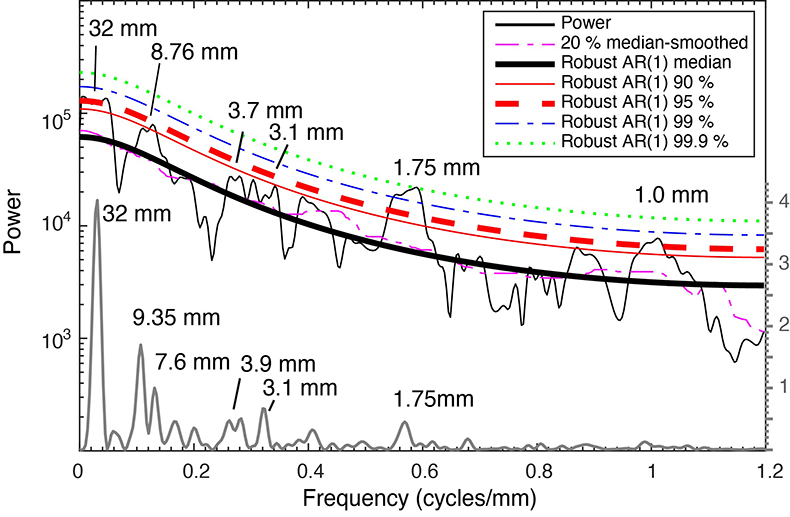
Figure 3 2π MTM power spectrum (thin black) and periodogram (gray) of the grayscale series shown with robust red-noise models. The red-noise fit to the spectrum is based on the best fit to the log power of the 20 % median smoothed spectrum (dashed pink). The 90 % (solid red), 95 % (dashed red), 99 % (blue dashed line), and 99.9 % (dot green) confidence limits are shown. Cycle wavelengths are also marked.
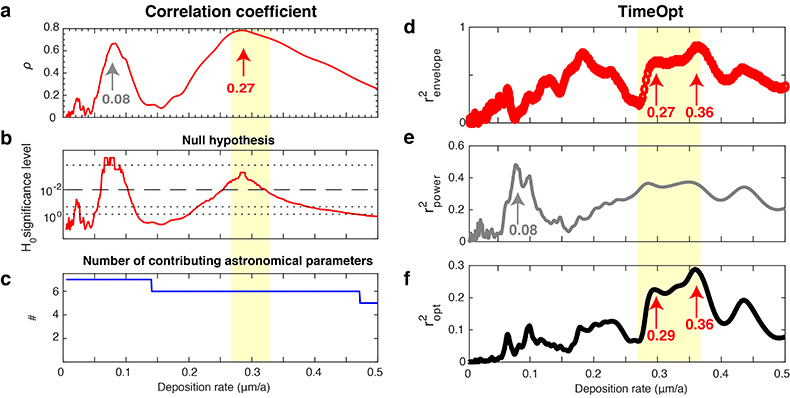
Figure 4 Sphalerite deposition rate. (a) The COCO analysis shows optimal deposition rate at 0.27 μm/a. (b) Null hypothesis testing of the data series indicates that 0.08 μm/a and 0.27 μm/a deposition rates have significance levels less than 1 %. (c) Number of contributing astronomical parameters. (d) Squared correlation coefficient for the amplitude envelope fit (r2envelope) and (e) the spectral power fit (r2power). (f) Combined envelope and spectral power fit (r2opt) at test deposition rate.


