


Tracing ‘Third Pole’ ice meltwater contribution to the Himalayan rivers using oxygen and hydrogen isotopes
Affiliations | Corresponding Author | Cite as | Funding informationPublished by the European Association of Geochemistry
under Creative Commons License CC BY-NC-ND 4.0
Keywords: glacier ice meltwater contribution, total glacier ice mass loss across the Himalaya, stable water isotope mixing model, water sources of large Asian rivers, third pole glaciers


- Share this article


Article views:962Cumulative count of HTML views and PDF downloads.
- Download Citation
- Rights & Permissions

top
Abstract
Figures and Tables
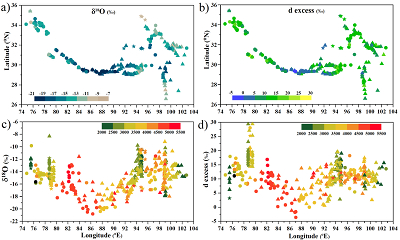 Figure 1 Variability of (a) δ18O and (b) d excess of riverwater samples across the Himalayan region. Elevation-wise variability of (c) δ18O, and (d) d excess (colour coded, in metres a.m.s.l). Pre-monsoon samples are represented by triangles, monsoon samples by circles and post-monsoon samples by star symbols. | 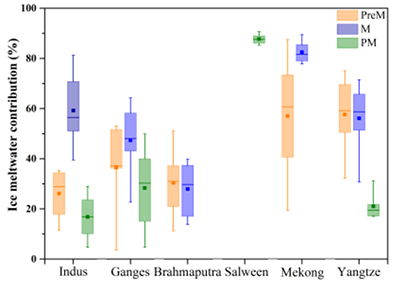 Figure 2 Variability of ice meltwater contribution (in %) to the total river flow of Indus, Ganges, Brahmaputra, Mekong, and Yangtze rivers in pre-monsoon (Pre-M), monsoon (M) and post-monsoon (PM) months. Whisker plots show mean (filled square), median (thick line) interquartile range (shaded) and 5th to 95th percentile (whiskers) as minimum and maximum values. |  Figure 3 Calculated relative fractions (%) of ice meltwater, precipitation, and groundwater to the total streamflow of rivers Indus, Ganges, Brahmaputra, Salween, Mekong and Yangtze in pre-monsoon (triangles), monsoon (circles) and post-monsoon (stars). The colour represents elevation in metres a.m.s.l. |
| Figure 1 | Figure 2 | Figure 3 |
top
Introduction
The glaciated region over the Himalaya and surrounding, the third largest on Earth and referred to as the “Third Pole”, feeds many large river systems including the Indus, the Ganges, the Brahmaputra, the Salween, the Mekong, and the Yangtze (Fig. S-1). Over the past decade, it has become clear that the Himalayan glaciers are shrinking (Bolch et al., 2012
Bolch, T., Kulkarni, A., Kääb, A., Huggel, C., Paul, F., Cogley, J.G., Frey, H., Kargel, J.S., Fujita, K., Scheel, M., Bajracharya, S., Stoffel, M. (2012) The State and Fate of Himalayan Glaciers. Science 336, 310-314.
; Shrestha et al., 2015Shrestha, A.B., Aggarwal, N.K., Alfthan, B., Bajracharya, S.R., Maréchal, J., van Oort, B. (2015) The Himalayan Climate and Water Atlas: Impact of climate change on water resources in five of Asia’s major river basins. ICIMOD, GRID-Arendal and CICERO, Kathmandu, Nepal.
) raising questions about their ability to sustain the freshwater supply that meets the demands of 800 million people in SE Asia. The concern is particularly significant during the drought years, as melted glacier ice, hereafter referred to as “ice meltwater” is considered a drought resilient water source (Shrestha et al., 2015Shrestha, A.B., Aggarwal, N.K., Alfthan, B., Bajracharya, S.R., Maréchal, J., van Oort, B. (2015) The Himalayan Climate and Water Atlas: Impact of climate change on water resources in five of Asia’s major river basins. ICIMOD, GRID-Arendal and CICERO, Kathmandu, Nepal.
).To understand glacier sustainability, attempts have been made to quantify the annual glacial mass loss mostly using remote sensed data and related modelling techniques (Cogley, 2012
Cogley, J.G. (2012) Climate science: Himalayan glaciers in the balance. Nature 488, 468-469.
) such as airborne and satellite laser altimetry (Jacob et al., 2012Jacob, T., Wahr, J., Pfeffer, W.T., Swenson, S. (2012) Recent contributions of glaciers and ice caps to sea level rise. Nature 482, 514-518.
; Kääb et al., 2012Kääb, A., Berthier, E., Nuth, C., Gardelle, J., Arnaud, Y. (2012) Contrasting patterns of early twenty-first-century glacier mass change in the Himalayas. Nature 488, 495-498.
), space gravimetry using data from Gravity Recovery and Climate Experiment (GRACE), Ice, Cloud, and land Elevation Satellite (ICESat) missions (Gardner et al., 2013Gardner, A., Moholdt, G., Graham Cogley, J., Wouters, B., Arendt, A., Wahr, J., Berthier, E., Hock, R., Pfeffer, W., Kaser, G., Ligtenberg, S., Bolch, T., Sharp, M., Hagen, J., Van den Broeke, M., Paul, F. (2013) A Reconciled Estimate of Glacier Contributions to Sea Level Rise: 2003 to 2009. Science 340, 852-857.
), and digital elevation models (Gardelle et al., 2013Gardelle, J., Berthier, E., Arnaud, Y., Kääb, A. (2013) Region-wide glacier mass balances over the Pamir-Karakoram-Himalaya during 1999-2011. The Cryosphere 7, 1263-1286.
). While these estimates provide important insight into the glacial mass loss problem, they have a considerable disagreement (Table S-1). Moreover, remote sensing glacier mass loss estimation takes into account both mass gain (accumulation) and mass loss (ablation) in a balance year, and this net loss estimate cannot be directly converted to volumetric ice meltwater flow in rivers. For example, a glacier releasing as much ice meltwater during summer as it gains through the accumulation of snow during winter will be at a zero net mass loss, although, the glacier might have released a substantial amount of ice meltwater to the river network. Therefore, we need to quantify the total ice mass loss (just the ablation) to understand better the glacier-river linkages and to assess further the impact of ice meltwater on downstream ecosystem services.To understand the snow meltwater and the ice meltwater contribution to Himalayan rivers, we additionally rely on various cryospheric-hydrological models (Kaser et al., 2010
Kaser, G., Großhauser, M., Marzeion, B. (2010) Contribution potential of glaciers to water availability in different climate regimes. Proceedings of the National Academy of Sciences 107, 20223-20227.
; Lutz et al., 2014Lutz, A.F., Immerzeel, W.W., Shrestha, A.B., Bierkens, M.F.P. (2014) Consistent increase in High Asia's runoff due to increasing glacier melt and precipitation. Nature Climate Change 4, 587-592.
). However, hydrological modelling derived estimates of source end member contributions to the Himalayan rivers show considerable disagreement and it is also difficult to compare the results from different studies due to lack of homogeneity in the consideration of source end members (Table S-2). Therefore, there is a clear need to develop new techniques that could quantify the water source end member contributions to streamflow and determine the river dependence on the non-renewable source, the glacier ice. Additionally, it would help to understand the limitations of different approaches and improve our understanding of the regional scale basin hydrology.top
Approaching the Problem
In this study, we quantified the total ice meltwater, precipitation (snow meltwater and rainfall), and groundwater contributions to streamflow in the headwaters (>2000 m above mean sea level (a.m.s.l)) of the rivers Indus, Ganges, Brahmaputra, Salween, Mekong, and Yangtze. The contributions of ice meltwater, precipitation, and groundwater to the river were assessed using stable water oxygen and hydrogen isotopes, which are considered to be excellent tracers to “fingerprint” water sources in streams and rivers because they are fractionated by natural hydrological processes (Gat, 1996
Gat, J.R. (1996) Oxygen and hydrogen isotopes in the hydrologic cycle. Annual Review of Earth and Planetary Sciences 24, 225-262.
; Klaus and McDonnell, 2013Klaus, J., McDonnell, J.J. (2013) Hydrograph separation using stable isotopes: Review and evaluation. Journal of Hydrology 505, 47-64.
; Frenierre and Mark, 2014Frenierre, J.L., Mark, B.G. (2014) A review of methods for estimating the contribution of glacial meltwater to total watershed discharge. Progress in Physical Geography 38, 173-200.
). Using isotope mixing models, it is thus possible to quantify the fractional contributions from each water source end member (for review see Klaus and McDonnell, 2013Klaus, J., McDonnell, J.J. (2013) Hydrograph separation using stable isotopes: Review and evaluation. Journal of Hydrology 505, 47-64.
). A basin and season specific three component isotope mixing model was developed using the δ18O and deuterium excess (expressed as d excess, calculated following Dansgaard (1964)Dansgaard, W. (1964) Stable isotopes in precipitation. Tellus 16, 436-468.
as d = δD – 8×δ18O) composition of riverwater samples, glacier ice, precipitation, and groundwater. We emphasise that our model treats the rain and the snow meltwater as a single component – precipitation, due to overlapping isotope compositions (Fig. S-2) and the reasons behind combining them is justified in the Supplementary Information (Section S-1.2). A detailed description of the mixing model and the model assumptions is given by Boral et al. (2019)Boral, S., Sen, I.S., Ghosal, D., Peucker-Ehrenbrink, B., Hemingway, J. (2019) Stable water isotope modeling reveals spatio-temporal variability of glacier meltwater contributions to Ganges River headwaters. Journal of Hydrology 577, 123983.
and further discussed in the Supplementary Information.top
Results and Discussion
Tracing δ18O and d excess in space and time. δ18O and d excess values of riverwater show large variability with latitude, longitude, elevation, and season (Fig. 1). Significant δ18O and d excess variability was also observed intra-season along the individual course of a river (Fig. 1c,d). The river samples are a mixture of water coming from different source end members, and these end members undergo various processes after their formation and when contributing to the streams. For instance, snowpacks undergo recrystallisation during the firnisation process, which changes the original composition of the snow that was governed by atmospheric parameters (Arnason, 1981
Arnason, B. (1981) Ice and Snow Hydrology. In: Gat, J.R., Gonfiantini, R. (Eds.) Stable Isotopic Hydrology: Deuterium and Oxygen-18 in the water cycle. IAEA Technical report, volume 210, 143-175.
). Again, during heavy rainfall events that are common in the southern slopes of the Himalaya, the isotope compositions are more depleted when compared to equilibrium rainfall (Gat, 1996Gat, J.R. (1996) Oxygen and hydrogen isotopes in the hydrologic cycle. Annual Review of Earth and Planetary Sciences 24, 225-262.
). The stable water isotope compositions of rainfall are complex as they get affected by evaporation, intensity, and intermittency of rainfall. Therefore, the relationship between δ18O and δD of river samples with elevation and latitude is complex and does not show a specific trend with latitude and elevation (Fig. 1).In general, δ18O compositions of riverwater become progressively heavier from higher to lower elevation but without a good correlation (Figs. 1c, S-3). This is because of the progressively decreasing contribution from the ice meltwater (the most isotopically light composition) as the distance from the glaciers increases. Deuterium excess values of riverwater lie mostly between 7 to 20 ‰, with the Ganges basin having the highest d excess values and monsoon samples from high elevation headwaters of the Brahmaputra show the lowest d excess values (Fig. 1b,d). The δ18O and δD compositions of riverwater fall above the global meteoric water line (GWML) and the best fit riverwater line in the Himalayan region has a slope = 9.27 ± 0.10 and deuterium intercept = 30.12 ± 1.50 ‰ through all data points and is described by positive d excess values (Fig. S-4).
Figure 1 Variability of (a) δ18O and (b) d excess of riverwater samples across the Himalayan region. Elevation-wise variability of (c) δ18O, and (d) d excess (colour coded, in metres a.m.s.l). Pre-monsoon samples are represented by triangles, monsoon samples by circles and post-monsoon samples by star symbols.
Quantifying the contributions to river flow and its attendant ice mass loss. Results from the δ18O–d excess mixing model show that the source end member contributions to the rivers show large variability over space and time (Table S-3). The seasonal variability of ice meltwater contributions to the studied rivers are presented in Figure 2. The average (± one standard deviation of all samples) ice meltwater contributions to the Indus were 26 ± 10 %, 58 ± 14 %, and 17 ± 14 % for the pre-monsoon, monsoon and post-monsoon months, respectively. Like the Indus, the Ganges and its studied tributaries, namely the Kosi, and the Gandak had higher ice meltwater contribution in the monsoon (47 ± 14 %) as compared to the pre-monsoon (36 ± 18 %) and the post-monsoon (28 ± 15 %). However, the Brahmaputra and the Yangtze had similar ice meltwater contributions in the pre-monsoon (31 ± 13 % and 59 ± 14 % respectively) and the monsoon (28 ± 10 % and 57 ± 14% respectively). This observation is contrary to conventional understanding that ice meltwater proportions are highest during the pre-monsoon or summer months due to elevated temperatures and therefore higher ice meltwater runoff. This observation can be explained by several mechanisms such as a larger snow covered area during pre-monsoon period causing reduced ice meltwater flow in pre-monsoon, a time lag between ice meltwater production and transport, the volumetric effect between the monsoon and pre-monsoon period, and the impact of monsoonal rainfall on ice meltwater runoff, due to “rain-induced glacier ice melting” (Boral et al., 2019
Boral, S., Sen, I.S., Ghosal, D., Peucker-Ehrenbrink, B., Hemingway, J. (2019) Stable water isotope modeling reveals spatio-temporal variability of glacier meltwater contributions to Ganges River headwaters. Journal of Hydrology 577, 123983.
). The ice meltwater contribution in Salween River was 88 ± 2 % in October and for Mekong River it was 59 ± 22 % between May to August.Figure 2 Variability of ice meltwater contribution (in %) to the total river flow of Indus, Ganges, Brahmaputra, Mekong, and Yangtze rivers in pre-monsoon (Pre-M), monsoon (M) and post-monsoon (PM) months. Whisker plots show mean (filled square), median (thick line) interquartile range (shaded) and 5th to 95th percentile (whiskers) as minimum and maximum values.
Source end member contributions to discharge also showed significant spatial variability (Fig. 3). The calculated ice meltwater proportion increases with proximity to the glacier. For example, in the Bhagirathi (source of Ganges River, Table S-3), the calculated ice meltwater contribution on a sample collected on 24th August 2015 was 63 % and 52 % at distances of 18 km and 49 km, respectively, from the glacier snout. The discharge weighted average (April to November) ice meltwater contributions above 2000 m a.m.s.l. varies between 47 ± 13 % in the Indus, 44 ± 13 % in the Ganges, and 29 ± 10 % in the Brahmaputra (Table S-2) and 50 ± 11 % in the Yangtze.
Figure 3 Calculated relative fractions (%) of ice meltwater, precipitation, and groundwater to the total streamflow of rivers Indus, Ganges, Brahmaputra, Salween, Mekong and Yangtze in pre-monsoon (triangles), monsoon (circles) and post-monsoon (stars). The colour represents elevation in metres a.m.s.l.
We compared ice meltwater contributions from our field-based stable isotope modelling approach with estimates obtained from other studies (Table S-2). For the Indus, the Ganges and the Brahmaputra, our source end member contributions are similar to previous estimates. However, our estimates of water source fractions for the rivers Mekong, Salween, and Yangtze are very high when compared to estimates from Lutz et al. (2014)
Lutz, A.F., Immerzeel, W.W., Shrestha, A.B., Bierkens, M.F.P. (2014) Consistent increase in High Asia's runoff due to increasing glacier melt and precipitation. Nature Climate Change 4, 587-592.
. This disagreement could be the result of a different size of the considered catchment area, different clustering of the end members, or due to the lack of comprehensive δ18O and d excess dataset of riverwater and end members. Therefore, estimates obtained in the Mekong, the Salween, and the Yangtze basins may include large uncertainties and need to be further investigated with year round δ18O and δD data of riverwater and the end members to make the “fingerprinting” approach more robust. Thus, estimates obtained for the Mekong, Salween and Yangtze basins were not considered in the regional scale total ice mass loss assessment.Similar to ice meltwater contributions, precipitation contributions show high seasonal variability (Fig. 3). However, since we could not distinguish between the rainfall and the snow meltwater contributions separately in the precipitation component, we could only surmise that snow meltwater would be the dominant contributor during pre-monsoon and post-monsoon whereas rainfall will dominate during the monsoon. Precipitation fractions do not show any systematic spatial variability (Fig. 3), for example, pre-monsoon samples from the tributaries of the Brahmaputra between 93 to 96 °E show high variability ranging from 20 % up to 80 %. Such variability probably indicates the proximity of sampling sites to the nearby seasonal snowpacks during the early melting season.
In the case of groundwater contributions, basin specific seasonal fluctuations were observed. For example, in the Indus basin groundwater contribution was highest during the pre-monsoon (37 ± 7 %) compared to the monsoon (22 ± 10 %) and the post-monsoon (18 ± 13 %), while in the Yangtze basin, groundwater contribution was highest during the post-monsoon (34 ± 8 %) followed by pre-monsoon (20 ± 9 %) and monsoon (16 ± 6 %). Of all the studied rivers, the Brahmaputra basin showed the highest spatial variability in terms of groundwater contribution during the pre-monsoon with the average ± one standard deviation being 39 ± 18 % (n = 101) (Fig. 3). For other river basins the groundwater contribution was high during the pre-monsoon and post-monsoon but below 50 % of the total streamflow.
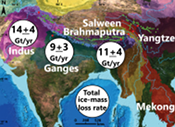
The total estimated annual glacier ice mass contribution to the rivers Indus, Ganges, and Brahmaputra above 2000 m a.m.s.l. were 13.5 ± 4.2 Gt yr-1, 8.7 ± 2.9 Gt yr-1, and 11.2 ± 4.1 Gt yr-1, respectively. The cumulative ice mass loss from the Himalaya to support these river basins is estimated to be 33.5 ± 6.5 Gt yr-1. This estimate of ice mass loss from the Indus, the Ganges, and the Brahmaputra basins is quite high when compared to net mass loss estimates from remote sensing studies (Table S-1). For example, using satellite altimetry data, Kääb et al. (2015)
Kääb, A., Treichler, D., Nuth, C., Berthier, E. (2015) Brief Communication: Contending estimates of 2003-2008 glacier mass balance over the Pamir–Karakoram–Himalaya. The Cryosphere 9, 557-564.
estimated the glacier mass loss from the Indus, the Ganges, and the Brahmaputra basins to be 23.7 ± 2.1 Gt yr-1, whereas for the entire Hindukush Karakoram Himalaya (HKH) region, Brun et al. (2017)Brun, F., Berthier, E., Wagnon, P., Kääb, A., Treichler, D. (2017) A spatially resolved estimate of High Mountain Asia glacier mass balances from 2000 to 2016. Nature Geoscience 10, 668-673.
reported a mass loss of 16.3 ± 3.5 Gt yr-1. The large discrepancies between the two approaches are because remote sensing quantifies the net mass loss, i.e. the balance between accumulation and ablation, whereas our method quantifies the total ice mass loss due to ablation that goes into sustaining these rivers. Therefore, a direct comparison would be inappropriate and misleading. It is also likely that not all ice meltwater that is captured by streams and river outlets is lost, as some part of it is also gets stored in high altitude lakes (Che et al., 2014Che, T., Xiao, L., Liou, Y.A. (2014) Changes in Glaciers and Glacial Lakes and the Identification of Dangerous Glacial Lakes in the Pumqu River Basin, Xizang (Tibet). Advances in Meteorology 8, doi: 10.1155/2014/903709.
), and recharges groundwater reservoirs (Zhang et al., 2017Zhang, G., Yao, T., Shum, C.K., Yi, S., Yang, K., Xie, H., Feng, W., Bolch, T., Wang, L., Behrangi, A., Zhang, H., Wang, W., Xiang, Y., Yu, J. (2017) Lake volume and groundwater storage variations in Tibetan Plateau's endorheic basin. Geophysical Research Letters 44, 5550-5560.
). We also note that we did not take into account many significantly smaller rivers fed by smaller glaciers due to the lack of availability of relevant data. We therefore suggest that our estimated ice mass wastage is conservative, and conclude that the glaciers in the Indus, the Ganges, and the Brahmaputra basins are releasing ice meltwater that corresponds to a minimum of 33.5 ± 6.5 Gt yr-1 of melted ice mass.Limitations and challenges of our approach. In addition to the model assumptions, the unavailability of comprehensive end member datasets will also introduce a potential for bias in the results. Contemporary datasets of riverwater, glacier ice, precipitation, groundwater, and corresponding discharge data of the rivers were also missing since the datasets were compiled from available peer reviewed publications. We also did not have access to rainfall and runoff data in individual river basins to carry out an approximate (as our precipitation fraction includes a snow meltwater component) comparison with the precipitation fraction in the rivers. Due to the unavailability of a third independent and conservative tracer we could not separately quantify the contributions from rain and snow meltwater. We acknowledge that accurate representation of the end member δ18O and d excess ranges that are basin and season specific, the use of long term area and/or volume weighted averages of rainfall data, incorporation of new conservative tracers, and contemporary datasets would have been ideal to minimise the uncertainty and biases. Further, continuous year round riverwater data is ideal to reduce the uncertainty in quantifying the average ice meltwater contributions to the rivers, and its attendant ice mass loss. However, data collection in this high altitude mountainous region across five countries is challenging and we will therefore depend on judicious assumptions to minimise the uncertainty or include the uncertainties in the model.
top
Conclusions
We show that discharge weighted average ice meltwater contribution in headwaters of the Indus, the Ganges, and the Brahmaputra, varied between 47 ± 13 %, 44 ± 13 %, and 29 ± 10 %, respectively, which is equivalent to 33.5 ± 6.5 Gt yr-1 of melted ice mass. Our estimates of ice meltwater fractions in Himalayan watershed are useful to understand the river dependence on the glaciers and envision the impact of climate change on the water resources especially in mountainous terrains. It is noteworthy that this is the first study that has used stable water isotope data to quantify the spatial distribution of ice meltwater runoff over a regional scale, and its attendant ice mass loss. This study calls for additional assessment of stable water isotope data to quantify the volumetric flow of ice meltwater in Himalayan sourced rivers, which has the potential to support other estimates independently and improve our understanding of regional scale hydrology.
top
Acknowledgements
SB is thankful for the Ph.D. scholarship at the Indian Institute of Technology Kanpur. ISS acknowledges financial support from the Ministry of Earth Sciences (MoES), Government of India Grant Number MoES/PAMC/H&C/79/2016-PC-II. We thank the anonymous reviewers for their insightful comments and for improving the presentation of the manuscript. We are grateful to Eric H. Oelkers for advice, language editing, and editorial handling.
Editor: Eric H. Oelkers
top
References
Arnason, B. (1981) Ice and Snow Hydrology. In: Gat, J.R., Gonfiantini, R. (Eds.) Stable Isotopic Hydrology: Deuterium and Oxygen-18 in the water cycle. IAEA Technical report, volume 210, 143-175.
 Show in context
 For instance, snowpacks undergo recrystallisation during the firnisation process, which changes the original composition of the snow that was governed by atmospheric parameters (Arnason, 1981).
View in article
Bolch, T., Kulkarni, A., Kääb, A., Huggel, C., Paul, F., Cogley, J.G., Frey, H., Kargel, J.S., Fujita, K., Scheel, M., Bajracharya, S., Stoffel, M. (2012) The State and Fate of Himalayan Glaciers. Science 336, 310-314.
Show in contextOver the past decade, it has become clear that the Himalayan glaciers are shrinking (Bolch et al., 2012; Shrestha et al., 2015) raising questions about their ability to sustain the freshwater supply that meets the demands of 800 million people in SE Asia.
View in article
Boral, S., Sen, I.S., Ghosal, D., Peucker-Ehrenbrink, B., Hemingway, J. (2019) Stable water isotope modeling reveals spatio-temporal variability of glacier meltwater contributions to Ganges River headwaters. Journal of Hydrology 577, 123983.
Show in context A detailed description of the mixing model and the model assumptions is given by Boral et al. (2019) and further discussed in the Supplementary Information.
View in article
This observation can be explained by several mechanisms such as a larger snow covered area during pre-monsoon period causing reduced ice meltwater flow in pre-monsoon, a time lag between ice meltwater production and transport, the volumetric effect between the monsoon and pre-monsoon period, and the impact of monsoonal rainfall on ice meltwater runoff, due to “rain-induced glacier ice melting” (Boral et al., 2019).
View in article
Brun, F., Berthier, E., Wagnon, P., Kääb, A., Treichler, D. (2017) A spatially resolved estimate of High Mountain Asia glacier mass balances from 2000 to 2016. Nature Geoscience 10, 668-673.
Show in context For example, using satellite altimetry data, Kääb et al. (2015) estimated the glacier mass loss from the Indus, the Ganges, and the Brahmaputra basins to be 23.7 ± 2.1 Gt yr-1, whereas for the entire Hindukush Karakoram Himalaya (HKH) region, Brun et al. (2017) reported a mass loss of 16.3 ± 3.5 Gt yr-1.
View in article
Che, T., Xiao, L., Liou, Y.A. (2014) Changes in Glaciers and Glacial Lakes and the Identification of Dangerous Glacial Lakes in the Pumqu River Basin, Xizang (Tibet). Advances in Meteorology 8, doi: 10.1155/2014/903709.
Show in contextIt is also likely that not all ice meltwater that is captured by streams and river outlets is lost, as some part of it is also gets stored in high altitude lakes (Che et al., 2014), and recharges groundwater reservoirs (Zhang et al., 2017).
View in article
Cogley, J.G. (2012) Climate science: Himalayan glaciers in the balance. Nature 488, 468-469.
Show in context To understand glacier sustainability, attempts have been made to quantify the annual glacial mass loss mostly using remote sensing data and related modelling techniques (Cogley, 2012) such as airborne and satellite laser altimetry (Jacob et al., 2012; Kääb et al., 2012), space gravimetry using data from Gravity Recovery and Climate Experiment (GRACE), Ice, Cloud, and land Elevation Satellite (ICESat) missions (Gardner et al., 2013), and digital elevation models (Gardelle et al., 2013).
View in article
Dansgaard, W. (1964) Stable isotopes in precipitation. Tellus 16, 436-468.
Show in context A basin and season specific three component isotope mixing model was developed using the δ18O and deuterium excess (expressed as d excess, calculated following Dansgaard (1964) as d = δD – 8×δ18O) composition of riverwater samples, glacier ice, precipitation, and groundwater.
View in article
Frenierre, J.L., Mark, B.G. (2014) A review of methods for estimating the contribution of glacial meltwater to total watershed discharge. Progress in Physical Geography 38, 173-200.
Show in context The contributions of ice meltwater, precipitation, and groundwater to the river were assessed using stable water oxygen and hydrogen isotopes, which are considered to be excellent tracers to “fingerprint” water sources in streams and rivers because they are fractionated by natural hydrological processes (Gat, 1996; Klaus and McDonnell, 2013; Frenierre and Mark, 2014).
View in article
Gardelle, J., Berthier, E., Arnaud, Y., Kääb, A. (2013) Region-wide glacier mass balances over the Pamir-Karakoram-Himalaya during 1999-2011. The Cryosphere 7, 1263-1286.
Show in context To understand glacier sustainability, attempts have been made to quantify the annual glacial mass loss mostly using remote sensing data and related modelling techniques (Cogley, 2012) such as airborne and satellite laser altimetry (Jacob et al., 2012; Kääb et al., 2012), space gravimetry using data from Gravity Recovery and Climate Experiment (GRACE), Ice, Cloud, and land Elevation Satellite (ICESat) missions (Gardner et al., 2013), and digital elevation models (Gardelle et al., 2013).
View in article
Gardner, A., Moholdt, G., Graham Cogley, J., Wouters, B., Arendt, A., Wahr, J., Berthier, E., Hock, R., Pfeffer, W., Kaser, G., Ligtenberg, S., Bolch, T., Sharp, M., Hagen, J., Van den Broeke, M., Paul, F. (2013) A Reconciled Estimate of Glacier Contributions to Sea Level Rise: 2003 to 2009. Science 340, 852-857.
Show in contextTo understand glacier sustainability, attempts have been made to quantify the annual glacial mass loss mostly using remote sensing data and related modelling techniques (Cogley, 2012) such as airborne and satellite laser altimetry (Jacob et al., 2012; Kääb et al., 2012), space gravimetry using data from Gravity Recovery and Climate Experiment (GRACE), Ice, Cloud, and land Elevation Satellite (ICESat) missions (Gardner et al., 2013), and digital elevation models (Gardelle et al., 2013).
View in article
Gat, J.R. (1996) Oxygen and hydrogen isotopes in the hydrologic cycle. Annual Review of Earth and Planetary Sciences 24, 225-262.
Show in contextThe contributions of ice meltwater, precipitation, and groundwater to the river were assessed using stable water oxygen and hydrogen isotopes, which are considered to be excellent tracers to “fingerprint” water sources in streams and rivers because they are fractionated by natural hydrological processes (Gat, 1996; Klaus and McDonnell, 2013; Frenierre and Mark, 2014).
View in article
Again, during heavy rainfall events that are common in the southern slopes of the Himalaya, the isotope compositions are more depleted when compared to equilibrium rainfall (Gat, 1996).
View in article
Jacob, T., Wahr, J., Pfeffer, W.T., Swenson, S. (2012) Recent contributions of glaciers and ice caps to sea level rise. Nature 482, 514-518.
Show in context To understand glacier sustainability, attempts have been made to quantify the annual glacial mass loss mostly using remote sensing data and related modelling techniques (Cogley, 2012) such as airborne and satellite laser altimetry (Jacob et al., 2012; Kääb et al., 2012), space gravimetry using data from Gravity Recovery and Climate Experiment (GRACE), Ice, Cloud, and land Elevation Satellite (ICESat) missions (Gardner et al., 2013), and digital elevation models (Gardelle et al., 2013).
View in article
Kääb, A., Berthier, E., Nuth, C., Gardelle, J., Arnaud, Y. (2012) Contrasting patterns of early twenty-first-century glacier mass change in the Himalayas. Nature 488, 495-498.
Show in contextTo understand glacier sustainability, attempts have been made to quantify the annual glacial mass loss mostly using remote sensing data and related modelling techniques (Cogley, 2012) such as airborne and satellite laser altimetry (Jacob et al., 2012; Kääb et al., 2012), space gravimetry using data from Gravity Recovery and Climate Experiment (GRACE), Ice, Cloud, and land Elevation Satellite (ICESat) missions (Gardner et al., 2013), and digital elevation models (Gardelle et al., 2013).
View in article
Kääb, A., Treichler, D., Nuth, C., Berthier, E. (2015) Brief Communication: Contending estimates of 2003-2008 glacier mass balance over the Pamir–Karakoram–Himalaya. The Cryosphere 9, 557-564.
Show in context For example, using satellite altimetry data, Kääb et al. (2015) estimated the glacier mass loss from the Indus, the Ganges, and the Brahmaputra basins to be 23.7 ± 2.1 Gt yr-1, whereas for the entire Hindukush Karakoram Himalaya (HKH) region, Brun et al. (2017) reported a mass loss of 16.3 ± 3.5 Gt yr-1.
View in article
Kaser, G., Großhauser, M., Marzeion, B. (2010) Contribution potential of glaciers to water availability in different climate regimes. Proceedings of the National Academy of Sciences 107, 20223-20227.
Show in contextTo understand the snow meltwater and ice meltwater contribution to Himalayan rivers, we additionally rely on various cryospheric-hydrological models (Kaser et al., 2010; Lutz et al., 2014).
View in article
Klaus, J., McDonnell, J.J. (2013) Hydrograph separation using stable isotopes: Review and evaluation. Journal of Hydrology 505, 47-64.
Show in contextThe contributions of ice meltwater, precipitation, and groundwater to the river were assessed using stable water oxygen and hydrogen isotopes, which are considered to be excellent tracers to “fingerprint” water sources in streams and rivers because they are fractionated by natural hydrological processes (Gat, 1996; Klaus and McDonnell, 2013; Frenierre and Mark, 2014).
View in article
Using isotope mixing models, it is thus possible to quantify the fractional contributions from each water source end member (for review see Klaus and McDonnell, 2013).
View in article
Lutz, A.F., Immerzeel, W.W., Shrestha, A.B., Bierkens, M.F.P. (2014) Consistent increase in High Asia's runoff due to increasing glacier melt and precipitation. Nature Climate Change 4, 587-592.
Show in context To understand the snow meltwater and ice meltwater contribution to Himalayan rivers, we additionally rely on various cryospheric-hydrological models (Kaser et al., 2010; Lutz et al., 2014).
View in article
However, our estimates of water source fractions for the rivers Mekong, Salween, and Yangtze are very high when compared to estimates from Lutz et al. (2014).
View in article
Shrestha, A.B., Aggarwal, N.K., Alfthan, B., Bajracharya, S.R., Maréchal, J., van Oort, B. (2015) The Himalayan Climate and Water Atlas: Impact of climate change on water resources in five of Asia’s major river basins. ICIMOD, GRID-Arendal and CICERO, Kathmandu, Nepal.
Show in context Over the past decade, it has become clear that the Himalayan glaciers are shrinking (Bolch et al., 2012; Shrestha et al., 2015) raising questions about their ability to sustain the freshwater supply that meets the demands of 800 million people in SE Asia.
View in article
The concern is particularly significant during the drought years, as melted glacier ice, hereafter referred to as “ice meltwater” is considered a drought resilient water source (Shrestha et al., 2015).
View in article
Zhang, G., Yao, T., Shum, C.K., Yi, S., Yang, K., Xie, H., Feng, W., Bolch, T., Wang, L., Behrangi, A., Zhang, H., Wang, W., Xiang, Y., Yu, J. (2017) Lake volume and groundwater storage variations in Tibetan Plateau's endorheic basin. Geophysical Research Letters 44, 5550-5560.
Show in context It is also likely that not all ice meltwater that is captured by streams and river outlets is lost, as some part of it is also gets stored in high altitude lakes (Che et al., 2014), and recharges groundwater reservoirs (Zhang et al., 2017).
View in article
top
Supplementary Information
The Supplementary Information includes:
- Methodology
- Tables S-1 to S-4
- Figures S-1 and S-5
- Supplementary Information References
Download the Supplementary Information (PDF).
Figures and Tables

Figure 1 Variability of (a) δ18O and (b) d excess of riverwater samples across the Himalayan region. Elevation-wise variability of (c) δ18O, and (d) d excess (colour coded, in metres a.m.s.l). Pre-monsoon samples are represented by triangles, monsoon samples by circles and post-monsoon samples by star symbols.
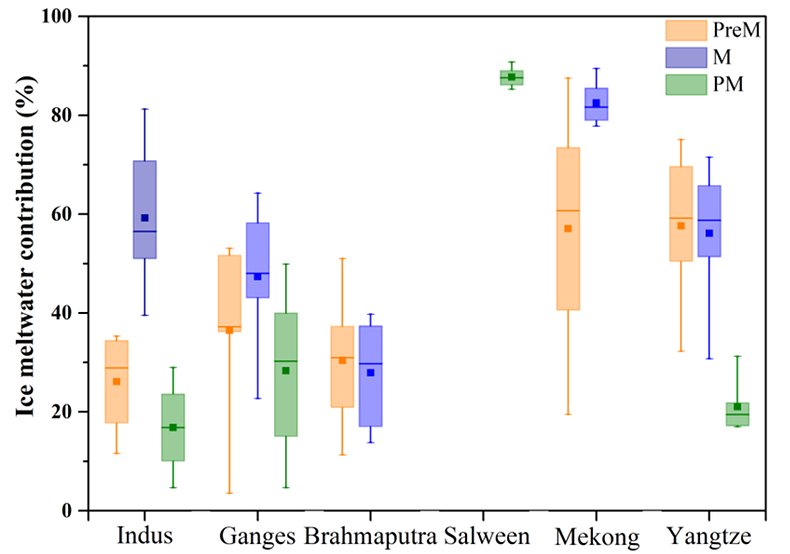
Figure 2 Variability of ice meltwater contribution (in %) to the total river flow of Indus, Ganges, Brahmaputra, Mekong, and Yangtze rivers in pre-monsoon (Pre-M), monsoon (M) and post-monsoon (PM) months. Whisker plots show mean (filled square), median (thick line) interquartile range (shaded) and 5th to 95th percentile (whiskers) as minimum and maximum values.
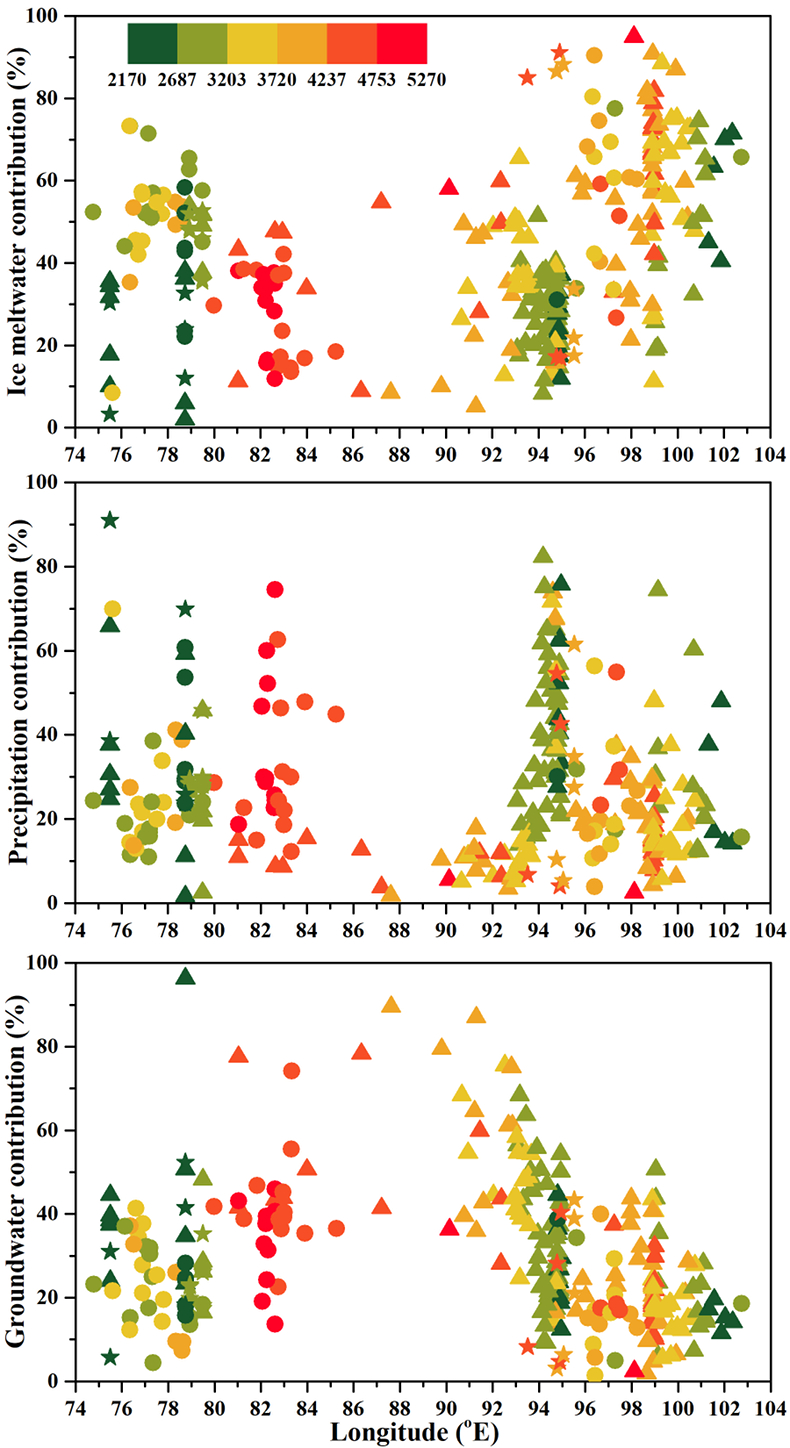
Figure 3 Calculated relative fractions (%) of ice meltwater, precipitation, and groundwater to the total streamflow of rivers Indus, Ganges, Brahmaputra, Salween, Mekong and Yangtze in pre-monsoon (triangles), monsoon (circles) and post-monsoon (stars). The colour represents elevation in metres a.m.s.l.