


Quantifying magmatic volatiles by Raman microtomography of glass inclusion-hosted bubbles
Affiliations | Corresponding Author | Cite as | Funding informationPublished by the European Association of Geochemistry
under Creative Commons License CC BY-NC-ND 4.0
Keywords: shrinkage bubbles, olivine-hosted glass inclusions, magmatic volatiles, Raman spectroscopy, synchrotron XRF mapping, carbonates, sulfides, sulfates


- Share this article


-
Article views:109Cumulative count of HTML views and PDF downloads.
- Download Citation
- Rights & Permissions

top
Abstract
Figures
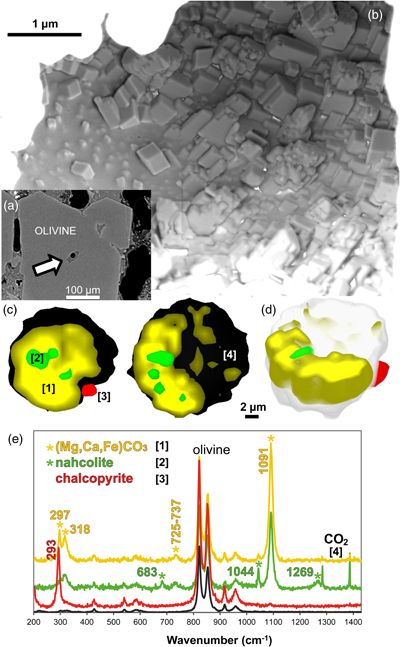 Figure 1 (a) X-ray microscopy image of an olivine-hosted glass inclusion from Lac-d’Issarlès (ISS3-04-8). (b) FESEM image of the bubble wall coated by carbonate crystals exhibiting either rhombohedral or botryoidal shapes. (c) Representative 2D slices of Raman tomography from the bottom and top halves of the bubble. Minerals were identified by Raman spectroscopy and energy dispersive X-ray spectrometry (EDS). Numbers in brackets associate points on the maps with Raman spectra. Chalcopyrite projects outward into the glass. Colour shadows indicate variations in Raman intensity associated with variations in thickness of the carbonate coating. All grains are connected to the bubble walls in 3D (also in next figures). (d) 3D map of the bubble (1 × 1 × 1.5 μm sampling step) rotated ∼90 degrees. Volume filled by CO2 is now semi-transparent (light grey). (e) Raman spectra of the phases in the bubble. The signal from the olivine (black spectrum) is intense because the inclusion is at ∼30 μm depth. FESEM image courtesy of Carl Zeiss Microscopy. | 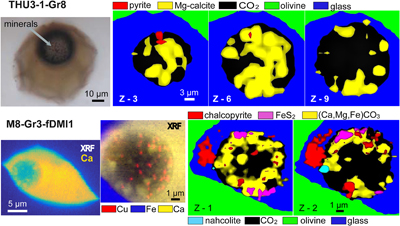 Figure 2 (Top row) Bubble in olivine-hosted glass inclusion from Thueyts: optical image and three representative 2D slices from Raman tomography (2 × 2 × 2 μm sampling step) at increasing depths (Z, μm). In 2D slices, colour shadows help delimiting different grains or aggregates of Mg-calcite. (Bottom row) Inclusion and bubble from Montcineyre imaged by synchrotron XRF (left). The bubble XRF image results from the combination of copper, iron, and calcium maps. (Right) Two slices extracted from Raman tomography (0.3 × 0.3 × 1 μm sampling step). Both XRF and Raman maps display thick aggregates of carbonates lining the bubble rim, and diffuse clusters of sulfides mainly distributed on the bubble wall and partially in the glass near the bubble. Refer to legends for map colour coding. See Figures S-1 and S-2 for more details about these bubbles. | 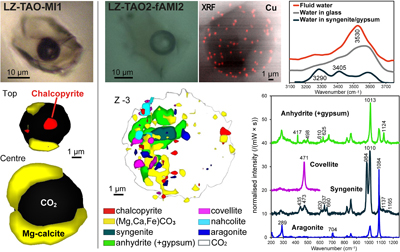 Figure 3 Bubbles in two olivine-hosted glass inclusions from Volcán de Tao containing respectively three and nine fluid/mineral phases. (Left column) Optical image and two representative slices of Raman tomography (1 × 1 × 1.5 μm sampling step) of sample LZ-TAO-MI1. The bubble rim is partially coated by Mg-calcite and discrete crystals of chalcopyrite. (Right columns) Optical image, XRF map of copper, a representative slice of Raman tomography (0.5 × 0.5 × 1 μm sampling step), and selected Raman spectra of LZ-TAO2-fAMI2. Raman spectra are offset for clarity. Both CO2 and H2O fluid phases are present. Hydrous (syngenite and gypsum) and anhydrous minerals coexist. Identified Cu-bearing sulfides are chalcopyrite and covellite. See Figure S-3 for more details about these bubbles. | 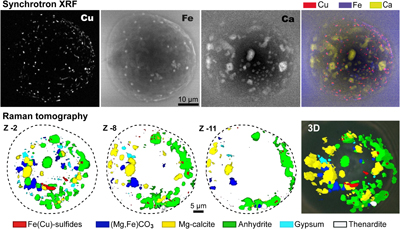 Figure 4 Characterisation of bubble MMA-MI203 from Mount Meager. (Upper row) XRF maps of copper, iron, and calcium and the map resulting from combination of these three elements. Copper map shows the distribution of Cu-bearing sulfides. Iron map includes signals from Fe-bearing sulfides and carbonates. Calcium map includes contributions from Mg-calcite (with rhombohedral habit) and sulfates. (Lower row) Raman tomography: 2D slices at increasing depths below the surface (Z, μm) and 3D map of the bubble (0.6 × 0.6 ×2 μm sampling step). The dashed line marks the rim of the bubble. The minerals line the bubble walls and partially fill its interior. Note the good match in size and spatial distribution of crystals between XRF and Raman maps. Refer to legends for colour coding. Figure S-4 shows more details about the bubble. |
| Figure 1 | Figure 2 | Figure 3 | Figure 4 |
top
Introduction
Glass inclusions are droplets of melt entrapped by magmatic crystals during their growth. They provide a snapshot of pre-eruptive magmatic conditions, and therefore offer precious opportunities to assess the volatile contents (H2O, CO2, S- or Cl-species) within magma chambers and to infer magma storage depths and the mechanisms triggering eruptions. Even if most glass inclusions are entrapped as homogenous silicate melts, modifications occur during decompression and cooling, leading to exsolution of volatiles from the melt and formation of a shrinkage bubble (Roedder, 1979
Roedder, E. (1979) Origin and significance of magmatic inclusions. Bulletin de Minéralogie 102, 487–510.
; Danyushevsky et al., 2002Danyushevsky, L.V., McNeill, A.W., Sobolev, A.V. (2002) Experimental and petrological studies of melt inclusions in phenocrysts from mantle-derived magmas: an overview of techniques, advantages and complications. Chemical Geology 183, 5–24.
; Steele-MacInnis et al., 2011Steele-MacInnis, M., Esposito, R., Bodnar, R. (2011) Thermodynamic model for the effect of post-entrapment crystallization on the H2O-CO2 systematics of vapor-saturated, silicate melt inclusions. Journal of Petrology 52, 2461–2482.
; Gaetani et al., 2012Gaetani, G.A., O’Leary, J.A., Shimizu, N., Bucholz, C.E., Newville, M. (2012) Rapid reequilibration of H2O and oxygen fugacity in olivine-hosted melt inclusions. Geology 40, 915–918.
; Schiavi et al., 2016Schiavi, F., Provost, A., Schiano, P., Cluzel, N. (2016) P-V-T-X evolution of olivine-hosted melt inclusions during high-temperature homogenization treatment. Geochimica et Cosmochimica Acta 172, 1–21.
; Maclennan, 2017Maclennan, J. (2017) Bubble formation and decrepitation control the CO2 content of olivine-hosted melt inclusions. Geochemistry Geophysics Geosystems 18, 597–616.
; Hanyu et al., 2020Hanyu, T., Yamamoto, J., Kimoto, K., Shimizu, K., Ushikubo, T. (2020) Determination of total CO2 in melt inclusions with shrinkage bubbles. Chemical Geology 557, doi: 10.1016/j.chemgeo.2020.119855.
).A significant proportion of the volatiles initially dissolved in the entrapped melt can be contained in the shrinkage bubble, as both fluid and mineral phases. Carbon dioxide is the first phase to migrate into the bubble because its solubility in silicate melts decreases faster with decreasing pressure compared to other volatile species. Recent studies have shown that 20–90 % of the CO2 initially dissolved in olivine-hosted melt inclusions is sequestered as fluid CO2 inside bubbles after cooling and decompression (Hartley et al., 2014
Hartley, M.E., Maclennan, J., Edmonds, M., Thordarson, T. (2014) Reconstructing the deep CO2 degassing behaviour of large basaltic fissure eruptions. Earth and Planetary Science Letters 393, 120–131.
; Moore et al., 2015Moore, L., Gazel, E., Tuohy, R., Lloyd, A., Esposito, R., Steele-MacInnis, M., Hauri, E.H., Wallace, P.J., Plank, T., Bodnar, R.J. (2015) Bubbles matter: An assessment of the contribution of vapor bubbles to melt inclusion volatile budgets. American Mineralogist 100, 806–823.
; Wallace et al., 2015Wallace, P.J., Kamenetsky, V.S., Cervantes, P. (2015) Melt inclusion CO2 contents, pressures of olivine crystallization, and the problem of shrinkage bubbles. American Mineralogist 100, 787–794.
; Tucker et al., 2019Tucker, J.M., Hauri, E.H., Pietruszka, A.J., Garcia, M.O., Marske, J.P., Trusdell, F.A. (2019) A high carbon content of the Hawaiian mantle from olivine-hosted melt inclusions. Geochimica et Cosmochimica Acta 254, 156–172.
; Venugopal et al., 2020Venugopal, S., Schiavi, F., Moune, S., Bolfan-Casanova, N., Druitt, T., Williams-Jones, G. (2020) Melt inclusion vapour bubbles: the hidden reservoir for major and volatile elements. Scientific Reports 10, 9034, doi: 10.1038/s41598-020-65226-3.
). In addition, mineral phases such as carbonates, sulfides, sulfates and native sulfur can precipitate inside shrinkage bubbles upon cooling (Kamenetsky et al., 2002Kamenetsky, V.S., Davidson, P., Mernagh, T.P., Crawford, A.J., Gemmell, J.B., Portnyagin, M.V., Shinjo, R. (2002) Fluid bubbles in melt inclusions and pillow-rim glasses: high-temperature precursors to hydrothermal fluids? Chemical Geology 183, 349–364.
; Moore et al., 2015Moore, L., Gazel, E., Tuohy, R., Lloyd, A., Esposito, R., Steele-MacInnis, M., Hauri, E.H., Wallace, P.J., Plank, T., Bodnar, R.J. (2015) Bubbles matter: An assessment of the contribution of vapor bubbles to melt inclusion volatile budgets. American Mineralogist 100, 806–823.
; Esposito et al., 2016Esposito, R., Lamadrid, H.M., Redi, D., Steele-Macinnis, M., Bodnar, R.J., Manning, C.E., De Vivo, B., Cannatelli, C., Lima, A. (2016) Detection of liquid H2O in vapor bubbles in reheated melt inclusions: Implications for magmatic fluid composition and volatile budgets of magmas? American Mineralogist 101, 1691–1695.
; Robidoux et al., 2018Robidoux, P., Frezzotti, M.L., Hauri, E.H., Aiuppa, A. (2018) Shrinkage bubbles: the C-O-H-S magmatic fluid system at San Cristobal volcano. Journal of Petrology 59, 2093–2122.
; Guzmics et al., 2019Guzmics, T., Berkesi, M., Bodnar, R.J., Fall, A., Bali, E., Milke, R., Vetlényi, E., Szabó, C. (2019) Natrocarbonatites: a hidden product of three-phase immiscibility. Geology 47, 527–530.
; Venugopal et al., 2020Venugopal, S., Schiavi, F., Moune, S., Bolfan-Casanova, N., Druitt, T., Williams-Jones, G. (2020) Melt inclusion vapour bubbles: the hidden reservoir for major and volatile elements. Scientific Reports 10, 9034, doi: 10.1038/s41598-020-65226-3.
). These minerals can store substantial amounts of volatile elements, hence the need for a method to identify their nature and estimate their volume.Here we present a novel application of Raman microtomography to quantify the fraction of mineral and fluid phases in shrinkage bubbles. The method was tested on bubbles in volatile-rich glass inclusions hosted in olivines from explosive basanitic and basaltic eruptions of five volcanoes: Thueyts, Lac-d’Issarlès and Montcineyre, France (continental intraplate volcanic provinces); Volcán de Tao, Lanzarote, Canary Islands, Spain (hotspot); Mt. Meager, Garibaldi Volcanic Belt, Canada (subduction zone) (Table S-1). After establishing a procedure for acquiring, processing, and interpreting 3D Raman data, we carried out synchrotron X-ray fluorescence (XRF) 2D mapping combined with X-ray microtomography to estimate the accuracy of volume reconstructions (technical details are provided as Supplementary Information). Finally, the interior of the bubbles was imaged with a field emission scanning electron microscope (FESEM) to provide complementary compositional and textural information. Our results show that: (1) mineral phases are present systematically and in significant quantities on the walls of the studied bubbles, and (2) the bulk pre-eruptive content of volatiles in magmas may be widely underestimated if condensed minerals are ignored.
top
Results
Raman mapping provides qualitative and quantitative information about the nature, spatial distribution, mutual relationships, and volumetric proportions of the fluids and minerals filling the bubbles (Figs. 1 to 4, S-1 to S-4). Carbon dioxide is the dominant fluid phase in the studied samples. Its density varies from 0.23 to 0.63 g/cm3 (Table S-2). Fluid H2O is only present in two bubbles (that also contain hydrous sulfates; Figs. 3, 4). The mineral phases belong to three main groups: (1) carbonates including (Mg-)calcite, siderite, magnesite, aragonite, and nahcolite (NaHCO3), (2) sulfates, mostly anhydrite, but also thenardite (Na2SO4), gypsum, and syngenite (K2Ca(SO4)2·H2O), and (3) sulfides like pyrite, marcasite (or possibly pyrrhotite), chalcopyrite, and covellite (CuS). The dominant mineral phases in inclusions from Lac-d’Issarlès, Thueyts, Montcineyre and Lanzarote are carbonates (Figs. 1 to 3), while sulfates are volumetrically dominant in samples from the Garibaldi Volcanic Belt (Fig. 4, Table S-2; Venugopal et al., 2020
Venugopal, S., Schiavi, F., Moune, S., Bolfan-Casanova, N., Druitt, T., Williams-Jones, G. (2020) Melt inclusion vapour bubbles: the hidden reservoir for major and volatile elements. Scientific Reports 10, 9034, doi: 10.1038/s41598-020-65226-3.
). All bubbles contain at least one sulfide species, with chalcopyrite being the most common. Calcite, magnesite, and siderite often form solid solutions, resulting in large Raman peaks (e.g., Figs. 1, S-2). Aragonite was found in only one bubble (Fig. 3), while (Mg-)calcite was detected in most samples. Sulfates are present in two bubbles from Mt. Meager and Lanzarote (Figs. 3, 4).Figure 1 (a) X-ray microscopy image of an olivine-hosted glass inclusion from Lac-d’Issarlès (ISS3-04-8). (b) FESEM image of the bubble wall coated by carbonate crystals exhibiting either rhombohedral or botryoidal shapes. (c) Representative 2D slices of Raman tomography from the bottom and top halves of the bubble. Minerals were identified by Raman spectroscopy and energy dispersive X-ray spectrometry (EDS). Numbers in brackets associate points on the maps with Raman spectra. Chalcopyrite projects outward into the glass. Colour shadows indicate variations in Raman intensity associated with variations in thickness of the carbonate coating. All grains are connected to the bubble walls in 3D (also in next figures). (d) 3D map of the bubble (1 × 1 × 1.5 μm sampling step) rotated ∼90 degrees. Volume filled by CO2 is now semi-transparent (light grey). (e) Raman spectra of the phases in the bubble. The signal from the olivine (black spectrum) is intense because the inclusion is at ∼30 μm depth. FESEM image courtesy of Carl Zeiss Microscopy.
Figure 2 (Top row) Bubble in olivine-hosted glass inclusion from Thueyts: optical image and three representative 2D slices from Raman tomography (2 × 2 × 2 μm sampling step) at increasing depths (Z, μm). In 2D slices, colour shadows help delimiting different grains or aggregates of Mg-calcite. (Bottom row) Inclusion and bubble from Montcineyre imaged by synchrotron XRF (left). The bubble XRF image results from the combination of copper, iron, and calcium maps. (Right) Two slices extracted from Raman tomography (0.3 × 0.3 × 1 μm sampling step). Both XRF and Raman maps display thick aggregates of carbonates lining the bubble rim, and diffuse clusters of sulfides mainly distributed on the bubble wall and partially in the glass near the bubble. Refer to legends for map colour coding. See Figures S-1 and S-2 for more details about these bubbles.
Figure 3 Bubbles in two olivine-hosted glass inclusions from Volcán de Tao containing respectively three and nine fluid/mineral phases. (Left column) Optical image and two representative slices of Raman tomography (1 × 1 × 1.5 μm sampling step) of sample LZ-TAO-MI1. The bubble rim is partially coated by Mg-calcite and discrete crystals of chalcopyrite. (Right columns) Optical image, XRF map of copper, a representative slice of Raman tomography (0.5 × 0.5 × 1 μm sampling step), and selected Raman spectra of LZ-TAO2-fAMI2. Raman spectra are offset for clarity. Both CO2 and H2O fluid phases are present. Hydrous (syngenite and gypsum) and anhydrous minerals coexist. Identified Cu-bearing sulfides are chalcopyrite and covellite. See Figure S-3 for more details about these bubbles.
Figure 4 Characterisation of bubble MMA-MI203 from Mount Meager. (Upper row) XRF maps of copper, iron, and calcium and the map resulting from combination of these three elements. Copper map shows the distribution of Cu-bearing sulfides. Iron map includes signals from Fe-bearing sulfides and carbonates. Calcium map includes contributions from Mg-calcite (with rhombohedral habit) and sulfates. (Lower row) Raman tomography: 2D slices at increasing depths below the surface (Z, μm) and 3D map of the bubble (0.6 × 0.6 ×2 μm sampling step). The dashed line marks the rim of the bubble. The minerals line the bubble walls and partially fill its interior. Note the good match in size and spatial distribution of crystals between XRF and Raman maps. Refer to legends for colour coding. Figure S-4 shows more details about the bubble.
High resolution FESEM imaging (Fig. 1b) and synchrotron XRF maps (Figs. 2 to 4, S-1 to S-4) provide complementary compositional and textural information. The mineral phases occur either as discrete crystals or crystal aggregates, which may be uniformly or unevenly distributed on the bubble walls, or as a more continuous coating. Two or three layers of crystals can be superposed (Fig. 1b). Most crystals are located inside the bubble, but some developed outwards into the glass (Figs. 1, 2, S-1). Crystals are often euhedral or subhedral (Figs. 1b, 4) and are generally tens to hundreds of nm in size, more rarely up to 1-2 μm, although larger bubbles can contain bigger crystals (Fig. 4). A characteristic rhombohedral habit identifies carbonates (Fig. 1b). Fe-Cu sulfides generally have uniform size (XRF images in Figs. 2 and 3), smaller than carbonates or sulfates, and can form tiny lineaments (Fig. 4).
top
Discussion
Raman microtomography of shrinkage bubbles reveals the systematic presence of several minerals in addition to fluid phases (mostly CO2 in the studied samples). The proportions of the different phases are highly variable; as a whole, crystals occupy 24 to 34 % of bubble volumes (Table S-2). Quantifying the contribution of each phase to the total bubble volume is challenging because the effective sampling volume of Raman measurements is difficult to assess. Vertical deformation of the studied objects occurs as the materials crossed by light have different refractive indices (Everall, 2010
Everall, N.J. (2010) Confocal Raman microscopy: common errors and artefacts. Analyst 135, 2512–2522.
). We tested the spatial resolution at depth by performing Raman mapping of spherical CO2 bubbles in synthetic silicate glasses (Fig. S-5). Due to mismatches of the refractive index (n) between air (nair = 1) and olivine/glass (nolivine ∼1.66, nglass ∼1.5), bubbles acquire an oblate rather than spherical shape, i.e. the vertical profile of intensity across the bubble diameter appears shorter than the horizontal diameter (Fig. S-5). Moreover, the intensity of CO2 peaks, when leaving the bubble, drops to zero more slowly along the vertical axis because of lower in-depth spatial resolution. Consequently, the size of the bubble is defined by two inflection points on the profile (Fig. S-5). Accounting for the effect of light refraction (real depth = measured depth × n) and locating the inflection points on vertical profiles helps in the correction of the vertical deformation of the bubble volume and accurately localises the bubble/glass interface.In complex systems containing both fluids and minerals, the acquired spectra often represent a mixture of signals from different phases (Figs. 1, 3, S-1 to S-4) because the emission of photons scattered from points neighbouring the focus may contaminate the true signal from the focus point (e.g., Everall, 2010
Everall, N.J. (2010) Confocal Raman microscopy: common errors and artefacts. Analyst 135, 2512–2522.
), but also because the size of minerals may be smaller than the sampling volume of the Raman instrument. The uncertainties associated with volume reconstruction thus depend on the internal microtexture of the bubble. In the simplest case, most crystals belong to the same mineral phase and abrupt changes in relative signal intensities (I) are observed near the boundary between the mineral and the fluid (e.g., changes in Icarbonate/ICO2 in Fig. S-1). In presence of an almost continuous coating (e.g., Fig. 1b) or aggregates of small crystals, the mineral volume can be overestimated because interstices between crystals may not be properly resolved (e.g., carbonates in LZ-TAO-MI1; Fig. 3). Volume reconstruction is straightforward if crystals are isolated and their size is equal to or greater than the spatial resolution of the technique (lateral resolution ≥0.3 μm; Fig. 4). In the most complex scenario, crystals of different sizes and/or compositions grow close to each other (e.g., LZ-TAO2-fAMI2; Fig. 3), which may result in overlooking the smallest crystals (<<1 μm) or the less efficiently scattering minerals, especially in the deeper half of the bubble. These represent the major sources of uncertainty in volume reconstruction by Raman microtomography (see Supplementary Information for details). However, using shorter sampling steps (e.g., compare the maps of the two bubbles in Fig. 2 or Fig. 3) and carefully assessing variations in lateral and in-depth intensity of Raman peaks across the bubble allow the resolution of smaller crystals (few hundred nm) and a more accurate volume reconstruction. Good practices for estimating the uncertainties associated with the volumetric reconstruction are explained in the Supplementary Information.The accuracy of the Raman-based quantitative approach can be evaluated from the comparison with FESEM images (Fig. 1) and synchrotron-based XRF mapping combined with X-ray microtomography (Figs. 2 to 4, S-1 to S-4). Noticeably, the spatial distribution of the elements and mineral phases detected by the three techniques are consistent. Despite the lack of a full correspondence of maps due to the different nature and performance of the methods (2D projection vs. 3D mapping, elemental vs. mineralogical distribution, lower spatial resolution of Raman tomography), particularly good matches in shape and size are observed for mineral phases containing calcium and copper (Figs. 2 and 4).
top
Implications and Conclusions
Carbonates represent the most widespread minerals in bubbles formed from basanitic and basaltic melts. Copper-bearing sulfides are also common in shrinkage bubbles from a wide range of geodynamic contexts, in line with previous findings (Kamenetsky et al., 2002
Kamenetsky, V.S., Davidson, P., Mernagh, T.P., Crawford, A.J., Gemmell, J.B., Portnyagin, M.V., Shinjo, R. (2002) Fluid bubbles in melt inclusions and pillow-rim glasses: high-temperature precursors to hydrothermal fluids? Chemical Geology 183, 349–364.
). In the studied samples, 65 to 84 % of the CO2 and 18 to 60 % of S originally dissolved in the melt are sequestered within the bubble (Table S-2), with a significant part in the form of crystals; 21 to 50 % of the CO2 is stored in minerals. Ignoring the presence of minerals would result in significant underestimation of the content of volatiles (up to 40 % for CO2 and 60 % for S) and major or minor cations (Na, Ca, Mg, Fe or Cu) in the melt. The contribution of carbonates is less important in the bubble containing high density CO2 (LZ-TAO2-fAMI2; Table S-2). Conversely, quantification of carbonates may be crucial in bubbles with low density or non-detectable fluid CO2 (e.g., Moore et al., 2015Moore, L., Gazel, E., Tuohy, R., Lloyd, A., Esposito, R., Steele-MacInnis, M., Hauri, E.H., Wallace, P.J., Plank, T., Bodnar, R.J. (2015) Bubbles matter: An assessment of the contribution of vapor bubbles to melt inclusion volatile budgets. American Mineralogist 100, 806–823.
), because most carbon can be stored in minerals. Future work should examine whether there is a systematic relationship between the abundance of carbonates and the detection and density of CO2.Quantitatively, these results are especially relevant to volatile-rich systems. In systems generally characterised by lower volatile contents (e.g., MORBs), the contribution of mineral phases to the total volatile budget is expected to be smaller. Nonetheless, even in these systems (see Kamenetsky et al., 2002
Kamenetsky, V.S., Davidson, P., Mernagh, T.P., Crawford, A.J., Gemmell, J.B., Portnyagin, M.V., Shinjo, R. (2002) Fluid bubbles in melt inclusions and pillow-rim glasses: high-temperature precursors to hydrothermal fluids? Chemical Geology 183, 349–364.
, for MORBs; Moore et al., 2015Moore, L., Gazel, E., Tuohy, R., Lloyd, A., Esposito, R., Steele-MacInnis, M., Hauri, E.H., Wallace, P.J., Plank, T., Bodnar, R.J. (2015) Bubbles matter: An assessment of the contribution of vapor bubbles to melt inclusion volatile budgets. American Mineralogist 100, 806–823.
, and Tucker et al., 2019Tucker, J.M., Hauri, E.H., Pietruszka, A.J., Garcia, M.O., Marske, J.P., Trusdell, F.A. (2019) A high carbon content of the Hawaiian mantle from olivine-hosted melt inclusions. Geochimica et Cosmochimica Acta 254, 156–172.
, for Hawaii), minerals have been observed in glass inclusion-hosted bubbles, and could be quantified with the present method. This would be also relevant to the sulfur budget because sulfides seem to be ubiquitous, although SO2 and H2S are rarely found inside bubbles (absent or in concentrations lower than detection limits).The reported observations leave open questions about the mechanisms of mineral formation, which can occur via reaction of volatiles with elements diffusing from the melt into the bubble (Moore et al., 2015
Moore, L., Gazel, E., Tuohy, R., Lloyd, A., Esposito, R., Steele-MacInnis, M., Hauri, E.H., Wallace, P.J., Plank, T., Bodnar, R.J. (2015) Bubbles matter: An assessment of the contribution of vapor bubbles to melt inclusion volatile budgets. American Mineralogist 100, 806–823.
; Venugopal et al., 2020Venugopal, S., Schiavi, F., Moune, S., Bolfan-Casanova, N., Druitt, T., Williams-Jones, G. (2020) Melt inclusion vapour bubbles: the hidden reservoir for major and volatile elements. Scientific Reports 10, 9034, doi: 10.1038/s41598-020-65226-3.
), chemical transport by aqueous fluids (Robidoux et al., 2018Robidoux, P., Frezzotti, M.L., Hauri, E.H., Aiuppa, A. (2018) Shrinkage bubbles: the C-O-H-S magmatic fluid system at San Cristobal volcano. Journal of Petrology 59, 2093–2122.
) and/or sublimation/condensation from magmatic fluids highly enriched in volatile and trace elements (Kamenetsky et al., 2002Kamenetsky, V.S., Davidson, P., Mernagh, T.P., Crawford, A.J., Gemmell, J.B., Portnyagin, M.V., Shinjo, R. (2002) Fluid bubbles in melt inclusions and pillow-rim glasses: high-temperature precursors to hydrothermal fluids? Chemical Geology 183, 349–364.
). Whatever the origin of microcrystals in shrinkage bubbles, our study highlights the importance of considering minerals to assess the original volatile content of the entrapped melt, which is critical to infer accurately entrapment pressures of melt inclusions and depth of magma chambers, or to quantify the masses of volatiles released into the atmosphere during major volcanic eruptions. Thus, our reconstructions of initial CO2 contents point out to significant underestimation of the depth of magma storage and crystallisation in C-rich volcanic systems. Likewise the “excess sulfur” problem, which relates to the difference between degassed S and magmatic S as measured in the glass of melt inclusions, disappears if the sulfur present in bubbles, mainly in S-bearing minerals, is taken into account (Venugopal et al., 2020Venugopal, S., Schiavi, F., Moune, S., Bolfan-Casanova, N., Druitt, T., Williams-Jones, G. (2020) Melt inclusion vapour bubbles: the hidden reservoir for major and volatile elements. Scientific Reports 10, 9034, doi: 10.1038/s41598-020-65226-3.
). In addition, the amount, composition and speciation of gas in magma reservoirs control the redox state evolution of an ascending magma and the composition of the coexisting gas phase (e.g., H2S/SO2 ratio; Burgisser and Scaillet, 2007Burgisser, A., Scaillet, B. (2007) Redox evolution of a degassing magma rising to the surface. Nature 445, 194–197.
). In particular, the presence of anhydrite in bubbles suggests relatively high oxygen fugacities, in agreement with high Fe3+/Fetotal ratios measured in melt inclusions from arc magmas (Gaborieau et al., 2020Gaborieau, M., Laubier, M., Bolfan-Casanova, N., McCammon, C.A., Vantelon, D., Chumakov, A.I., Schiavi, F., Neuville, D.R., Venugopal, S. (2020) Determination of Fe3+/ΣFe of olivine-hosted melt inclusions using Mössbauer and XANES spectroscopy. Chemical Geology 547, doi: 10.1016/j.chemgeo.2020.119646.
, and references therein). This observation also raises the question of the role played by volatiles present in the bubble on the redox signature of the inclusion, hence the importance of quantifying both S-bearing minerals and fluids in shrinkage bubbles in order to constrain better magma evolution and degassing history.top
Acknowledgements
We are grateful to Dr. Andrea Somogyi and the scientific and administrative staff of SOLEIL for their helpful support and kind assistance. The FESEM and X-ray microscopy images (Fig. 1) were made at the Carl Zeiss Microscopy demonstration centre of Oberkochen, Germany: Dr. Endre Majorovits, Holger Blank, Matthew Andrew, and Stéphane Letheux are warmly thanked for their hospitality and expertise. We would like to thank Alex Wilson and Kelly Russell for sampling the Mount Meager tephra. We are grateful to Dr. David Neave and Dr. Enikő Bali for their constructive reviews and supportive comments. FS thanks Tim Druitt, scientific coordinator of ClerVolc, for his support over time. This is ClerVolc contribution number 439.
Editor: Ambre Luguet
top
References
Burgisser, A., Scaillet, B. (2007) Redox evolution of a degassing magma rising to the surface. Nature 445, 194–197.
 Show in context
 In addition, the amount, composition and speciation of gas in magma reservoirs control the redox state evolution of an ascending magma and the composition of the coexisting gas phase (e.g., H2S/SO2 ratio; Burgisser and Scaillet, 2007).
View in article
Danyushevsky, L.V., McNeill, A.W., Sobolev, A.V. (2002) Experimental and petrological studies of melt inclusions in phenocrysts from mantle-derived magmas: an overview of techniques, advantages and complications. Chemical Geology 183, 5–24.
Show in context Even if most glass inclusions are entrapped as homogenous silicate melts, modifications occur during decompression and cooling, leading to exsolution of volatiles from the melt and formation of a shrinkage bubble (Roedder, 1979; Danyushevsky et al., 2002; Steele-MacInnis et al., 2011; Gaetani et al., 2012; Schiavi et al., 2016; Maclennan, 2017; Hanyu et al., 2020).
View in article
Esposito, R., Lamadrid, H.M., Redi, D., Steele-Macinnis, M., Bodnar, R.J., Manning, C.E., De Vivo, B., Cannatelli, C., Lima, A. (2016) Detection of liquid H2O in vapor bubbles in reheated melt inclusions: Implications for magmatic fluid composition and volatile budgets of magmas? American Mineralogist 101, 1691–1695.
Show in context In addition, mineral phases such as carbonates, sulfides, sulfates and native sulfur can precipitate inside shrinkage bubbles upon cooling (Kamenetsky et al., 2002; Moore et al., 2015; Esposito et al., 2016; Robidoux et al., 2018; Guzmics et al., 2019; Venugopal et al., 2020).
View in article
Everall, N.J. (2010) Confocal Raman microscopy: common errors and artefacts. Analyst 135, 2512–2522.
Show in context Vertical deformation of the studied objects occurs as the materials crossed by light have different refractive indices (Everall, 2010).
View in article
In complex systems containing both fluids and minerals, the acquired spectra often represent a mixture of signals from different phases (Figs. 1, 3, S-1 to S-4) because the emission of photons scattered from points neighbouring the focus may contaminate the true signal from the focus point (e.g., Everall, 2010), but also because the size of minerals may be smaller than the sampling volume of the Raman instrument.
View in article
Gaborieau, M., Laubier, M., Bolfan-Casanova, N., McCammon, C.A., Vantelon, D., Chumakov, A.I., Schiavi, F., Neuville, D.R., Venugopal, S. (2020) Determination of Fe3+/ΣFe of olivine-hosted melt inclusions using Mössbauer and XANES spectroscopy. Chemical Geology 547, doi: 10.1016/j.chemgeo.2020.119646.
Show in context In particular, the presence of anhydrite in bubbles suggests relatively high oxygen fugacities, in agreement with high Fe3+/Fetotal ratios measured in melt inclusions from arc magmas (Gaborieau et al., 2020, and references therein).
View in article
Gaetani, G.A., O’Leary, J.A., Shimizu, N., Bucholz, C.E., Newville, M. (2012) Rapid reequilibration of H2O and oxygen fugacity in olivine-hosted melt inclusions. Geology 40, 915–918.
Show in context Even if most glass inclusions are entrapped as homogenous silicate melts, modifications occur during decompression and cooling, leading to exsolution of volatiles from the melt and formation of a shrinkage bubble (Roedder, 1979; Danyushevsky et al., 2002; Steele-MacInnis et al., 2011; Gaetani et al., 2012; Schiavi et al., 2016; Maclennan, 2017; Hanyu et al., 2020).
View in article
Guzmics, T., Berkesi, M., Bodnar, R.J., Fall, A., Bali, E., Milke, R., Vetlényi, E., Szabó, C. (2019) Natrocarbonatites: a hidden product of three-phase immiscibility. Geology 47, 527–530.
Show in context In addition, mineral phases such as carbonates, sulfides, sulfates and native sulfur can precipitate inside shrinkage bubbles upon cooling (Kamenetsky et al., 2002; Moore et al., 2015; Esposito et al., 2016; Robidoux et al., 2018; Guzmics et al., 2019; Venugopal et al., 2020).
View in article
Hartley, M.E., Maclennan, J., Edmonds, M., Thordarson, T. (2014) Reconstructing the deep CO2 degassing behaviour of large basaltic fissure eruptions. Earth and Planetary Science Letters 393, 120–131.
Show in context Recent studies have shown that 20–90 % of the CO2 initially dissolved in olivine-hosted melt inclusions is sequestered as fluid CO2 inside bubbles after cooling and decompression (Hartley et al., 2014; Moore et al., 2015; Wallace et al., 2015; Tucker et al., 2019; Venugopal et al., 2020).
View in article
Hanyu, T., Yamamoto, J., Kimoto, K., Shimizu, K., Ushikubo, T. (2020) Determination of total CO2 in melt inclusions with shrinkage bubbles. Chemical Geology 557, doi: 10.1016/j.chemgeo.2020.119855.
Show in context Even if most glass inclusions are entrapped as homogenous silicate melts, modifications occur during decompression and cooling, leading to exsolution of volatiles from the melt and formation of a shrinkage bubble (Roedder, 1979; Danyushevsky et al., 2002; Steele-MacInnis et al., 2011; Gaetani et al., 2012; Schiavi et al., 2016; Maclennan, 2017; Hanyu et al., 2020).
View in article
Kamenetsky, V.S., Davidson, P., Mernagh, T.P., Crawford, A.J., Gemmell, J.B., Portnyagin, M.V., Shinjo, R. (2002) Fluid bubbles in melt inclusions and pillow-rim glasses: high-temperature precursors to hydrothermal fluids? Chemical Geology 183, 349–364.
Show in context In addition, mineral phases such as carbonates, sulfides, sulfates and native sulfur can precipitate inside shrinkage bubbles upon cooling (Kamenetsky et al., 2002; Moore et al., 2015; Esposito et al., 2016; Robidoux et al., 2018; Guzmics et al., 2019; Venugopal et al., 2020).
View in article
Copper-bearing sulfides are also common in shrinkage bubbles from a wide range of geodynamic contexts, in line with previous findings (Kamenetsky et al., 2002).
View in article
Nonetheless, even in these systems (see Kamenetsky et al., 2002, for MORBs; Moore et al., 2015, and Tucker et al., 2019, for Hawaii), minerals have been observed in glass inclusion-hosted bubbles, and could be quantified with the present method.
View in article
The reported observations leave open questions about the mechanisms of mineral formation, which can occur via reaction of volatiles with elements diffusing from the melt into the bubble (Moore et al., 2015; Venugopal et al., 2020), chemical transport by aqueous fluids (Robidoux et al., 2018) and/or sublimation/condensation from magmatic fluids highly enriched in volatile and trace elements (Kamenetsky et al., 2002).
View in article
Maclennan, J. (2017) Bubble formation and decrepitation control the CO2 content of olivine-hosted melt inclusions. Geochemistry Geophysics Geosystems 18, 597–616.
Show in context Even if most glass inclusions are entrapped as homogenous silicate melts, modifications occur during decompression and cooling, leading to exsolution of volatiles from the melt and formation of a shrinkage bubble (Roedder, 1979; Danyushevsky et al., 2002; Steele-MacInnis et al., 2011; Gaetani et al., 2012; Schiavi et al., 2016; Maclennan, 2017; Hanyu et al., 2020).
View in article
Moore, L., Gazel, E., Tuohy, R., Lloyd, A., Esposito, R., Steele-MacInnis, M., Hauri, E.H., Wallace, P.J., Plank, T., Bodnar, R.J. (2015) Bubbles matter: An assessment of the contribution of vapor bubbles to melt inclusion volatile budgets. American Mineralogist 100, 806–823.
Show in context Recent studies have shown that 20–90 % of the CO2 initially dissolved in olivine-hosted melt inclusions is sequestered as fluid CO2 inside bubbles after cooling and decompression (Hartley et al., 2014; Moore et al., 2015; Wallace et al., 2015; Tucker et al., 2019; Venugopal et al., 2020).
View in article
In addition, mineral phases such as carbonates, sulfides, sulfates and native sulfur can precipitate inside shrinkage bubbles upon cooling (Kamenetsky et al., 2002; Moore et al., 2015; Esposito et al., 2016; Robidoux et al., 2018; Guzmics et al., 2019; Venugopal et al., 2020).
View in article
Conversely, quantification of carbonates may be crucial in bubbles with low density or non-detectable fluid CO2 (e.g., Moore et al., 2015), because most carbon can be stored in minerals. Future work should examine whether there is a systematic relationship between the abundance of carbonates and the detection and density of CO2.
View in article
Nonetheless, even in these systems (see Kamenetsky et al., 2002, for MORBs; Moore et al., 2015, and Tucker et al., 2019, for Hawaii), minerals have been observed in glass inclusion-hosted bubbles, and could be quantified with the present method.
View in article
The reported observations leave open questions about the mechanisms of mineral formation, which can occur via reaction of volatiles with elements diffusing from the melt into the bubble (Moore et al., 2015; Venugopal et al., 2020), chemical transport by aqueous fluids (Robidoux et al., 2018) and/or sublimation/condensation from magmatic fluids highly enriched in volatile and trace elements (Kamenetsky et al., 2002).
View in article
Robidoux, P., Frezzotti, M.L., Hauri, E.H., Aiuppa, A. (2018) Shrinkage bubbles: the C-O-H-S magmatic fluid system at San Cristobal volcano. Journal of Petrology 59, 2093–2122.
Show in context In addition, mineral phases such as carbonates, sulfides, sulfates and native sulfur can precipitate inside shrinkage bubbles upon cooling (Kamenetsky et al., 2002; Moore et al., 2015; Esposito et al., 2016; Robidoux et al., 2018; Guzmics et al., 2019; Venugopal et al., 2020).
View in article
The reported observations leave open questions about the mechanisms of mineral formation, which can occur via reaction of volatiles with elements diffusing from the melt into the bubble (Moore et al., 2015; Venugopal et al., 2020), chemical transport by aqueous fluids (Robidoux et al., 2018) and/or sublimation/condensation from magmatic fluids highly enriched in volatile and trace elements (Kamenetsky et al., 2002).
View in article
Roedder, E. (1979) Origin and significance of magmatic inclusions. Bulletin de Minéralogie 102, 487–510.
Show in context Even if most glass inclusions are entrapped as homogenous silicate melts, modifications occur during decompression and cooling, leading to exsolution of volatiles from the melt and formation of a shrinkage bubble (Roedder, 1979; Danyushevsky et al., 2002; Steele-MacInnis et al., 2011; Gaetani et al., 2012; Schiavi et al., 2016; Maclennan, 2017; Hanyu et al., 2020).
View in article
Schiavi, F., Provost, A., Schiano, P., Cluzel, N. (2016) P-V-T-X evolution of olivine-hosted melt inclusions during high-temperature homogenization treatment. Geochimica et Cosmochimica Acta 172, 1–21.
Show in context Even if most glass inclusions are entrapped as homogenous silicate melts, modifications occur during decompression and cooling, leading to exsolution of volatiles from the melt and formation of a shrinkage bubble (Roedder, 1979; Danyushevsky et al., 2002; Steele-MacInnis et al., 2011; Gaetani et al., 2012; Schiavi et al., 2016; Maclennan, 2017; Hanyu et al., 2020).
View in article
Steele-MacInnis, M., Esposito, R., Bodnar, R. (2011) Thermodynamic model for the effect of post-entrapment crystallization on the H2O-CO2 systematics of vapor-saturated, silicate melt inclusions. Journal of Petrology 52, 2461–2482.
Show in context Even if most glass inclusions are entrapped as homogenous silicate melts, modifications occur during decompression and cooling, leading to exsolution of volatiles from the melt and formation of a shrinkage bubble (Roedder, 1979; Danyushevsky et al., 2002; Steele-MacInnis et al., 2011; Gaetani et al., 2012; Schiavi et al., 2016; Maclennan, 2017; Hanyu et al., 2020).
View in article
Tucker, J.M., Hauri, E.H., Pietruszka, A.J., Garcia, M.O., Marske, J.P., Trusdell, F.A. (2019) A high carbon content of the Hawaiian mantle from olivine-hosted melt inclusions. Geochimica et Cosmochimica Acta 254, 156–172.
Show in context Recent studies have shown that 20–90 % of the CO2 initially dissolved in olivine-hosted melt inclusions is sequestered as fluid CO2 inside bubbles after cooling and decompression (Hartley et al., 2014; Moore et al., 2015; Wallace et al., 2015; Tucker et al., 2019; Venugopal et al., 2020).
View in article
Nonetheless, even in these systems (see Kamenetsky et al., 2002, for MORBs; Moore et al., 2015, and Tucker et al., 2019, for Hawaii), minerals have been observed in glass inclusion-hosted bubbles, and could be quantified with the present method.
View in article
Venugopal, S., Schiavi, F., Moune, S., Bolfan-Casanova, N., Druitt, T., Williams-Jones, G. (2020) Melt inclusion vapour bubbles: the hidden reservoir for major and volatile elements. Scientific Reports 10, 9034, doi: 10.1038/s41598-020-65226-3.
Show in context Recent studies have shown that 20–90 % of the CO2 initially dissolved in olivine-hosted melt inclusions is sequestered as fluid CO2 inside bubbles after cooling and decompression (Hartley et al., 2014; Moore et al., 2015; Wallace et al., 2015; Tucker et al., 2019; Venugopal et al., 2020).
View in article
In addition, mineral phases such as carbonates, sulfides, sulfates and native sulfur can precipitate inside shrinkage bubbles upon cooling (Kamenetsky et al., 2002; Moore et al., 2015; Esposito et al., 2016; Robidoux et al., 2018; Guzmics et al., 2019; Venugopal et al., 2020).
View in article
The dominant mineral phases in inclusions from Lac-d’Issarlès, Thueyts, Montcineyre and Lanzarote are carbonates (Figs. 1 to 3), while sulfates are volumetrically dominant in samples from the Garibaldi Volcanic Belt (Fig. 4, Table S-2; Venugopal et al., 2020).
View in article
The reported observations leave open questions about the mechanisms of mineral formation, which can occur via reaction of volatiles with elements diffusing from the melt into the bubble (Moore et al., 2015; Venugopal et al., 2020), chemical transport by aqueous fluids (Robidoux et al., 2018) and/or sublimation/condensation from magmatic fluids highly enriched in volatile and trace elements (Kamenetsky et al., 2002).
View in article
Likewise the “excess sulfur” problem, which relates to the difference between degassed S and magmatic S as measured in the glass of melt inclusions, disappears if the sulfur present in bubbles, mainly in S-bearing minerals, is taken into account (Venugopal et al., 2020).
View in article
Wallace, P.J., Kamenetsky, V.S., Cervantes, P. (2015) Melt inclusion CO2 contents, pressures of olivine crystallization, and the problem of shrinkage bubbles. American Mineralogist 100, 787–794.
Show in context Recent studies have shown that 20–90 % of the CO2 initially dissolved in olivine-hosted melt inclusions is sequestered as fluid CO2 inside bubbles after cooling and decompression (Hartley et al., 2014; Moore et al., 2015; Wallace et al., 2015; Tucker et al., 2019; Venugopal et al., 2020).
View in article
top
Supplementary Information
The Supplementary Information includes:
- Methods
- Tables S-1 and S-2
- Figures S-1 to S-5
- Supplementary Information References
Download the Supplementary Information (PDF).
Figures

Figure 1 (a) X-ray microscopy image of an olivine-hosted glass inclusion from Lac-d’Issarlès (ISS3-04-8). (b) FESEM image of the bubble wall coated by carbonate crystals exhibiting either rhombohedral or botryoidal shapes. (c) Representative 2D slices of Raman tomography from the bottom and top halves of the bubble. Minerals were identified by Raman spectroscopy and energy dispersive X-ray spectrometry (EDS). Numbers in brackets associate points on the maps with Raman spectra. Chalcopyrite projects outward into the glass. Colour shadows indicate variations in Raman intensity associated with variations in thickness of the carbonate coating. All grains are connected to the bubble walls in 3D (also in next figures). (d) 3D map of the bubble (1 × 1 × 1.5 μm sampling step) rotated ∼90 degrees. Volume filled by CO2 is now semi-transparent (light grey). (e) Raman spectra of the phases in the bubble. The signal from the olivine (black spectrum) is intense because the inclusion is at ∼30 μm depth. FESEM image courtesy of Carl Zeiss Microscopy.

Figure 2 (Top row) Bubble in olivine-hosted glass inclusion from Thueyts: optical image and three representative 2D slices from Raman tomography (2 × 2 × 2 μm sampling step) at increasing depths (Z, μm). In 2D slices, colour shadows help delimiting different grains or aggregates of Mg-calcite. (Bottom row) Inclusion and bubble from Montcineyre imaged by synchrotron XRF (left). The bubble XRF image results from the combination of copper, iron, and calcium maps. (Right) Two slices extracted from Raman tomography (0.3 × 0.3 × 1 μm sampling step). Both XRF and Raman maps display thick aggregates of carbonates lining the bubble rim, and diffuse clusters of sulfides mainly distributed on the bubble wall and partially in the glass near the bubble. Refer to legends for map colour coding. See Figures S-1 and S-2 for more details about these bubbles.

Figure 3 Bubbles in two olivine-hosted glass inclusions from Volcán de Tao containing respectively three and nine fluid/mineral phases. (Left column) Optical image and two representative slices of Raman tomography (1 × 1 × 1.5 μm sampling step) of sample LZ-TAO-MI1. The bubble rim is partially coated by Mg-calcite and discrete crystals of chalcopyrite. (Right columns) Optical image, XRF map of copper, a representative slice of Raman tomography (0.5 × 0.5 × 1 μm sampling step), and selected Raman spectra of LZ-TAO2-fAMI2. Raman spectra are offset for clarity. Both CO2 and H2O fluid phases are present. Hydrous (syngenite and gypsum) and anhydrous minerals coexist. Identified Cu-bearing sulfides are chalcopyrite and covellite. See Figure S-3 for more details about these bubbles.
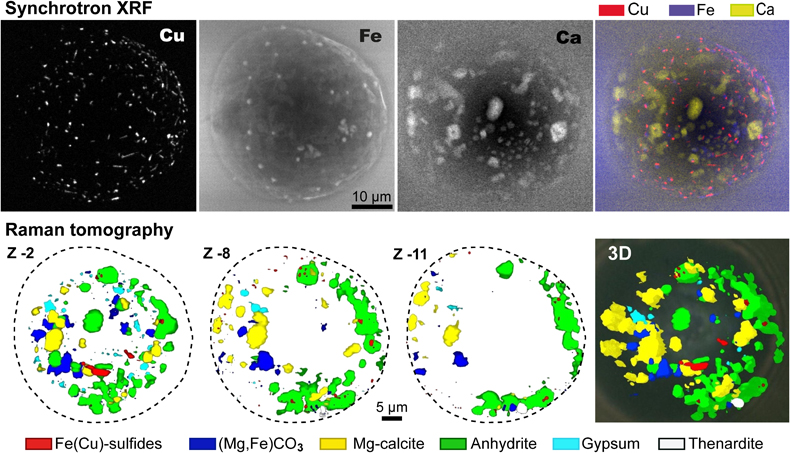
Figure 4 Characterisation of bubble MMA-MI203 from Mount Meager. (Upper row) XRF maps of copper, iron, and calcium and the map resulting from combination of these three elements. Copper map shows the distribution of Cu-bearing sulfides. Iron map includes signals from Fe-bearing sulfides and carbonates. Calcium map includes contributions from Mg-calcite (with rhombohedral habit) and sulfates. (Lower row) Raman tomography: 2D slices at increasing depths below the surface (Z, μm) and 3D map of the bubble (0.6 × 0.6 ×2 μm sampling step). The dashed line marks the rim of the bubble. The minerals line the bubble walls and partially fill its interior. Note the good match in size and spatial distribution of crystals between XRF and Raman maps. Refer to legends for colour coding. Figure S-4 shows more details about the bubble.