
Experiments reveal enrichment of 11B in granitic melt resulting from tourmaline crystallisation
Affiliations | Corresponding Author | Cite as | Funding informationPublished by the European Association of Geochemistry
under Creative Commons License CC BY-NC-ND 4.0
Keywords: boron isotope fractionation, granitic melt, tourmaline, high-temperature and high-pressure experiments


- Share this article


-
Article views:2,167Cumulative count of HTML views and PDF downloads.
- Download Citation
- Rights & Permissions

top
Abstract
Figures and Tables
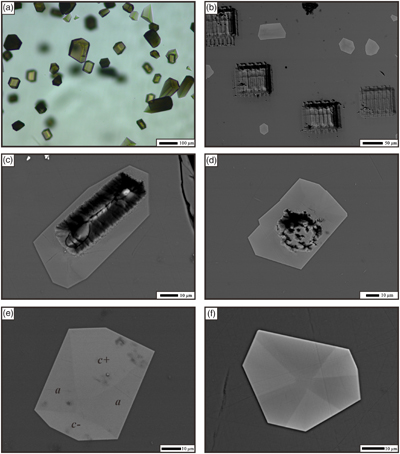 Figure 1 Representative images of experimental products. (a) Tourmaline is evenly distributed in melts (run DC-11, plane-polarised). (b, c, d) Representative BSE images of runs DC-10, DC-28, and DC-11, respectively, showing the positions of analysed areas with laser-ablation. (e) BSE image of a tourmaline grain with hourglass sector zoning from DC-87, section nearly parallel to the c-axis. Three zones can be recognised in this crystal: c+, c−, and a sectors (see details in SI). (f) BSE image of a tourmaline grain from DC-11 with hourglass sector zoning, section perpendicular to the c-axis. The image shows faceted compositional sector zoning splitting the crystal into light and dark areas. | 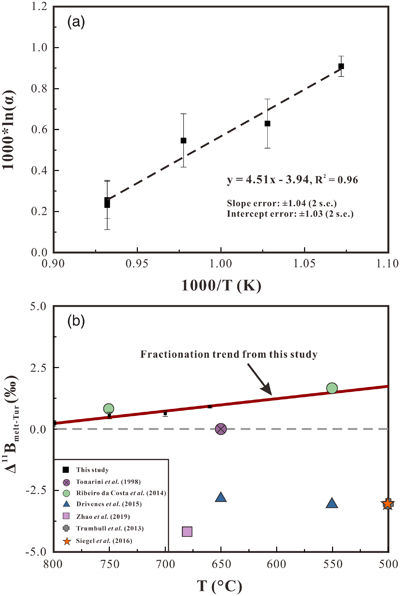 Figure 2 (a) Boron isotopic fractionation factors between granitic melt and tourmaline versus reciprocal temperature. The dashed line represents an Ordinary Least Square regression of the five fractionation values obtained from our experiments. (b) Comparison of Δ11Bmelt–Tur values from this study and Δ11Bmelt–Tur applied in previous studies to interpret δ11B values analysed in tourmaline. | 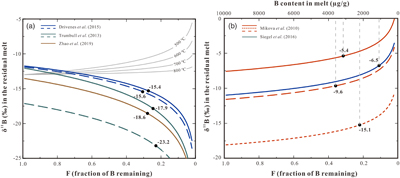 Figure 3 (a) Modelled curves illustrating the change in δ11B values for residual melt after crystallisation of tourmaline, assuming a Rayleigh fractionation. Grey solid curves represent the evolution in δ11B assuming tourmaline crystallisation, the starting δ11B values of the melt are set as −13 ‰ and the fractionation factors are based on the result of this study. The coloured lines are calculated δ11B variation trends of residual melts based on the δ11B analyses of zoned tourmalines and negative Δ11Bmelt–Tur fractionation factors applied in the studies of Trumbull et al. (2013), Drivenes et al. (2015), and Zhao et al. (2019) (see data in Table S-8). Note the discrepancy between the grey solid lines and the coloured lines. (b) Rayleigh fractionation model illustrating the variation of δ11B of residual melt with ongoing tourmaline crystallisation using tourmaline data from Mikova et al. (2010) and Siegel et al. (2016) and the positive fractionation factors from this study. The black dots in both figures represent δ11B values of melt at the end of tourmaline crystallisation, calculated from the δ11B values determined at the rim of the tourmalines. The δ11B values at F = 1.0 are calculated from δ11B values determined in the core of the tourmalines. Data used to draw the coloured lines are listed in Table S-8, and the detailed calculation process is given in SI. | 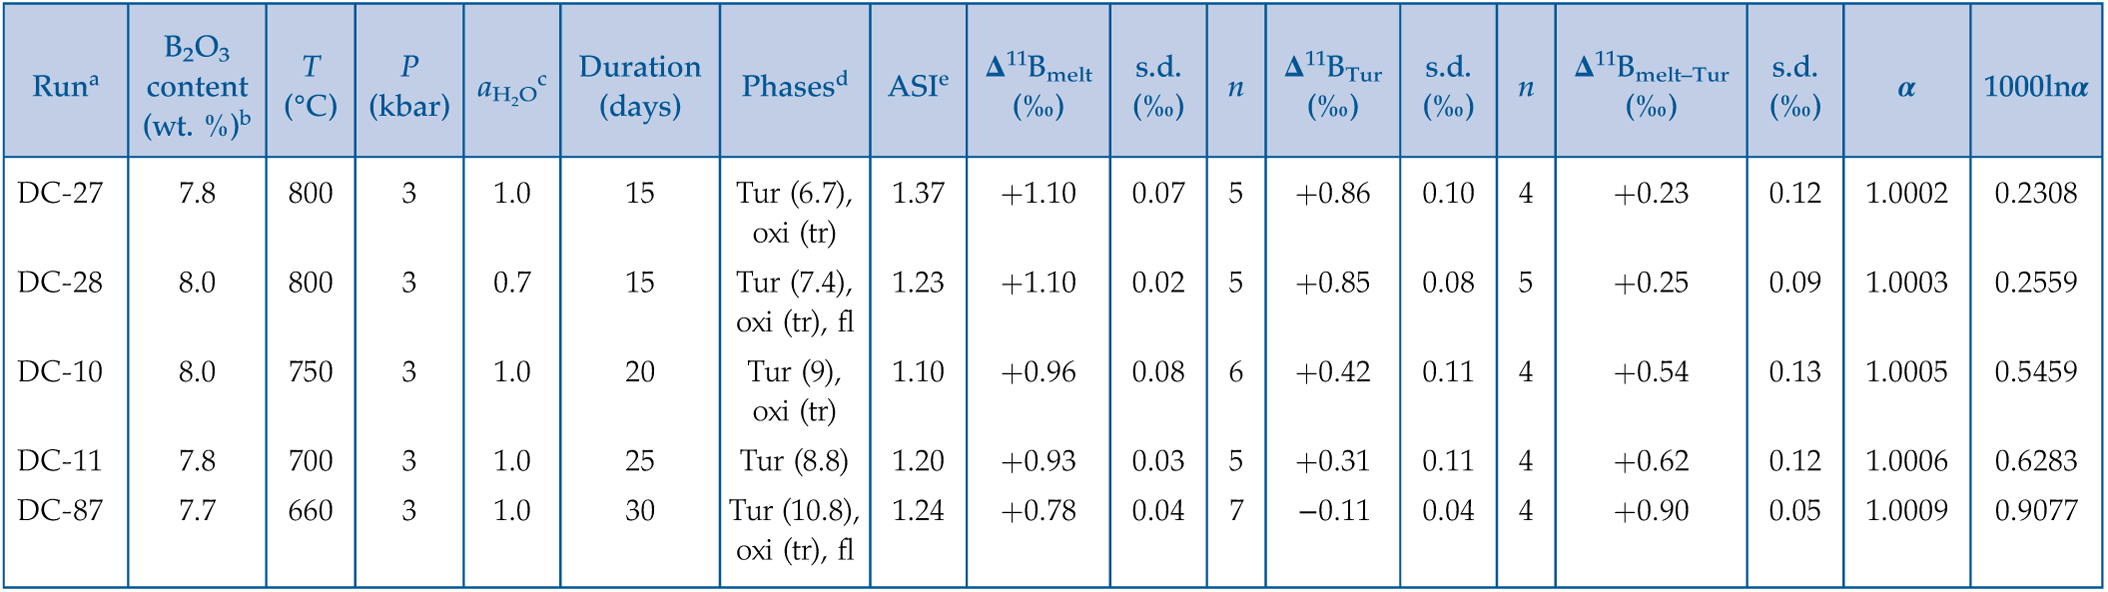 Table 1 Experimental conditions and boron isotopic fractionation factors and partition coefficients. |
| Figure 1 | Figure 2 | Figure 3 | Table 1 |
top
Introduction
Boron is an incompatible trace element that can be highly enriched in granitic melts and aqueous fluids (London et al., 1996
London, D., Morgan, G.B., Wolf, M.B. (1996) Chapter 7. Boron in granitic rocks and their contact aureoles. In: Anovitz, L.M., Grew, E.S. (Eds.) Boron: Mineralogy, Petrology, and Geochemistry. De Gruyter, Berlin, 299–330. https://doi.org/10.1515/9781501509223-009
). The large difference in atomic mass by 10 % between the two stable isotopes of boron, 10B and 11B, results in significant variations in δ11B of natural rocks that can be up to ca. 100 ‰. The separation of B-rich phases such as tourmaline and aqueous fluid from silicate melt is expected to produce B isotope fractionation due to the different B coordination (11B at trigonal site and 10B at tetrahedral site) in coexisting B-bearing phases (e.g., Trumbull et al., 2013Trumbull, R.B., Beurlen, H., Wiedenbeck, M., Soares, D.R. (2013) The diversity of B-isotope variations in tourmaline from rare-element pegmatites in the Borborema Province of Brazil. Chemical Geology 352, 47–62. https://doi.org/10.1016/j.chemgeo.2013.05.021
; Siegel et al., 2016Siegel, K., Wagner, T., Trumbull, R.B., Jonsson, E., Matalin, G., Wälle, M., Heinrich, C.A. (2016) Stable isotope (B, H, O) and mineral-chemistry constraints on the magmatic to hydrothermal evolution of the Varuträsk rare-element pegmatite (Northern Sweden). Chemical Geology 421, 1–16. https://doi.org/10.1016/j.chemgeo.2015.11.025
). Thus, B isotopes are a sensitive tool to trace magmatic–hydrothermal processes (such as fractional crystallisation, degassing, ore formation) and metamorphic fluid source, and tourmaline, as the most common B-hosting mineral in granitic magma, can serve as a useful tracer for such processes. The negligible intra-crystalline diffusion rate leads to the consequence that B isotopic composition of tourmaline is not easily overprinted by late magmatic or hydrothermal events and therefore ideal to record the evolution history of magmas (e.g., Marschall and Jiang, 2011Marschall, H.R., Jiang, S.-Y. (2011) Tourmaline isotopes: no element left behind. Elements 7, 313–319. https://doi.org/10.2113/gselements.7.5.313
). B isotope fractionation factors (Δ11Bmelt–Tur) between silicate melt and tourmaline are a prerequisite to quantitatively interpret the B isotope composition of tourmaline in granitic systems. To our knowledge, so far, B isotope fractionation between granitic melt and tourmaline has not been directly determined by experiments. In previous studies (e.g., Trumbull et al., 2013Trumbull, R.B., Beurlen, H., Wiedenbeck, M., Soares, D.R. (2013) The diversity of B-isotope variations in tourmaline from rare-element pegmatites in the Borborema Province of Brazil. Chemical Geology 352, 47–62. https://doi.org/10.1016/j.chemgeo.2013.05.021
; Siegel et al., 2016Siegel, K., Wagner, T., Trumbull, R.B., Jonsson, E., Matalin, G., Wälle, M., Heinrich, C.A. (2016) Stable isotope (B, H, O) and mineral-chemistry constraints on the magmatic to hydrothermal evolution of the Varuträsk rare-element pegmatite (Northern Sweden). Chemical Geology 421, 1–16. https://doi.org/10.1016/j.chemgeo.2015.11.025
), Δ11Bmelt–Tur values were indirectly calculated from the combination of experimental results on B isotope fractionation between hydrous melt and aqueous fluid (Δ11Bmelt–fluid) (Hervig et al., 2002Hervig, R.L., Moore, G.M., Williams, L.B., Peacock, S.M., Holloway, J.R., Roggensack, K. (2002) Isotopic and elemental partitioning of boron between hydrous fluid and silicate melt. American Mineralogist 87, 769–774. https://doi.org/10.2138/am-2002-5-620
; Maner and London, 2018Maner, J.L., London, D. (2018) Fractionation of the isotopes of boron between granitic melt and aqueous solution at 700 °C and 800 °C (200 MPa). Chemical Geology 489, 16–27. https://doi.org/10.1016/j.chemgeo.2018.05.007
) and between tourmaline and aqueous fluid (Δ11BTur–fluid) (Palmer et al., 1992Palmer, M.R., London, D., Morgan, G.B., Babb, H.A. (1992) Experimental determination of fractionation of 11B/10B between tourmaline and aqueous vapor: A temperature- and pressure-dependent isotopic system. Chemical Geology: Isotope Geoscience section 101, 123–129. https://doi.org/10.1016/0009-2541(92)90209-N
; Meyer et al., 2008Meyer, C., Wunder, B., Meixner, A., Romer, R.L., Heinrich, W. (2008) Boron-isotope fractionation between tourmaline and fluid: an experimental re-investigation. Contributions to Mineralogy and Petrology 156, 259–267. https://doi.org/10.1007/s00410-008-0285-1
). However, these experimental studies differ in the experimental and analytical methods, the P-T conditions, and the fluid compositions. Such discrepancies can lead to great uncertainties if these experimental results are used to calculate Δ11Bmelt–Tur values. In addition, theoretical studies have suggested that the magnitude of Δ11BTur–fluid depends on the composition of tourmaline, with a larger fractionation for dravite than for schorl (Li et al., 2020Li, Y.C., Chen, W.C., Wei, H.Z., Jiang, S.Y., Palmer, M.R., van de Ven, T.G.M., Hohl, S., Lu, J.J., Ma, J. (2020) Exploration of driving mechanisms of equilibrium boron isotope fractionation in tourmaline group minerals and fluid: A density functional theory study. Chemical Geology 536, 119466. https://doi.org/10.1016/j.chemgeo.2020.119466
), which further increases the uncertainty for indirectly calculated Δ11Bmelt–Tur values.In this paper, we report results of tourmaline crystallisation experiments conducted for B-rich granitic systems in the temperature range of 660 to 800 °C and at 300 MPa. The analytical data of the B isotopic distribution between the experimental glasses and tourmalines provide direct constraints on the B isotope fractionation between granitic melt and tourmaline at magmatic temperatures.
top
Methods
Five tourmaline crystallisation experiments were performed at 660−800 °C, 300 MPa, fO2 ≈ NNO for ∼15–30 days in water-pressurised, cold-seal pressure vessels. A B-rich peraluminous granitic glass (B10 glass, B2O3 ≈ 8.8 wt. %), which was synthesised by melting mixed powders of a B-free glass (BDG-1) and boric acid powder, was used as starting material. Four water-saturated experiments (aH2O = 1) and one water-undersaturated experiment (aH2O ≈ 0.7) were conducted. The activity of water was decreased by adding a fluid composed of mixed H2O and CO2 (added as silver oxalate). Major element compositions of the starting glass and experimental products were measured by electron microprobe analyser (EMPA) using a Cameca SX-100 microprobe. Boron isotope compositions of the starting glass and experimental products were measured in situ using a Thermo Scientific Neptune Plus, which was connected to a Spectra-Physics Solstice femtosecond laser ablation system. Details on the experimental and analytical methods are reported in Supplementary Information (SI).
top
Results
Experimental conditions and products are listed in Table 1. Tourmaline was observed in all experiments and homogeneously distributed in melts as dark-green euhedral and columnar crystals, with a common size of ∼100 μm in length and ∼50 μm in width (Fig. 1). In back-scattered electron (BSE) images, most tourmalines show a variation in darkness even within one crystal (Fig. 1b), and some grains are characterised by faceted hourglass sector zoning (see details in SI) (Fig. 1e, f). The Mg/[Mg + Fe] ratio is ca. 0.35–0.55 (Fig. S-2), which is typical for schorl and consistent with that of common igneous tourmalines in nature. Minor amounts of magnetite are evenly distributed in experiments. Bubbles were found in runs DC-28 and DC-87. Experimental melts (quenched as glasses) are peraluminous (ASI ≈ 1.1–1.4) and show a narrow range in B2O3 content (∼7.7–8.0 wt. %). Additional details about experimental products and phase compositions are given in SI.
Table 1 Experimental conditions and boron isotopic fractionation factors and partition coefficients.
| Runa | T (°C) | P (kbar) | (days) | ASIe | Δ11Bmelt (‰) | s.d. (‰) | n | s.d. (‰) | n | s.d. (‰) | α | 1000lnα | |||||
| DC-27 | 7.8 | 800 | 3 | 1.0 | 15 | Tur (6.7), oxi (tr) | 1.37 | +1.10 | 0.07 | 5 | +0.86 | 0.10 | 4 | +0.23 | 0.12 | 1.0002 | 0.2308 |
| DC-28 | 8.0 | 800 | 3 | 0.7 | 15 | Tur (7.4), oxi (tr), fl | 1.23 | +1.10 | 0.02 | 5 | +0.85 | 0.08 | 5 | +0.25 | 0.09 | 1.0003 | 0.2559 |
| DC-10 | 8.0 | 750 | 3 | 1.0 | 20 | Tur (9), oxi (tr) | 1.10 | +0.96 | 0.08 | 6 | +0.42 | 0.11 | 4 | +0.54 | 0.13 | 1.0005 | 0.5459 |
| DC-11 | 7.8 | 700 | 3 | 1.0 | 25 | Tur (8.8) | 1.20 | +0.93 | 0.03 | 5 | +0.31 | 0.11 | 4 | +0.62 | 0.12 | 1.0006 | 0.6283 |
| DC-87 | 7.7 | 660 | 3 | 1.0 | 30 | Tur (10.8), oxi (tr), fl | 1.24 | +0.78 | 0.04 | 7 | −0.11 | 0.04 | 4 | +0.90 | 0.05 | 1.0009 | 0.9077 |
aStarting glass of all experiments was B10 glass.
bBoron contents of experimental glasses were measured by EMPA and calibrated based on data for synthesised glasses with different boron contents (B4, B6, and B10).
cInitial water activity in the experimental runs; aH2O = H2O/(H2O + CO2) on a molar basis.
dNumbers in parentheses represent phase abundances in wt. %, which were calculated by mass balance; tr, trace amount, but abundance not determined. Phase abbreviations: Tur, tourmaline; oxi, oxide; fl, fluid.
eAluminum saturation index in the experimental glass; ASI = Al2O3/(Na2O + K2O + CaO) on a molar basis.
Figure 1 Representative images of experimental products. (a) Tourmaline is evenly distributed in melts (run DC-11, plane-polarised). (b, c, d) Representative BSE images of runs DC-10, DC-28, and DC-11, respectively, showing the positions of analysed areas with laser-ablation. (e) BSE image of a tourmaline grain with hourglass sector zoning from DC-87, section nearly parallel to the c-axis. Three zones can be recognised in this crystal: c+, c−, and a sectors (see details in SI). (f) BSE image of a tourmaline grain from DC-11 with hourglass sector zoning, section perpendicular to the c-axis. The image shows faceted compositional sector zoning splitting the crystal into light and dark areas.
Boron isotopic compositions of the experimental tourmalines and glasses, as well as the calculated isotopic fractionation factors between them, are listed in Table 1. The starting glass (B10) shows a homogeneous B isotope composition within error, with δ11B values of +0.92 ± 0.03 ‰ (Table S-5). The B isotope composition of experimental glasses (δ11Bmelt) is close to that of the starting glass but displays a positive trend with temperature, increasing from +0.78 ± 0.04 ‰ at 660 °C to +1.10 ± 0.07 ‰ at 800 °C (Table 1). The low δ11B value of DC-87 glass relative to starting glass may result from the occurrence of a fluid phase in this experiment because 11B is expected to be preferentially partitioned into fluid relative to granitic melt (Maner and London, 2018
Maner, J.L., London, D. (2018) Fractionation of the isotopes of boron between granitic melt and aqueous solution at 700 °C and 800 °C (200 MPa). Chemical Geology 489, 16–27. https://doi.org/10.1016/j.chemgeo.2018.05.007
). The B isotopic compositions of the experimental tourmaline (δ11BTur) show a positive correlation with temperature, increasing from −0.11 ± 0.04 ‰ at 660 °C to +0.86 ± 0.10 ‰ at 800 °C (Table 1). The calculated B isotope fractionation factors between melt and tourmaline (Δ11Bmelt–Tur) increase from +0.23 ± 0.12 ‰ at 800 °C to +0.90 ± 0.05 ‰ at 660 °C (Table 1), and data regression indicates that the temperature dependence on Δ11Bmelt–Tur can be described as Δ11Bmelt–Tur = 4.51 × (1000/T [K]) − 3.94 (R2 = 0.96) (Fig. 2a). In addition, the two experiments performed at 800 °C with different water activities (DC-27 and DC-28) show identical Δ11Bmelt–Tur values within uncertainties.Figure 2 (a) Boron isotopic fractionation factors between granitic melt and tourmaline versus reciprocal temperature. The dashed line represents an Ordinary Least Square regression of the five fractionation values obtained from our experiments. (b) Comparison of Δ11Bmelt–Tur values from this study and Δ11Bmelt–Tur applied in previous studies to interpret δ11B values analysed in tourmaline.
top
Discussion
Several lines of evidence suggest that near equilibrium conditions in terms of both major elements and B isotopes were reached between melt and tourmaline in our experiments: (1) microscopic observation shows that tourmaline is evenly distributed within the glass matrix for all experiments (Fig. 1a); (2) the major element compositions (seven to ten analytical points for each run) and B isotopic compositions (more than five analytical points) of experimental glasses from each experiment collected at different locations are identical within error (Tables S-2 and S-6); (3) apart from the hourglass sector zoning, no compositional zoning is observed in tourmaline; (4) no variation in B isotope composition is observed in experimental glasses next to the contact with tourmaline and far from the crystals (two or three points).
Our experimental data reveal a small and temperature-dependent B isotopic fractionation between granitic melt and tourmaline at magmatic temperatures. The degree of B isotopic fractionation between different phases at given P-T conditions is considered to be mainly controlled by the coordination of B in each phase, with trigonal site favouring 11B and tetrahedral site favouring 10B (Kowalski and Wunder, 2018
Kowalski, P.M., Wunder, B. (2018) Boron Isotope Fractionation Among Vapor–Liquids–Solids–Melts: Experiments and Atomistic Modeling. In: Marschall, H.R., Foster, G.L. (Eds.) Boron isotopes. Advances in Isotope Geochemistry. Springer, Cham, 33–69. https://doi.org/10.1007/978-3-319-64666-4_3
). B in tourmaline is almost exclusively coordinated at the trigonal site ([3]B); [4]B is expected in very Al-rich tourmaline (>1.2 atoms Al per formula unit at the Y site) and at high pressures (>1000 MPa) and low temperatures (Ertl et al., 2018Ertl, A., Henry, D.J., Tillmanns, E. (2018) Tetrahedral substitutions in tourmaline: a review. European Journal of Mineralogy 30, 465–470. https://doi.org/10.1127/ejm/2018/0030-2732
). Our experimental tourmaline is thus assumed to contain negligible amounts of tetrahedrally coordinated B. However, the δ11BTur values show a systematic increase with increasing temperature, which could be interpreted as a positive temperature effect on stabilising [4]B at the T-site of tourmaline (Ertl et al., 2018Ertl, A., Henry, D.J., Tillmanns, E. (2018) Tetrahedral substitutions in tourmaline: a review. European Journal of Mineralogy 30, 465–470. https://doi.org/10.1127/ejm/2018/0030-2732
). In hydrous silicate glasses, B occupies both trigonally and tetrahedrally coordinated sites, and the proportions of [3]B and [4]B depend on melt composition (especially on B content), temperature, and pressure (Dingwell et al., 1996Dingwell, D.B., Pichavant, M., Holtz, F. (1996) Chapter 8. Experimental studies of boron in granitic melts. In: Anovitz, L.M., Grew, E.S. (Eds.) Boron: Mineralogy, Petrology, and Geochemistry. De Gruyter, Berlin, 331–385. https://doi.org/10.1515/9781501509223-010
). Previous spectroscopic measurements indicate that the amount of [4]B in both natural and synthetic glasses is minor and probably negligible (Tonarini et al., 2003Tonarini, S., Forte, C., Petrini, R., Ferrara, G. (2003) Melt/biotite 11B/10B isotopic fractionation and the boron local environment in the structure of volcanic glasses. Geochimica et Cosmochimica Acta 67, 1863–1873. https://doi.org/10.1016/S0016-7037(02)00987-0
). Since most B in magmatic tourmaline is at trigonal sites, the small Δ11Bmelt–Tur value implies that B should also be predominantly at 3-fold coordinated sites in the peraluminous B-rich granitic melts of this study. The slight increase in δ11Bmelt with increasing temperature in our experiments may be interpreted as the effect of temperature promoting the reaction [BO4] → [BO3] + NBO in silicate melts (Wu and Stebbins, 2013Wu, J., Stebbins, J.F. (2013) Temperature and modifier cation field strength effects on aluminoborosilicate glass network structure. Journal of Non-Crystalline Solids 362, 73–81. https://doi.org/10.1016/j.jnoncrysol.2012.11.005
). It is noteworthy that some previous experimental studies observed a large B isotope fractionation between granitic melt and aqueous fluid, and interpreted it as an indication of a large proportion of [4]B in the melt (Hervig et al., 2002Hervig, R.L., Moore, G.M., Williams, L.B., Peacock, S.M., Holloway, J.R., Roggensack, K. (2002) Isotopic and elemental partitioning of boron between hydrous fluid and silicate melt. American Mineralogist 87, 769–774. https://doi.org/10.2138/am-2002-5-620
; Maner and London, 2018Maner, J.L., London, D. (2018) Fractionation of the isotopes of boron between granitic melt and aqueous solution at 700 °C and 800 °C (200 MPa). Chemical Geology 489, 16–27. https://doi.org/10.1016/j.chemgeo.2018.05.007
). This interpretation is inconsistent with both the result of this study and the spectroscopic studies.This study provides a direct constraint on the B isotope fractionation between silicate melt and tourmaline and indicates a slightly positive value of Δ11Bmelt–Tur. The Δ11Bmelt–Tur estimated from fluid-melt and fluid-tourmaline fractionation factors indicate a slight fractionation between granitic melt and tourmaline, but the sign of Δ11Bmelt–Tur is controversial (Fig. 2b). A Δ11Bmelt–Tur of −3 ‰ at 500 °C was applied by Trumbull et al. (2013)
Trumbull, R.B., Beurlen, H., Wiedenbeck, M., Soares, D.R. (2013) The diversity of B-isotope variations in tourmaline from rare-element pegmatites in the Borborema Province of Brazil. Chemical Geology 352, 47–62. https://doi.org/10.1016/j.chemgeo.2013.05.021
and Siegel et al. (2016)Siegel, K., Wagner, T., Trumbull, R.B., Jonsson, E., Matalin, G., Wälle, M., Heinrich, C.A. (2016) Stable isotope (B, H, O) and mineral-chemistry constraints on the magmatic to hydrothermal evolution of the Varuträsk rare-element pegmatite (Northern Sweden). Chemical Geology 421, 1–16. https://doi.org/10.1016/j.chemgeo.2015.11.025
, whereas Ribeiro da Costa et al. (2014)Ribeiro da Costa, I., Mourão, C., Récio, C., Guimarães, F., Antunes, I.M., Ramos, J.F., Barriga, F.J.A.S., Palmer, M.R., Milton, J.A. (2014) Tourmaline occurrences within the Penamacor-Monsanto granitic pluton and host-rocks (Central Portugal): genetic implications of crystal-chemical and isotopic features. Contributions to Mineralogy and Petrology 167, 1–23. https://doi.org/10.1007/s00410-014-0993-7
used a positive factor to calculate the variation in B isotope composition of magma with tourmaline crystallisation. The inconsistency probably results from the difference in experimental and analytical methods as well as from different fluid compositions in the experimental studies on fluid-melt and fluid-tourmaline fractionation (Palmer et al., 1992Palmer, M.R., London, D., Morgan, G.B., Babb, H.A. (1992) Experimental determination of fractionation of 11B/10B between tourmaline and aqueous vapor: A temperature- and pressure-dependent isotopic system. Chemical Geology: Isotope Geoscience section 101, 123–129. https://doi.org/10.1016/0009-2541(92)90209-N
; Hervig et al., 2002Hervig, R.L., Moore, G.M., Williams, L.B., Peacock, S.M., Holloway, J.R., Roggensack, K. (2002) Isotopic and elemental partitioning of boron between hydrous fluid and silicate melt. American Mineralogist 87, 769–774. https://doi.org/10.2138/am-2002-5-620
; Meyer et al., 2008Meyer, C., Wunder, B., Meixner, A., Romer, R.L., Heinrich, W. (2008) Boron-isotope fractionation between tourmaline and fluid: an experimental re-investigation. Contributions to Mineralogy and Petrology 156, 259–267. https://doi.org/10.1007/s00410-008-0285-1
; Maner and London, 2018Maner, J.L., London, D. (2018) Fractionation of the isotopes of boron between granitic melt and aqueous solution at 700 °C and 800 °C (200 MPa). Chemical Geology 489, 16–27. https://doi.org/10.1016/j.chemgeo.2018.05.007
). Such problems could be overcome in this study. In addition, the composition of tourmaline formed in our experiments is similar to natural magmatic tourmaline (Figs. S-1 and S-2), which allows us to apply our results to granitic and pegmatitic systems.top
Implications for Tracing Magma Evolution with Boron Isotopes
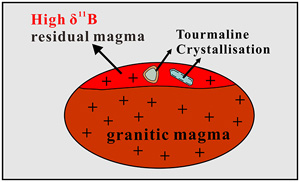
Boron isotope fractionation is expected to occur during magmatic–hydrothermal processes due to the difference in coordination of B between melt, fluid, and B-bearing minerals. As the most common B-rich mineral in granite and pegmatite, tourmaline is widely studied to trace processes at the magmatic–hydrothermal transition by measuring its B isotope composition. The results of this study show small slightly positive temperature-dependent Δ11Bmelt–Tur values. Thus, the B isotope composition of tourmaline crystallising from a granitic melt could approximately reflect that of the silicate melt, especially at high temperatures (∼700–800 °C). However, since the residual melt will be progressively enriched in 11B with ongoing crystallisation of tourmaline in a closed system, as indicated by the Rayleigh fractionation model (Fig. 3a), the δ11B of late-magmatic tourmaline should be higher than that of tourmaline crystallising at an early stage. Such an increasing trend of δ11B values from early- to late-stage tourmaline has been observed in pegmatite (Mikova et al., 2010
Mikova, J., Novák, M., Janousek, V. (2010) Boron isotopes in tourmalines of dravite–schorl series from granitic pegmatites of the Moldanubicum Zone, Czech Republic. Acta Mineralogica-Petrographica Abstract Series 6, 475.
; Siegel et al., 2016Siegel, K., Wagner, T., Trumbull, R.B., Jonsson, E., Matalin, G., Wälle, M., Heinrich, C.A. (2016) Stable isotope (B, H, O) and mineral-chemistry constraints on the magmatic to hydrothermal evolution of the Varuträsk rare-element pegmatite (Northern Sweden). Chemical Geology 421, 1–16. https://doi.org/10.1016/j.chemgeo.2015.11.025
), based on the analysis of δ11B in core and rim of tourmalines, reflecting the evolution from early- to late-stage crystallisation. Our calculation applying a Rayleigh fractionation model and the new fractionation factors show that the consumption of ∼62–78 % B in melt (as a result of tourmaline crystallisation) could explain the observed B isotopic variation of tourmaline between core and rim (Fig. 3b). Differently, some other studies reported a decrease of δ11B from early- to late-stage tourmaline in granites and pegmatites (Trumbull et al., 2013Trumbull, R.B., Beurlen, H., Wiedenbeck, M., Soares, D.R. (2013) The diversity of B-isotope variations in tourmaline from rare-element pegmatites in the Borborema Province of Brazil. Chemical Geology 352, 47–62. https://doi.org/10.1016/j.chemgeo.2013.05.021
; Drivenes et al., 2015Drivenes, K., Larsen, R., Müller, A., Sørensen, B., Wiedenbeck, M., Raanes, M. (2015) Late-magmatic immiscibility during batholith formation: assessment of B isotopes and trace elements in tourmaline from the Land’s End granite, SW England. Contributions to Mineralogy and Petrology 169, 1–27. https://doi.org/10.1007/s00410-015-1151-6
; Zhao et al., 2019Zhao, H.D., Zhao, K.D., Palmer, M.R., Jiang, S.Y. (2019) In-situ elemental and boron isotopic variations of tourmaline from the Sanfang granite, South China: Insights into magmatic-hydrothermal evolution. Chemical Geology 504, 190–204. https://doi.org/10.1016/j.chemgeo.2018.11.013
), which were ascribed to the preferential partitioning of 11B in tourmaline relative to the coexisting melt because negative Δ11Bmelt–Tur values were assumed for the modelling (Fig. 3a, coloured lines). However, such an explanation is inconsistent with the positive Δ11Bmelt–Tur value determined in this study. Alternatively, a kinetically driven B isotope fractionation during fluid exsolution is a potential interpretation for the decrease of δ11B observed in these studies (Kowalski and Wunder, 2018Kowalski, P.M., Wunder, B. (2018) Boron Isotope Fractionation Among Vapor–Liquids–Solids–Melts: Experiments and Atomistic Modeling. In: Marschall, H.R., Foster, G.L. (Eds.) Boron isotopes. Advances in Isotope Geochemistry. Springer, Cham, 33–69. https://doi.org/10.1007/978-3-319-64666-4_3
).Figure 3 (a) Modelled curves illustrating the change in δ11B values for residual melt after crystallisation of tourmaline, assuming a Rayleigh fractionation. Grey solid curves represent the evolution in δ11B assuming tourmaline crystallisation, the starting δ11B values of the melt are set as −13 ‰ and the fractionation factors are based on the result of this study. The coloured lines are calculated δ11B variation trends of residual melts based on the δ11B analyses of zoned tourmalines and negative Δ11Bmelt–Tur fractionation factors applied in the studies of Trumbull et al. (2013)
Trumbull, R.B., Beurlen, H., Wiedenbeck, M., Soares, D.R. (2013) The diversity of B-isotope variations in tourmaline from rare-element pegmatites in the Borborema Province of Brazil. Chemical Geology 352, 47–62. https://doi.org/10.1016/j.chemgeo.2013.05.021
, Drivenes et al. (2015)Drivenes, K., Larsen, R., Müller, A., Sørensen, B., Wiedenbeck, M., Raanes, M. (2015) Late-magmatic immiscibility during batholith formation: assessment of B isotopes and trace elements in tourmaline from the Land’s End granite, SW England. Contributions to Mineralogy and Petrology 169, 1–27. https://doi.org/10.1007/s00410-015-1151-6
, and Zhao et al. (2019)Zhao, H.D., Zhao, K.D., Palmer, M.R., Jiang, S.Y. (2019) In-situ elemental and boron isotopic variations of tourmaline from the Sanfang granite, South China: Insights into magmatic-hydrothermal evolution. Chemical Geology 504, 190–204. https://doi.org/10.1016/j.chemgeo.2018.11.013
(see data in Table S-8). Note the discrepancy between the grey solid lines and the coloured lines. (b) Rayleigh fractionation model illustrating the variation of δ11B of residual melt with ongoing tourmaline crystallisation using tourmaline data from Mikova et al. (2010)Mikova, J., Novák, M., Janousek, V. (2010) Boron isotopes in tourmalines of dravite–schorl series from granitic pegmatites of the Moldanubicum Zone, Czech Republic. Acta Mineralogica-Petrographica Abstract Series 6, 475.
and Siegel et al. (2016)Siegel, K., Wagner, T., Trumbull, R.B., Jonsson, E., Matalin, G., Wälle, M., Heinrich, C.A. (2016) Stable isotope (B, H, O) and mineral-chemistry constraints on the magmatic to hydrothermal evolution of the Varuträsk rare-element pegmatite (Northern Sweden). Chemical Geology 421, 1–16. https://doi.org/10.1016/j.chemgeo.2015.11.025
and the positive fractionation factors from this study. The black dots in both figures represent δ11B values of melt at the end of tourmaline crystallisation, calculated from the δ11B values determined at the rim of the tourmalines. The δ11B values at F = 1.0 are calculated from δ11B values determined in the core of the tourmalines. Data used to draw the coloured lines are listed in Table S-8, and the detailed calculation process is given in SI.top
Conclusions
We determined the temperature-dependent equilibrium B isotope fractionation between peraluminous granitic melt and tourmaline at 660 to 800 °C and 300 MPa, which can be expressed as Δ11Bmelt–Tur = 4.51 × (1000/T [K]) − 3.94 (R2 = 0.96). Our experiments, for the first time, provide direct measurements of the fractionation factors that can be used for tracing B isotopes of granitic melt from the records in tourmaline.
top
Acknowledgements
We thank U. Kroll, D. Qi, X. Li for their help of experiment and D. Wang for his assistance of EMPA analysis. The stay of L. Cheng at Hannover was supported by the Basic Research Fund of the Institute of Geology, China Earthquake Administration (IGCEA2018 and IGCEA1914). Laboratory costs were supported by the German Science Foundation (DFG, project HO1337/49). This paper has been greatly improved by the constructive comments from Horst R. Marschall, Vincent van Hinsberg, and an anonymous reviewer. We are also grateful to Horst R. Marschall for his editorial handling.
Editor: Horst R. Marschall
top
References
Dingwell, D.B., Pichavant, M., Holtz, F. (1996) Chapter 8. Experimental studies of boron in granitic melts. In: Anovitz, L.M., Grew, E.S. (Eds.) Boron: Mineralogy, Petrology, and Geochemistry. De Gruyter, Berlin, 331–385. https://doi.org/10.1515/9781501509223-010
 Show in context
 In hydrous silicate glasses, B occupies both trigonally and tetrahedrally coordinated sites, and the proportions of [3]B and [4]B depend on melt composition (especially on B content), temperature, and pressure (Dingwell et al., 1996).
View in article
Drivenes, K., Larsen, R., Müller, A., Sørensen, B., Wiedenbeck, M., Raanes, M. (2015) Late-magmatic immiscibility during batholith formation: assessment of B isotopes and trace elements in tourmaline from the Land’s End granite, SW England. Contributions to Mineralogy and Petrology 169, 1–27. https://doi.org/10.1007/s00410-015-1151-6
Show in context Differently, some other studies reported a decrease of δ11B from early- to late-stage tourmaline in granites and pegmatites (Trumbull et al., 2013; Drivenes et al., 2015; Zhao et al., 2019), which were ascribed to the preferential partitioning of 11B in tourmaline relative to the coexisting melt because negative Δ11Bmelt–Tur values were assumed for the modelling (Fig. 3a, coloured lines).
View in article
The coloured lines are calculated δ11B variation trends of residual melts based on the δ11B analyses of zoned tourmalines and negative Δ11Bmelt–Tur fractionation factors applied in the studies of Trumbull et al. (2013), Drivenes et al. (2015), and Zhao et al. (2019) (see data in Table S-8).
View in article
Ertl, A., Henry, D.J., Tillmanns, E. (2018) Tetrahedral substitutions in tourmaline: a review. European Journal of Mineralogy 30, 465–470. https://doi.org/10.1127/ejm/2018/0030-2732
Show in context B in tourmaline is almost exclusively coordinated at the trigonal site ([3]B); [4]B is expected in very Al-rich tourmaline (>1.2 atoms Al per formula unit at the Y site) and at high pressures (>1000 MPa) and low temperatures (Ertl et al., 2018).
View in article
However, the δ11BTur values show a systematic increase with increasing temperature, which could be interpreted as a positive temperature effect on stabilising [4]B at the T-site of tourmaline (Ertl et al., 2018).
View in article
Hervig, R.L., Moore, G.M., Williams, L.B., Peacock, S.M., Holloway, J.R., Roggensack, K. (2002) Isotopic and elemental partitioning of boron between hydrous fluid and silicate melt. American Mineralogist 87, 769–774. https://doi.org/10.2138/am-2002-5-620
Show in context It is noteworthy that some previous experimental studies observed a large B isotope fractionation between granitic melt and aqueous fluid, and interpreted it as an indication of a large proportion of [4]B in the melt (Hervig et al., 2002; Maner and London, 2018).
View in article
The inconsistency probably results from the difference in experimental and analytical methods as well as from different fluid compositions in the experimental studies on fluid-melt and fluid-tourmaline fractionation (Palmer et al., 1992; Hervig et al., 2002; Meyer et al., 2008; Maner and London, 2018).
View in article
In previous studies (e.g., Trumbull et al., 2013; Siegel et al., 2016), Δ11Bmelt–Tur values were indirectly calculated from the combination of experimental results on B isotope fractionation between hydrous melt and aqueous fluid (Δ11Bmelt–fluid) (Hervig et al., 2002; Maner and London, 2018) and between tourmaline and aqueous fluid (Δ11BTur–fluid) (Palmer et al., 1992; Meyer et al., 2008).
View in article
Kowalski, P.M., Wunder, B. (2018) Boron Isotope Fractionation Among Vapor–Liquids–Solids–Melts: Experiments and Atomistic Modeling. In: Marschall, H.R., Foster, G.L. (Eds.) Boron isotopes. Advances in Isotope Geochemistry. Springer, Cham, 33–69. https://doi.org/10.1007/978-3-319-64666-4_3
Show in context The degree of B isotopic fractionation between different phases at given P-T conditions is considered to be mainly controlled by the coordination of B in each phase, with trigonal site favouring 11B and tetrahedral site favouring 10B (Kowalski and Wunder, 2018).
View in article
Li, Y.C., Chen, W.C., Wei, H.Z., Jiang, S.Y., Palmer, M.R., van de Ven, T.G.M., Hohl, S., Lu, J.J., Ma, J. (2020) Exploration of driving mechanisms of equilibrium boron isotope fractionation in tourmaline group minerals and fluid: A density functional theory study. Chemical Geology 536, 119466. https://doi.org/10.1016/j.chemgeo.2020.119466
Show in context In addition, theoretical studies have suggested that the magnitude of Δ11BTur–fluid depends on the composition of tourmaline, with a larger fractionation for dravite than for schorl (Li et al., 2020), which further increases the uncertainty for indirectly calculated Δ11Bmelt–Tur values.
View in article
London, D., Morgan, G.B., Wolf, M.B. (1996) Chapter 7. Boron in granitic rocks and their contact aureoles. In: Anovitz, L.M., Grew, E.S. (Eds.) Boron: Mineralogy, Petrology, and Geochemistry. De Gruyter, Berlin, 299–330. https://doi.org/10.1515/9781501509223-009
Show in context Boron is an incompatible trace element that can be highly enriched in granitic melts and aqueous fluids (London et al., 1996).
View in article
Maner, J.L., London, D. (2018) Fractionation of the isotopes of boron between granitic melt and aqueous solution at 700 °C and 800 °C (200 MPa). Chemical Geology 489, 16–27. https://doi.org/10.1016/j.chemgeo.2018.05.007
Show in context The low δ11B value of DC-87 glass relative to starting glass may result from the occurrence of a fluid phase in this experiment because 11B is expected to be preferentially partitioned into fluid relative to granitic melt (Maner and London, 2018).
View in article
It is noteworthy that some previous experimental studies observed a large B isotope fractionation between granitic melt and aqueous fluid, and interpreted it as an indication of a large proportion of [4]B in the melt (Hervig et al., 2002; Maner and London, 2018).
View in article
In previous studies (e.g., Trumbull et al., 2013; Siegel et al., 2016), Δ11Bmelt–Tur values were indirectly calculated from the combination of experimental results on B isotope fractionation between hydrous melt and aqueous fluid (Δ11Bmelt–fluid) (Hervig et al., 2002; Maner and London, 2018) and between tourmaline and aqueous fluid (Δ11BTur–fluid) (Palmer et al., 1992; Meyer et al., 2008).
View in article
The inconsistency probably results from the difference in experimental and analytical methods as well as from different fluid compositions in the experimental studies on fluid-melt and fluid-tourmaline fractionation (Palmer et al., 1992; Hervig et al., 2002; Meyer et al., 2008; Maner and London, 2018).
View in article
Marschall, H.R., Jiang, S.-Y. (2011) Tourmaline isotopes: no element left behind. Elements 7, 313–319. https://doi.org/10.2113/gselements.7.5.313
Show in context The negligible intra-crystalline diffusion rate leads to the consequence that B isotopic composition of tourmaline is not easily overprinted by late magmatic or hydrothermal events and therefore ideal to record the evolution history of magmas (e.g., Marschall and Jiang, 2011).
View in article
Meyer, C., Wunder, B., Meixner, A., Romer, R.L., Heinrich, W. (2008) Boron-isotope fractionation between tourmaline and fluid: an experimental re-investigation. Contributions to Mineralogy and Petrology 156, 259–267. https://doi.org/10.1007/s00410-008-0285-1
Show in context The inconsistency probably results from the difference in experimental and analytical methods as well as from different fluid compositions in the experimental studies on fluid-melt and fluid-tourmaline fractionation (Palmer et al., 1992; Hervig et al., 2002; Meyer et al., 2008; Maner and London, 2018).
View in article
In previous studies (e.g., Trumbull et al., 2013; Siegel et al., 2016), Δ11Bmelt–Tur values were indirectly calculated from the combination of experimental results on B isotope fractionation between hydrous melt and aqueous fluid (Δ11Bmelt–fluid) (Hervig et al., 2002; Maner and London, 2018) and between tourmaline and aqueous fluid (Δ11BTur–fluid) (Palmer et al., 1992; Meyer et al., 2008).
View in article
Mikova, J., Novák, M., Janousek, V. (2010) Boron isotopes in tourmalines of dravite–schorl series from granitic pegmatites of the Moldanubicum Zone, Czech Republic. Acta Mineralogica-Petrographica Abstract Series 6, 475.
Show in context Such an increasing trend of δ11B values from early- to late-stage tourmaline has been observed in pegmatite (Mikova et al., 2010; Siegel et al., 2016), based on the analysis of δ11B in core and rim of tourmalines, reflecting the evolution from early- to late-stage crystallisation.
View in article
(b) Rayleigh fractionation model illustrating the variation of δ11B of residual melt with ongoing tourmaline crystallisation using tourmaline data from Mikova et al. (2010) and Siegel et al. (2016) and the positive fractionation factors from this study.
View in article
Palmer, M.R., London, D., Morgan, G.B., Babb, H.A. (1992) Experimental determination of fractionation of 11B/10B between tourmaline and aqueous vapor: A temperature- and pressure-dependent isotopic system. Chemical Geology: Isotope Geoscience section 101, 123–129. https://doi.org/10.1016/0009-2541(92)90209-N
Show in context The inconsistency probably results from the difference in experimental and analytical methods as well as from different fluid compositions in the experimental studies on fluid-melt and fluid-tourmaline fractionation (Palmer et al., 1992; Hervig et al., 2002; Meyer et al., 2008; Maner and London, 2018).
View in article
In previous studies (e.g., Trumbull et al., 2013; Siegel et al., 2016), Δ11Bmelt–Tur values were indirectly calculated from the combination of experimental results on B isotope fractionation between hydrous melt and aqueous fluid (Δ11Bmelt–fluid) (Hervig et al., 2002; Maner and London, 2018) and between tourmaline and aqueous fluid (Δ11BTur–fluid) (Palmer et al., 1992; Meyer et al., 2008).
View in article
Ribeiro da Costa, I., Mourão, C., Récio, C., Guimarães, F., Antunes, I.M., Ramos, J.F., Barriga, F.J.A.S., Palmer, M.R., Milton, J.A. (2014) Tourmaline occurrences within the Penamacor-Monsanto granitic pluton and host-rocks (Central Portugal): genetic implications of crystal-chemical and isotopic features. Contributions to Mineralogy and Petrology 167, 1–23. https://doi.org/10.1007/s00410-014-0993-7
Show in context A Δ11Bmelt–Tur of −3 ‰ at 500 °C was applied by Trumbull et al. (2013) and Siegel et al. (2016), whereas Ribeiro da Costa et al. (2014) used a positive factor to calculate the variation in B isotope composition of magma with tourmaline crystallisation.
View in article
Siegel, K., Wagner, T., Trumbull, R.B., Jonsson, E., Matalin, G., Wälle, M., Heinrich, C.A. (2016) Stable isotope (B, H, O) and mineral-chemistry constraints on the magmatic to hydrothermal evolution of the Varuträsk rare-element pegmatite (Northern Sweden). Chemical Geology 421, 1–16. https://doi.org/10.1016/j.chemgeo.2015.11.025
Show in context The separation of B-rich phases such as tourmaline and aqueous fluid from silicate melt is expected to produce B isotope fractionation due to the different B coordination (11B at trigonal site and 10B at tetrahedral site) in coexisting B-bearing phases (e.g., Trumbull et al., 2013; Siegel et al., 2016).
View in article
In previous studies (e.g., Trumbull et al., 2013; Siegel et al., 2016), Δ11Bmelt–Tur values were indirectly calculated from the combination of experimental results on B isotope fractionation between hydrous melt and aqueous fluid (Δ11Bmelt–fluid) (Hervig et al., 2002; Maner and London, 2018) and between tourmaline and aqueous fluid (Δ11BTur–fluid) (Palmer et al., 1992; Meyer et al., 2008).
View in article
A Δ11Bmelt–Tur of −3 ‰ at 500 °C was applied by Trumbull et al. (2013) and Siegel et al. (2016), whereas Ribeiro da Costa et al. (2014) used a positive factor to calculate the variation in B isotope composition of magma with tourmaline crystallisation.
View in article
Such an increasing trend of δ11B values from early- to late-stage tourmaline has been observed in pegmatite (Mikova et al., 2010; Siegel et al., 2016), based on the analysis of δ11B in core and rim of tourmalines, reflecting the evolution from early- to late-stage crystallisation.
View in article
(b) Rayleigh fractionation model illustrating the variation of δ11B of residual melt with ongoing tourmaline crystallisation using tourmaline data from Mikova et al. (2010) and Siegel et al. (2016) and the positive fractionation factors from this study.
View in article
Tonarini, S., Dini, A., Pezzotta, F., Leeman, W.P. (1998) Boron isotopic composition of zoned (schorl-elbaite) tourmalines, Mt. Capanne Li-Cs pegmatites, Elba (Italy). European Journal of Mineralogy 10, 941–951. https://doi.org/10.1127/ejm/10/5/0941
Show in context Figure 2
View in article
Tonarini, S., Forte, C., Petrini, R., Ferrara, G. (2003) Melt/biotite 11B/10B isotopic fractionation and the boron local environment in the structure of volcanic glasses. Geochimica et Cosmochimica Acta 67, 1863–1873. https://doi.org/10.1016/S0016-7037(02)00987-0
Show in context Previous spectroscopic measurements indicate that the amount of [4]B in both natural and synthetic glasses is minor and probably negligible (Tonarini et al., 2003).
View in article
Trumbull, R.B., Beurlen, H., Wiedenbeck, M., Soares, D.R. (2013) The diversity of B-isotope variations in tourmaline from rare-element pegmatites in the Borborema Province of Brazil. Chemical Geology 352, 47–62. https://doi.org/10.1016/j.chemgeo.2013.05.021
Show in context The separation of B-rich phases such as tourmaline and aqueous fluid from silicate melt is expected to produce B isotope fractionation due to the different B coordination (11B at trigonal site and 10B at tetrahedral site) in coexisting B-bearing phases (e.g., Trumbull et al., 2013; Siegel et al., 2016).
View in article
In previous studies (e.g., Trumbull et al., 2013; Siegel et al., 2016), Δ11Bmelt–Tur values were indirectly calculated from the combination of experimental results on B isotope fractionation between hydrous melt and aqueous fluid (Δ11Bmelt–fluid) (Hervig et al., 2002; Maner and London, 2018) and between tourmaline and aqueous fluid (Δ11BTur–fluid) (Palmer et al., 1992; Meyer et al., 2008).
View in article
A Δ11Bmelt–Tur of −3 ‰ at 500 °C was applied by Trumbull et al. (2013) and Siegel et al. (2016), whereas Ribeiro da Costa et al. (2014) used a positive factor to calculate the variation in B isotope composition of magma with tourmaline crystallisation.
View in article
Differently, some other studies reported a decrease of δ11B from early- to late-stage tourmaline in granites and pegmatites (Trumbull et al., 2013; Drivenes et al., 2015; Zhao et al., 2019), which were ascribed to the preferential partitioning of 11B in tourmaline relative to the coexisting melt because negative Δ11Bmelt–Tur values were assumed for the modelling (Fig. 3a, coloured lines).
View in article
The coloured lines are calculated δ11B variation trends of residual melts based on the δ11B analyses of zoned tourmalines and negative Δ11Bmelt–Tur fractionation factors applied in the studies of Trumbull et al. (2013), Drivenes et al. (2015), and Zhao et al. (2019) (see data in Table S-8).
View in article
Wu, J., Stebbins, J.F. (2013) Temperature and modifier cation field strength effects on aluminoborosilicate glass network structure. Journal of Non-Crystalline Solids 362, 73–81. https://doi.org/10.1016/j.jnoncrysol.2012.11.005
Show in context The slight increase in δ11Bmelt with increasing temperature in our experiments may be interpreted as the effect of temperature promoting the reaction [BO4] → [BO3] + NBO in silicate melts (Wu and Stebbins, 2013).
View in article
Zhao, H.D., Zhao, K.D., Palmer, M.R., Jiang, S.Y. (2019) In-situ elemental and boron isotopic variations of tourmaline from the Sanfang granite, South China: Insights into magmatic-hydrothermal evolution. Chemical Geology 504, 190–204. https://doi.org/10.1016/j.chemgeo.2018.11.013
Show in context Differently, some other studies reported a decrease of δ11B from early- to late-stage tourmaline in granites and pegmatites (Trumbull et al., 2013; Drivenes et al., 2015; Zhao et al., 2019), which were ascribed to the preferential partitioning of 11B in tourmaline relative to the coexisting melt because negative Δ11Bmelt–Tur values were assumed for the modelling (Fig. 3a, coloured lines).
View in article
The coloured lines are calculated δ11B variation trends of residual melts based on the δ11B analyses of zoned tourmalines and negative Δ11Bmelt–Tur fractionation factors applied in the studies of Trumbull et al. (2013), Drivenes et al. (2015), and Zhao et al. (2019) (see data in Table S-8).
View in article
top
Supplementary Information
The Supplementary Information includes:
Download the Supplementary Information (PDF).
Figures

Figure 1 Representative images of experimental products. (a) Tourmaline is evenly distributed in melts (run DC-11, plane-polarised). (b, c, d) Representative BSE images of runs DC-10, DC-28, and DC-11, respectively, showing the positions of analysed areas with laser-ablation. (e) BSE image of a tourmaline grain with hourglass sector zoning from DC-87, section nearly parallel to the c-axis. Three zones can be recognised in this crystal: c+, c−, and a sectors (see details in SI). (f) BSE image of a tourmaline grain from DC-11 with hourglass sector zoning, section perpendicular to the c-axis. The image shows faceted compositional sector zoning splitting the crystal into light and dark areas.
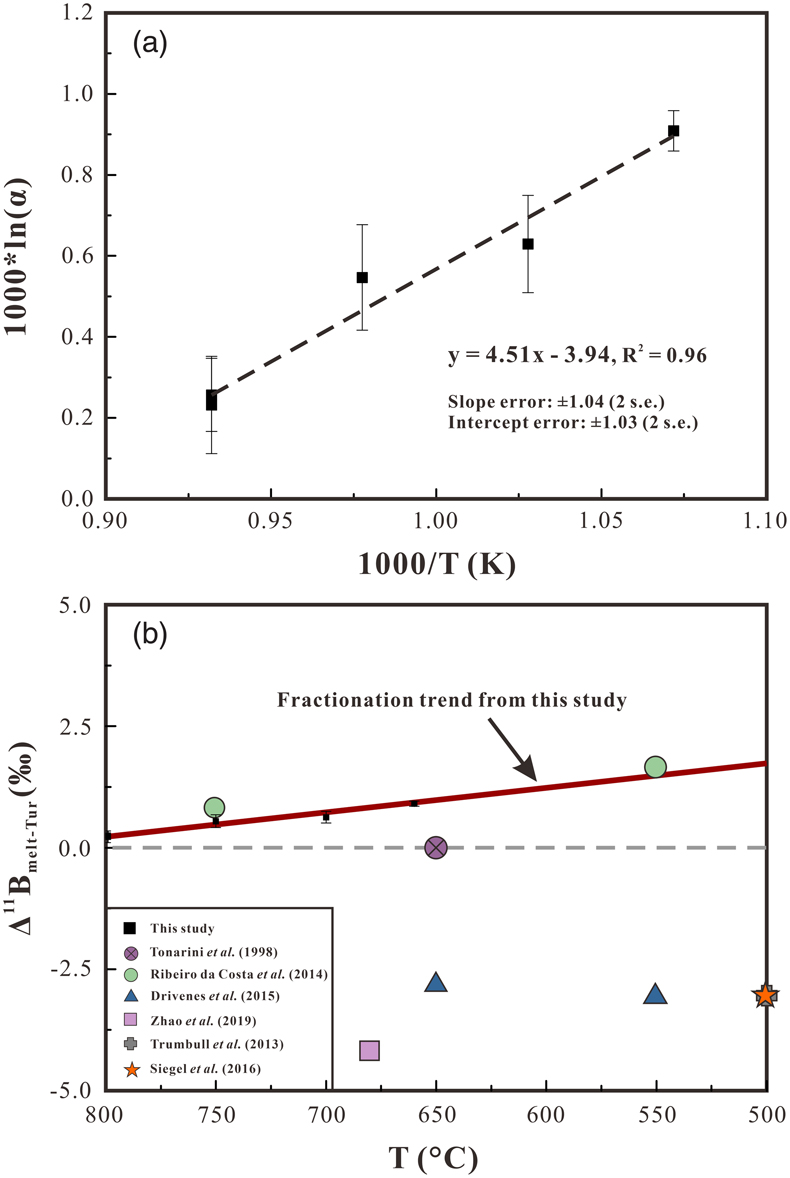
Figure 2 (a) Boron isotopic fractionation factors between granitic melt and tourmaline versus reciprocal temperature. The dashed line represents an Ordinary Least Square regression of the five fractionation values obtained from our experiments. (b) Comparison of Δ11Bmelt–Tur values from this study and Δ11Bmelt–Tur applied in previous studies to interpret δ11B values analysed in tourmaline.
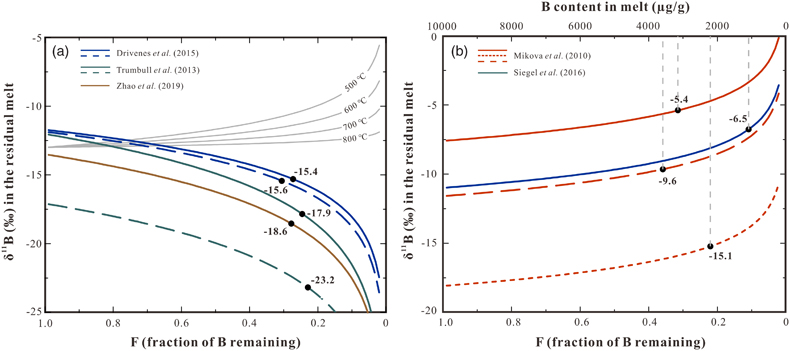
Figure 3 (a) Modelled curves illustrating the change in δ11B values for residual melt after crystallisation of tourmaline, assuming a Rayleigh fractionation. Grey solid curves represent the evolution in δ11B assuming tourmaline crystallisation, the starting δ11B values of the melt are set as −13 ‰ and the fractionation factors are based on the result of this study. The coloured lines are calculated δ11B variation trends of residual melts based on the δ11B analyses of zoned tourmalines and negative Δ11Bmelt–Tur fractionation factors applied in the studies of Trumbull et al. (2013)
Trumbull, R.B., Beurlen, H., Wiedenbeck, M., Soares, D.R. (2013) The diversity of B-isotope variations in tourmaline from rare-element pegmatites in the Borborema Province of Brazil. Chemical Geology 352, 47–62. https://doi.org/10.1016/j.chemgeo.2013.05.021
, Drivenes et al. (2015)Drivenes, K., Larsen, R., Müller, A., Sørensen, B., Wiedenbeck, M., Raanes, M. (2015) Late-magmatic immiscibility during batholith formation: assessment of B isotopes and trace elements in tourmaline from the Land’s End granite, SW England. Contributions to Mineralogy and Petrology 169, 1–27. https://doi.org/10.1007/s00410-015-1151-6
, and Zhao et al. (2019)Zhao, H.D., Zhao, K.D., Palmer, M.R., Jiang, S.Y. (2019) In-situ elemental and boron isotopic variations of tourmaline from the Sanfang granite, South China: Insights into magmatic-hydrothermal evolution. Chemical Geology 504, 190–204. https://doi.org/10.1016/j.chemgeo.2018.11.013
(see data in Table S-8). Note the discrepancy between the grey solid lines and the coloured lines. (b) Rayleigh fractionation model illustrating the variation of δ11B of residual melt with ongoing tourmaline crystallisation using tourmaline data from Mikova et al. (2010)Mikova, J., Novák, M., Janousek, V. (2010) Boron isotopes in tourmalines of dravite–schorl series from granitic pegmatites of the Moldanubicum Zone, Czech Republic. Acta Mineralogica-Petrographica Abstract Series 6, 475.
and Siegel et al. (2016)Siegel, K., Wagner, T., Trumbull, R.B., Jonsson, E., Matalin, G., Wälle, M., Heinrich, C.A. (2016) Stable isotope (B, H, O) and mineral-chemistry constraints on the magmatic to hydrothermal evolution of the Varuträsk rare-element pegmatite (Northern Sweden). Chemical Geology 421, 1–16. https://doi.org/10.1016/j.chemgeo.2015.11.025
and the positive fractionation factors from this study. The black dots in both figures represent δ11B values of melt at the end of tourmaline crystallisation, calculated from the δ11B values determined at the rim of the tourmalines. The δ11B values at F = 1.0 are calculated from δ11B values determined in the core of the tourmalines. Data used to draw the coloured lines are listed in Table S-8, and the detailed calculation process is given in SI.