


Quantifying seawater exchange rates in the Eocene Arctic Basin using osmium isotopes
Affiliations | Corresponding Author | Cite as | Funding information
Published by the European Association of Geochemistry
under Creative Commons License CC BY 4.0
Keywords: Arctic Ocean, osmium isotopes, restricted basins, Palaeogene, palaeoceanography


- Share this article


-
Article views:129Cumulative count of HTML views and PDF downloads.
- Download Citation
- Rights & Permissions

top
Abstract
Figures
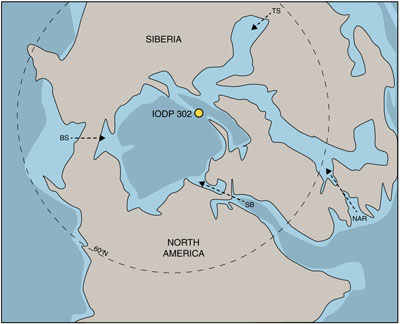 Figure 1 Palaeogeography of the Arctic region at ca. 50 Ma. Simplified map adapted from Blakey (2020). Oceanic straits allowing periodic exchanges of water into the Arctic are marked with arrows. TS: Turgay Strait. NAR: North Atlantic Ridge. BS: Bering Strait. SB: Sverdrup basin. | 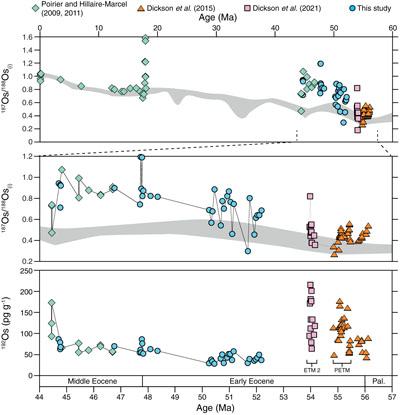 Figure 2 Initial osmium isotope (187Os/188Osi) ratios and unradiogenic concentrations (192Os, pg g−1) of sediments deposited at IODP Site M0004A. The open ocean 187Os/188Os trend, taken from the ferromanganese crust data of Peucker-Ehrenbrink et al. (1995) and Pegram and Turkian (1999) is shown with grey shading. Published Os datasets are from Poirier and Hillaire-Marcel (2009, 2011) and Dickson et al. (2015, 2021). ETM 2: Eocene Thermal Maximum 2. PETM: Paleocene–Eocene Thermal Maximum. Pal: Paleocene. | 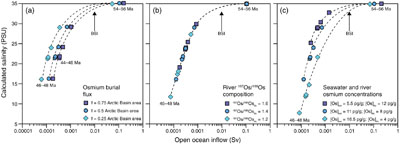 Figure 3 Calculated rates of open ocean seawater inflow to the Arctic Ocean, and Arctic Basin salinities. (a) Sensitivity tests of varying Os burial fluxes. (b) Sensitivity tests of varying pan-Arctic river compositions. (c) Sensitivity tests of varying the Os concentration in open ocean seawater and Arctic Rivers. BSI: modern Black Sea inflow of ∼0.0097 Sv from Özsoy and Ünlüata (1997). |
| Figure 1 | Figure 2 | Figure 3 |
top
Introduction
The Paleogene Arctic Ocean became hydrographically restricted in the Early to Middle Eocene due to both the closure of the Turgay Strait in northern Eurasia, and the progressive shoaling of the North Atlantic ridge, which probably acted as a valve for water exchange with the northern polar latitudes (Moran et al., 2006
Moran, K., Backman, J., Brinkhuis, H., Clemens, S.C., Cronin, T., Dickens, G.R., Eynaud, F., Gattacceca, J., Jakobsson, M., Jordan, R.W., Kaminski, M., King, J., Koc, N., Krylov, A., Martinez, N., Matthiessen, J., McInroy, D., Moore, T.C., Onodera, J., O’Regan, M., Pälike, H., Rea, B., Rio, D., Sakamoto, T., Smith, D.C., Stein, R., St John, K., Suto, I., Suzuki, N., Takahashi, K., Watanabe, M., Yamamoto, M., Farrell, J., Frank, M., Kubik, P., Jokat, W., Kristoffersen, Y. (2006) The Cenozoic palaeoenvironment of the Arctic Ocean. Nature 441, 601–605, https://doi.org/10.1038/nature04800
; Stärz et al., 2017Stärz, M., Jokat, W., Knorr, G., Lohmann, G. (2017) Threshold in North Atlantic-Arctic Ocean circulation controlled by the subsidence of the Greenland-Scotland ridge. Nature Communications 8, 15681, https://doi.org/10.1038/ncomms15681
; Fig. 1). By reducing the exchange of high salinity water, these tectonically driven events triggered a change to brackish/freshwater conditions in the basin during the late Early Eocene, as recorded by the well documented presence of the freshwater fern Azolla during the period ∼49–48 Ma (Brinkhuis et al., 2006Brinkhuis, H., Schouten, S., Collinson, M.E., Sluijs, A., Sinninghe Damsté, J.S., Dickens, G.R., Huber, M., Cronin, T.M., Onodera, J., Takahashi, K., Bujak, J.P., Stein, R., van der Burgh, J., Eldrett, J.S., Harding, I.C., Lotter, A.F., Sangiorgi, F., van Konijnenburg-van Cittert, H., de Leeuw, J.W., Matthiessen, J., Backman, J., Moran, K., Expedition 302 Scientists (2006) Episodic fresh surface waters in the Eocene Arctic Ocean. Nature 441, 606–609. https://doi.org/10.1038/nature04692
). Oxygen, neodymium, and strontium isotope data indicate low salinity conditions (Waddell and Moore, 2008Waddell, L.M., Moore, T.C. (2008) Salinity of the Eocene Arctic Ocean from oxygen isotope analysis of fish bone carbonate. Paleoceanography and Paleoclimatology 23, PA1S12, https://doi.org/10.1029/2007PA001451
; Gleason et al., 2009Gleason, J.D., Thomas, D.J., Moore Jr, T.C., Blum, J.D., Owen, R.M., Haley, B.A. (2009) Early to middle Eocene history of the Arctic Ocean from Nd-Sr isotopes in fossil fish debris, Lomonosov Ridge. Paleoceanography and Paleoclimatology 24, PA2215, https://doi.org/10.1029/2008PA001685
), which may have facilitated sea ice growth and an enhanced polar albedo effect in the middle Eocene (Stickley et al., 2009Stickley, C.E., St John, K., Koc, N., Jordan, R.W., Passchier, S., Pearce, R.B., Kearns, L.E. (2009) Evidence for middle Eocene Arctic sea ice from diatoms and ice-rafted debris. Nature 460, 376–379, https://doi.org/10.1038/nature08163
). Reduced inflow of open ocean waters also caused the Arctic Ocean to evolve to anoxic-sulfidic depositional conditions, both over the long term duration of the Early–Middle Eocene (März et al., 2010März, C., Schnetger, B., Brumsack, H-J. (2010) Paleoenvironmental implications of Cenozoic sediments from the central Arctic Ocean (IODP Expedition 302) using inorganic geochemistry. Paleoceanography and Paleoclimatology 25, https://doi.org/10.1029/2009PA001860
) and over shorter hyperthermal events such as the Paleocene–Eocene Thermal Maximum (Dickson et al., 2012Dickson, A.J., Cohen, A.S., Coe, A.L. (2012) Seawater oxygenation during the Paleocene-Eocene Thermal Maximum. Geology 40, 637–642, https://doi.org/10.1130/G32977.1
).Figure 1 Palaeogeography of the Arctic region at ca. 50 Ma. Simplified map adapted from Blakey (2020)
Blakey, R. (2020) Paleotectonic and paleogeographic history of the Arctic region. Atlantic Geology 57, 7–39, http://doi.org/10.4138/atlgeol.2021.002
. Oceanic straits allowing periodic exchanges of water into the Arctic are marked with arrows. TS: Turgay Strait. NAR: North Atlantic Ridge. BS: Bering Strait. SB: Sverdrup basin.Despite being well characterised, the timing of hydrographic restriction in the Arctic Basin is uncertain (Moran et al., 2006
Moran, K., Backman, J., Brinkhuis, H., Clemens, S.C., Cronin, T., Dickens, G.R., Eynaud, F., Gattacceca, J., Jakobsson, M., Jordan, R.W., Kaminski, M., King, J., Koc, N., Krylov, A., Martinez, N., Matthiessen, J., McInroy, D., Moore, T.C., Onodera, J., O’Regan, M., Pälike, H., Rea, B., Rio, D., Sakamoto, T., Smith, D.C., Stein, R., St John, K., Suto, I., Suzuki, N., Takahashi, K., Watanabe, M., Yamamoto, M., Farrell, J., Frank, M., Kubik, P., Jokat, W., Kristoffersen, Y. (2006) The Cenozoic palaeoenvironment of the Arctic Ocean. Nature 441, 601–605, https://doi.org/10.1038/nature04800
) and the water mass exchange rates that contributed to restricted conditions are not well quantified by hydrographic models (e.g., Stärz et al., 2017Stärz, M., Jokat, W., Knorr, G., Lohmann, G. (2017) Threshold in North Atlantic-Arctic Ocean circulation controlled by the subsidence of the Greenland-Scotland ridge. Nature Communications 8, 15681, https://doi.org/10.1038/ncomms15681
; Hutchinson et al., 2019Hutchinson, D.K., Coxall, H.K., O’Regan, M., Nilsson, J., Caballero, R., de Boer, A.M. (2019) Arctic closure as a trigger for Atlantic overturning at the Eocene–Oligocene transition. Nature Communications 10, 3797, https://doi.org/10.1038/s41467-019-11828-z
). Exchanges of heat and salt between the Arctic, Pacific, Atlantic and Tethys oceans would have been important factors controlling Eocene ocean circulation patterns and meridional heat transport, but model simulations disagree on the magnitude of circulation changes that may have been caused by progressive restriction (Roberts et al., 2009Roberts, C.D., LeGrande, A.N., Tripati, A.K. (2009) Climate sensitivity to Arctic seaway restriction during the early Paleogene. Earth and Planetary Science Letters 286, 576–585, https://doi.org/10.1016/j.epsl.2009.07.026
; Cope and Winguth, 2011Cope, J.T., Winguth, A. (2011) On the sensitivity of ocean circulation to arctic freshwater input during the Paleocene/Eocene Thermal Maximum. Palaeogeography, Palaeoclimatology, Palaeoecology 306, 82–94. https://doi.org/10.1016/j.palaeo.2011.03.032
). In this contribution we present new osmium isotope measurements from IODP Site M0004A (Leg 302, ‘ACEX’ core). These measurements span the period 55.1–44.7 Ma and link the data published by Dickson et al. (2015Dickson, A.J., Cohen, A.S., Coe, A.L., Davies, M., Shcherbinina, E.A., Gavrilov, Y.O. (2015) Evidence for weathering and volcanism during the PETM from Arctic Ocean and Peri-Tethys osmium isotope records. Palaeogeography, Palaeoclimatology, Palaeoecology 438, 300–307, https://doi.org/10.1016/j.palaeo.2015.08.019
, 2021Dickson, A.J., Cohen, A.S., Davies, M. (2021) The osmium isotope signature of Phanerozoic Large Igneous Provinces. In: Ernst, R., Dickson, A.J., Bekker, A. (Eds) Large Igneous Provinces: a driver of global environmental and biotic changes. AGU Geophysical Monograph Series 255. https://doi.org/10.1002/9781119507444
) for the PETM and Eocene Thermal Maximum 2 (ETM-2) to the Middle Eocene (and younger) Os data published by Poirier and Hillaire-Marcel (2009Poirier, A., Hillaire-Marcel, C. (2009) Os-isotope insights in major environmental changes of the Arctic Ocean during the Cenozoic. Geophysical Research Letters 36, L11602, https://doi.org/10.1029/2009GL037422
, 2011Poirier, A., Hillaire-Marcel, C. (2011) Improved Os-isotope stratigraphy of the Arctic Ocean. Geophysical Research Letters 38, L14607, https://doi.org/10.1029/2011GL047953
). The new data are used as boundary conditions for a mass balance model that we use to quantify the flux of open ocean seawater into the Arctic Basin, and to quantify the mean Arctic Ocean salinities associated with these exchange rates.top
Material and Methods
Sub-samples from Site M0004A between 205.43–345.48 mcd were oven dried and powdered. 1 g samples were digested at 180 °C for 5 days in 12 ml of inverse aqua regia in flame sealed Carius tubes following addition of a mixed 190Os and 185Re spike solution. Os was extracted from the chilled digest with CCl4, then back extracted into HBr and micro-distilled using Cr(VI)-H2SO4 (Cohen and Waters, 1996
Cohen, A.S., Waters, F.G. (1996) Separation of osmium from geological materials by solvent extraction for analysis by thermal ionisation mass spectrometry. Analytica Chimica Acta 332, 269–275. https://doi.org/10.1016/0003-2670(96)00226-7
; Birck et al., 1997Birck, J-L., Roy Barman, M., Capmas, F. (1997) Re-Os measurements at the femtomole level in natural samples. Geostandards Newsletter 21, 19–27. http://doi.org/10.1111/j.1751-908X.1997.tb00528.x
). Solutions were loaded onto Pt filaments and analysed by negative thermal ionisation mass spectrometry. Os blanks were <1 pg (<1 % blank contribution) with an average 187Os/188Os ratio of 0.37. Precision of 187Os/188Os analyses was <0.2 % (2 s.d.), determined from a DTM Os standard solution (187Os/188Os = 0.17381 ± 0.00104, n = 14) and USGS SDO-1 (187Os/188Os = 7.99404 ± 0.00444, n = 4). Re was partitioned from the acid digests into iso-amylol, back extracted into H2O and analysed by MC-ICP-MS. Instrumental mass fractionation was corrected by the addition of 40 ppb Ir and normalising to a 193Ir/191Ir ratio of 1.68299. Re procedural blanks were <10 pg (blank contributions <0.02 %). Repeat digests of USGS SDO-1 gave an average Re concentration of 77.44 ± 1.83 ng/g (2 s.d., n = 6). Initial 187Os/188Os ratios (187Os/188Osi) were calculated with a Re decay constant of 1.666 x 10⁻¹¹ and a depositional age interpolated from the age model of Backman et al. (2008)Backman, J., Jakobsson, M., Frank, M., Sangiorgi, F., Brinkhuis, H., Stickley, C., O’Regan, M., Lvlie, R., Pälike, H., Spofforth, D., Gattacecca, J., Moran, K, King, J., Heil, C. (2008) Age model and core-seismic integration for the Cenozoic Arctic core expedition sediments from the Lomonosov Ridge. Paleoceanography and Paleoclimatology 23, PA1S03, http://doi.org/10.1029/2007PA001476
. The part of the ACEX core below ∼300 mcd is not affected by the alternative age model of Poirier and Hillaire-Marcel (2009)Poirier, A., Hillaire-Marcel, C. (2009) Os-isotope insights in major environmental changes of the Arctic Ocean during the Cenozoic. Geophysical Research Letters 36, L11602, https://doi.org/10.1029/2009GL037422
but core levels above ∼300 mcd would be progressively shifted to younger ages by up to 7 Myr. The choice of age model therefore has a small effect on the calculation of 187Os/188Osi (Fig. S-1).top
Results
187Os/188Osi range from 0.30–1.19 and become generally higher between ∼55–45 Ma (Fig. 2, Table S-1). 187Os/188Osi ratios overlap the values previously published by Poirer and Hillaire-Marcel (2011)
Poirier, A., Hillaire-Marcel, C. (2011) Improved Os-isotope stratigraphy of the Arctic Ocean. Geophysical Research Letters 38, L14607, https://doi.org/10.1029/2011GL047953
for the upper part of the studied section. 187Os/188Osi ratios in the lower part of the section are similar to those published for Eocene Thermal Maximum 2 (ETM-2) by Dickson et al. (2021)Dickson, A.J., Cohen, A.S., Davies, M. (2021) The osmium isotope signature of Phanerozoic Large Igneous Provinces. In: Ernst, R., Dickson, A.J., Bekker, A. (Eds) Large Igneous Provinces: a driver of global environmental and biotic changes. AGU Geophysical Monograph Series 255. https://doi.org/10.1002/9781119507444
. 192Os concentrations reported here range from 28–86 pg/g and are notably lower than concentrations in older and younger Eocene sediments in the ACEX core (Fig. 2).Figure 2 Initial osmium isotope (187Os/188Osi) ratios and unradiogenic concentrations (192Os, pg g−1) of sediments deposited at IODP Site M0004A. The open ocean 187Os/188Os trend, taken from the ferromanganese crust data of Peucker-Ehrenbrink et al. (1995)
Peucker-Ehrenbrink, B., Ravizza, G., Hofmann, A.W. (1995) The marine 187Os/188Os record of the past 80 million years. Earth and Planetary Science Letters 130, 155–167. https://doi.org/10.1016/0012-821X(95)00003-U
and Pegram and Turkian (1999)Pegram, W.J., Turekian, K.K. (1999) The osmium isotopic composition change of Cenozoic sea water as inferred from a deep-sea core corrected for meteoric contributions. Geochimica et Cosmochimica Acta 63, 4053–4058, https://doi.org/10.1016/S0016-7037(99)00308-7
is shown with grey shading. Published Os datasets are from Poirier and Hillaire-Marcel (2009Poirier, A., Hillaire-Marcel, C. (2009) Os-isotope insights in major environmental changes of the Arctic Ocean during the Cenozoic. Geophysical Research Letters 36, L11602, https://doi.org/10.1029/2009GL037422
, 2011Poirier, A., Hillaire-Marcel, C. (2011) Improved Os-isotope stratigraphy of the Arctic Ocean. Geophysical Research Letters 38, L14607, https://doi.org/10.1029/2011GL047953
) and Dickson et al. (2015Dickson, A.J., Cohen, A.S., Coe, A.L., Davies, M., Shcherbinina, E.A., Gavrilov, Y.O. (2015) Evidence for weathering and volcanism during the PETM from Arctic Ocean and Peri-Tethys osmium isotope records. Palaeogeography, Palaeoclimatology, Palaeoecology 438, 300–307, https://doi.org/10.1016/j.palaeo.2015.08.019
, 2021Dickson, A.J., Cohen, A.S., Davies, M. (2021) The osmium isotope signature of Phanerozoic Large Igneous Provinces. In: Ernst, R., Dickson, A.J., Bekker, A. (Eds) Large Igneous Provinces: a driver of global environmental and biotic changes. AGU Geophysical Monograph Series 255. https://doi.org/10.1002/9781119507444
). ETM 2: Eocene Thermal Maximum 2. PETM: Paleocene–Eocene Thermal Maximum. Pal: Paleocene.top
Arctic Ocean Restriction Identified using Os Isotope Data
Changes in the 187Os/188Os ratio of seawater are caused by the fractional mixing of continental-derived radiogenic and mantle-derived unradiogenic end members. Mixing ratios can be controlled in principle by increases or decreases in the flux of either end member, by processes typically linked to continental weathering and/or changing rates of submarine volcanic activity (Peucker-Ehrenbrink and Ravizza, 2000
Peucker-Ehrenbrink, B., Ravizza, G. (2000) The marine osmium isotope record. Terra Nova 12, 205–219. https://doi.org/10.1046/j.1365-3121.2000.00295.x
). In marginal marine basins, mixing ratios may also be controlled by the degree of water mass restriction, due to the variable input of open ocean seawater imprinted with unradiogenic Os from seafloor hydrothermal systems and basalt weathering (Dickson et al., 2015Dickson, A.J., Cohen, A.S., Coe, A.L., Davies, M., Shcherbinina, E.A., Gavrilov, Y.O. (2015) Evidence for weathering and volcanism during the PETM from Arctic Ocean and Peri-Tethys osmium isotope records. Palaeogeography, Palaeoclimatology, Palaeoecology 438, 300–307, https://doi.org/10.1016/j.palaeo.2015.08.019
). Such basins may become sensitised to local radiogenic Os fluxes. The behaviour of Os isotopes in marginal marine basins can therefore be used to quantify water mass mixing rates, where an Os isotope record from within a restricted basin can be robustly correlated to a time-equivalent open ocean Os isotope signature.The Eocene Arctic Ocean satisfies these requirements because the near-continuous 187Os/188Osi record reported in this study can be compared directly with open ocean Os isotope records obtained from ferromanganese crusts and metalliferous sediments (Peucker-Ehrenbrink et al., 1995
Peucker-Ehrenbrink, B., Ravizza, G., Hofmann, A.W. (1995) The marine 187Os/188Os record of the past 80 million years. Earth and Planetary Science Letters 130, 155–167. https://doi.org/10.1016/0012-821X(95)00003-U
; Pegram and Turekian, 1999Pegram, W.J., Turekian, K.K. (1999) The osmium isotopic composition change of Cenozoic sea water as inferred from a deep-sea core corrected for meteoric contributions. Geochimica et Cosmochimica Acta 63, 4053–4058, https://doi.org/10.1016/S0016-7037(99)00308-7
). This comparison, in Figure 2, shows that although there were transient episodes of divergence between the Arctic and global Os records in the early Eocene, such as during the PETM (Dickson et al., 2015Dickson, A.J., Cohen, A.S., Coe, A.L., Davies, M., Shcherbinina, E.A., Gavrilov, Y.O. (2015) Evidence for weathering and volcanism during the PETM from Arctic Ocean and Peri-Tethys osmium isotope records. Palaeogeography, Palaeoclimatology, Palaeoecology 438, 300–307, https://doi.org/10.1016/j.palaeo.2015.08.019
), the long term divergence in the records became pronounced after Eocene Thermal Maximum 2 (ETM2), at ∼54 Ma. This divergence reached a maximum ∼49–44 Ma, a period of time that brackets the Azolla interval and the occurrence of seasonal sea ice, both linked to fresher surface water conditions (Brinkhuis et al., 2006Brinkhuis, H., Schouten, S., Collinson, M.E., Sluijs, A., Sinninghe Damsté, J.S., Dickens, G.R., Huber, M., Cronin, T.M., Onodera, J., Takahashi, K., Bujak, J.P., Stein, R., van der Burgh, J., Eldrett, J.S., Harding, I.C., Lotter, A.F., Sangiorgi, F., van Konijnenburg-van Cittert, H., de Leeuw, J.W., Matthiessen, J., Backman, J., Moran, K., Expedition 302 Scientists (2006) Episodic fresh surface waters in the Eocene Arctic Ocean. Nature 441, 606–609. https://doi.org/10.1038/nature04692
; Stickley et al., 2009Stickley, C.E., St John, K., Koc, N., Jordan, R.W., Passchier, S., Pearce, R.B., Kearns, L.E. (2009) Evidence for middle Eocene Arctic sea ice from diatoms and ice-rafted debris. Nature 460, 376–379, https://doi.org/10.1038/nature08163
). The Poirier and Hillaire-Marcel (2009)Poirier, A., Hillaire-Marcel, C. (2009) Os-isotope insights in major environmental changes of the Arctic Ocean during the Cenozoic. Geophysical Research Letters 36, L11602, https://doi.org/10.1029/2009GL037422
age model shifts the timing of maximum divergence ∼2 Myr younger. The unique comparison of the Arctic record to records from open ocean ferromanganese crusts allows us to link this long term divergence in Os isotopes to the partial closure of circum-Arctic seaways, rather than to any large scale change in continental weathering. The divergent Os isotope trends after 54 Ma are accompanied by relatively low Os concentrations (Fig. 2), which, given the associated transition to euxinic depositional conditions (März et al., 2010März, C., Schnetger, B., Brumsack, H-J. (2010) Paleoenvironmental implications of Cenozoic sediments from the central Arctic Ocean (IODP Expedition 302) using inorganic geochemistry. Paleoceanography and Paleoclimatology 25, https://doi.org/10.1029/2009PA001860
), are likely related to basin scale trace metal depletion. The data contain deviations in 187Os/188Osi that overlap with the open ocean trend (Fig. 2) which probably record ventilation events that punctuated the longer term transition to hydrographic restriction.top
Quantifying Seawater Exchanges into the Arctic Basin
We have used the divergence of the Arctic Ocean and global Os isotope records (Fig. 2) to quantify the exchange rate of open ocean seawater into the Arctic Basin. In this approach, the mass accumulation rate of Os buried in the Arctic Basin is first estimated from typical early Eocene concentrations in Site M0004A of ∼250 pg g−1 (this study and Poirier and Hillaire-Marcel, 2011
Poirier, A., Hillaire-Marcel, C. (2011) Improved Os-isotope stratigraphy of the Arctic Ocean. Geophysical Research Letters 38, L14607, https://doi.org/10.1029/2011GL047953
), a dry bulk density of 1.4 g cm−3 (O’Regan, 2008O’Regan, M. (2008) Data report: high resolution bulk density, dry density, and porosity records from the Arctic Coring Expedition, IODP Expedition 302. In: Backman, J., Moran, K., McInroy, D.B., Mayer, L.A., Expedition 302 Scientists. Proceedings of the IODP 302. Integrated Ocean Drilling Program Management International, Inc., Edinburgh. https://doi.org/10.2204/iodp.proc.302.201.2008
) and an Eocene sediment accumulation rate of 0.002 cm yr−1 (Backman et al., 2008Backman, J., Jakobsson, M., Frank, M., Sangiorgi, F., Brinkhuis, H., Stickley, C., O’Regan, M., Lvlie, R., Pälike, H., Spofforth, D., Gattacecca, J., Moran, K, King, J., Heil, C. (2008) Age model and core-seismic integration for the Cenozoic Arctic core expedition sediments from the Lomonosov Ridge. Paleoceanography and Paleoclimatology 23, PA1S03, http://doi.org/10.1029/2007PA001476
). The mass accumulation rates of Os are scaled to an Eocene Arctic ocean area of 1.05 × 1017 cm2 in order to calculate a total removal flux in pg yr−1. This removal flux anchors subsequent quantification of the input fluxes to the Arctic Basin, by assuming mass balance.The inputs of Os to the Arctic Basin come from two major sources: riverine discharge from pan-Arctic river systems and open ocean exchange through shallow seaways (North Atlantic/Fram Strait, Bering Strait, Turgay Strait). Riverine input fluxes are assigned a fixed 187Os/188Os of 1.4 (Peucker-Ehrenbrink and Jahn, 2001
Peucker-Ehrenbrink, B., Jahn, B. (2001) Rhenium-osmium isotope systematics and platinum group element concentrations: loess and the upper continental crust. Geochemistry, Geophysics, Geosystems 2, 2001GC000172, https://doi.org/10.1029/2001GC000172
) and open ocean seawater 187Os/188Os is calculated as 2 million year averages of Fe/Mn-crust and metalliferous sediment data between 56–44 Ma (Table S-2). The magnitudes of each flux (friv, fsw) are iteratively adjusted to obtain a match with the observed ACEX 187Os/188Osi, which is assumed to record Arctic seawater:Eq. 1

These fractions (friv, fsw) are scaled to the total Os removal mass for each 2 million year interval to obtain the mass of Os inputs (Osriv, Ossw), assuming approximate basin scale mass balance over the 2 million year calculation intervals. A key requirement is to simulate declining Arctic Ocean seawater concentrations with increasing basin restriction. Osriv is thus held constant from the 56–54 Ma (most ‘open’) calculation, allowing declining values of Ossw to cause a decline in Arctic seawater Os concentrations. A final step is to convert Osriv and Ossw to seawater volumes using ocean and river concentrations, initially assumed to be comparable to modern values of ∼11 pg l−1 (Levasseur et al., 1998
Levasseur, S., Birck, J-L., Allègre, C.J. (1998) Direct measurement of femtomoles of osmium and the 187Os/186Os ratio in seawater. Science 282, 272–274, https://doi.org/10.1126/science.282.5387.272
) and ∼8 pg l−1 (Levasseur et al., 1999Levasseur, S., Birck, J-L., Allègre, C.J. (1999) The osmium riverine flux and the oceanic mass balance of osmium. Earth and Planetary Science Letters 174, 7–23, https://doi.org/10.1016/S0012-821X(99)00259-9
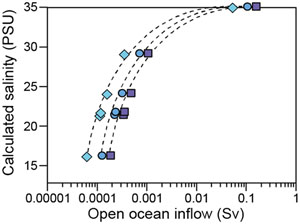
), respectively. friv and fsw are used to calculate Arctic salinity by assigning end member values of ∼0 PSU and ∼35 PSU.The effect of basin scale redox conditions on Os burial, basin size, sediment accumulation rates and sedimentary Os concentrations on the model are tested by varying Os burial rates. Other sensitivity tests include varying Arctic river 187Os/188Os ratios, a change that would affect friv and fsw; and varying the concentrations of Os in open ocean seawater and Arctic river waters, parameters that affect the volumes of water (and hence seawater exchange rates) calculated from Osriv and Ossw. The calculations are illustrated in Figure 3 and documented in Tables S-3 to S-5.
Figure 3 Calculated rates of open ocean seawater inflow to the Arctic Ocean, and Arctic Basin salinities. (a) Sensitivity tests of varying Os burial fluxes. (b) Sensitivity tests of varying pan-Arctic river compositions. (c) Sensitivity tests of varying the Os concentration in open ocean seawater and Arctic Rivers. BSI: modern Black Sea inflow of ∼0.0097 Sv from Özsoy and Ünlüata (1997)
Özsoy, E., Ünlüata, Ü (1997) Oceanography of the Black Sea: a review of some recent results. Earth-Science Reviews 42, 231–272, https://doi.org/10.1016/S0012-8252(97)81859-4
.Oceanic exchange rates are ∼0.2 Sv for the Early Eocene (∼56 Ma) and decline to a minimum of ∼0.0001–0.0002 Sv by 48–46 Ma before increasing slightly by 46–44 Ma. The multi-million year divergent trend in 187Os/188Os, which starts after ∼54 Ma and parallels a switch to a persistently euxinic, silled Arctic Basin (März et al., 2010
März, C., Schnetger, B., Brumsack, H-J. (2010) Paleoenvironmental implications of Cenozoic sediments from the central Arctic Ocean (IODP Expedition 302) using inorganic geochemistry. Paleoceanography and Paleoclimatology 25, https://doi.org/10.1029/2009PA001860
), is accompanied by a decline in seawater exchange in all sensitivity tests to below ∼0.01 Sv. This value is close to the modern exchange rate of Mediterranean seawater through the Bosphorus into the Black Sea (∼0.0097 Sv; Özsoy and Ünlüata, 1997Özsoy, E., Ünlüata, Ü (1997) Oceanography of the Black Sea: a review of some recent results. Earth-Science Reviews 42, 231–272, https://doi.org/10.1016/S0012-8252(97)81859-4
), where modern sediment 187Os/188Os ratios have also been characterised by mixing between seawater and local detrital end members (Ravizza et al., 1991Ravizza, G., Turekian, K.K., Hay, B.J. (1991) The geochemistry of rhenium and osmium in recent sediments from the Black Sea. Geochimica et Cosmochimica Acta 55, 3741–3752, https://doi.org/10.1016/0016-7037(91)90072-D
), and is ∼1000 times lower than modern exchanges across the Fram Strait (Jakobsson et al., 2007Jakobsson, M., Backman, J., Rudels, B., Nycander, J., Frank, M., Mayer, L., Jokat, W., Sangiorgi, F., O’Regan, M., Brinkhuis, H., King, J and Moran, K. (2007) The early Miocene onset of a ventilated regime in the Arctic Ocean. Nature 447, 986–990, https://doi.org/10.1038/nature05924
). Calculated Arctic salinities decrease to 7–25 PSU by 46–48 Ma, depending on the model conditions. This range is consistent with oxygen and strontium isotope salinity reconstructions of ∼2–24 PSU for the same time interval (Waddell and Moore, 2008Waddell, L.M., Moore, T.C. (2008) Salinity of the Eocene Arctic Ocean from oxygen isotope analysis of fish bone carbonate. Paleoceanography and Paleoclimatology 23, PA1S12, https://doi.org/10.1029/2007PA001451
; Gleason et al., 2009Gleason, J.D., Thomas, D.J., Moore Jr, T.C., Blum, J.D., Owen, R.M., Haley, B.A. (2009) Early to middle Eocene history of the Arctic Ocean from Nd-Sr isotopes in fossil fish debris, Lomonosov Ridge. Paleoceanography and Paleoclimatology 24, PA2215, https://doi.org/10.1029/2008PA001685
), but is higher than the ∼1–6 PSU salinities required for the proliferation of Azolla ferns (Brinkhuis et al., 2006Brinkhuis, H., Schouten, S., Collinson, M.E., Sluijs, A., Sinninghe Damsté, J.S., Dickens, G.R., Huber, M., Cronin, T.M., Onodera, J., Takahashi, K., Bujak, J.P., Stein, R., van der Burgh, J., Eldrett, J.S., Harding, I.C., Lotter, A.F., Sangiorgi, F., van Konijnenburg-van Cittert, H., de Leeuw, J.W., Matthiessen, J., Backman, J., Moran, K., Expedition 302 Scientists (2006) Episodic fresh surface waters in the Eocene Arctic Ocean. Nature 441, 606–609. https://doi.org/10.1038/nature04692
). The discrepancy with the latter study is probably because the Os based estimates here are basin scale averages, whereas Azolla would typically colonise the upper, salinity stratified part of the water column. We note that the open ocean salinity end member used in the calculations is higher than modelled North Atlantic salinities under conditions of limited Arctic exchange (Roberts et al., 2009Roberts, C.D., LeGrande, A.N., Tripati, A.K. (2009) Climate sensitivity to Arctic seaway restriction during the early Paleogene. Earth and Planetary Science Letters 286, 576–585, https://doi.org/10.1016/j.epsl.2009.07.026
; Stärz et al., 2017Stärz, M., Jokat, W., Knorr, G., Lohmann, G. (2017) Threshold in North Atlantic-Arctic Ocean circulation controlled by the subsidence of the Greenland-Scotland ridge. Nature Communications 8, 15681, https://doi.org/10.1038/ncomms15681
). Lowering the marine end member to ∼20 PSU further reduces the minimum Arctic Basin salinity during the period of maximum restriction (48–46 Ma) by 7–9 PSU across the various sensitivity tests. Use of the Poirier and Hillaire-Marcel (2009)Poirier, A., Hillaire-Marcel, C. (2009) Os-isotope insights in major environmental changes of the Arctic Ocean during the Cenozoic. Geophysical Research Letters 36, L11602, https://doi.org/10.1029/2009GL037422
ACEX age model does not significantly affect the magnitude of the hydrographic calculations, but shifts the timing of minimum salinity to younger ages by ∼2 Myr.Closure of the Arctic Ocean has been suggested as a cause of transient and/or persistent deep water overturning in the North Atlantic and North Pacific Oceans, due to a reduction in freshwater export to regions of overturning (Roberts et al., 2009
Roberts, C.D., LeGrande, A.N., Tripati, A.K. (2009) Climate sensitivity to Arctic seaway restriction during the early Paleogene. Earth and Planetary Science Letters 286, 576–585, https://doi.org/10.1016/j.epsl.2009.07.026
; Cope and Winguth, 2011Cope, J.T., Winguth, A. (2011) On the sensitivity of ocean circulation to arctic freshwater input during the Paleocene/Eocene Thermal Maximum. Palaeogeography, Palaeoclimatology, Palaeoecology 306, 82–94. https://doi.org/10.1016/j.palaeo.2011.03.032
; Hutchinson et al., 2019Hutchinson, D.K., Coxall, H.K., O’Regan, M., Nilsson, J., Caballero, R., de Boer, A.M. (2019) Arctic closure as a trigger for Atlantic overturning at the Eocene–Oligocene transition. Nature Communications 10, 3797, https://doi.org/10.1038/s41467-019-11828-z
). Our Os-based reconstruction of Arctic exchanges supports these ideas and provides quantitative constraints on water exchange rates. The use of Os isotope data to quantify hydrographic parameters can complement existing approaches to inferring basin hydrography using elemental proxies (Algeo and Lyons, 2006Algeo, T.J., Lyons, T.W. (2006) Mo-total organic carbon covariation in modern anoxic marine environments: implications for the analysis of colorredox and paleohydrologic conditions. Paleoceanography and Paleoclimatology 21, https://doi.org/10.1029/2004PA001112
; Sweere et al., 2016Sweere, T., van den Boorn, S., Dickson, A.J., Reichart, G-J. (2016) Definition of new trace-metal proxies for the controls on organic matter enrichment in marine sediments based on Mn, Co, Mo and Cd concentrations. Chemical Geology 441, 235–245, https://doi.org/10.1016/j.chemgeo.2016.08.028
) but requires overcoming the hurdle of obtaining an open ocean Os isotope record that is time equivalent to one produced from a marginal basin. This goal may be difficult for some ancient time intervals for which deep ocean sedimentary deposits are not accessible. If the Eocene Arctic Ocean Os record were transposed, for example, into some distant part of Earth’s history where an open ocean counterpart was lacking, the data might be incorrectly interpreted to represent a period of exaggerated continental weathering.top
Acknowledgements
This study was funded by the Natural Environmental Research Council (NE/K006223/1).
Editor: Gavin Foster
top
References
Algeo, T.J., Lyons, T.W. (2006) Mo-total organic carbon covariation in modern anoxic marine environments: implications for the analysis of colorredox and paleohydrologic conditions. Paleoceanography and Paleoclimatology 21, https://doi.org/10.1029/2004PA001112
 Show in context
 The use of Os isotope data to quantify hydrographic parameters can complement existing approaches to inferring basin hydrography using elemental proxies (Algeo and Lyons, 2006; Sweere et al., 2016) but requires overcoming the hurdle of obtaining an open ocean Os isotope record that is time equivalent to one produced from a marginal basin.
View in article
Backman, J., Jakobsson, M., Frank, M., Sangiorgi, F., Brinkhuis, H., Stickley, C., O’Regan, M., Lvlie, R., Pälike, H., Spofforth, D., Gattacecca, J., Moran, K, King, J., Heil, C. (2008) Age model and core-seismic integration for the Cenozoic Arctic core expedition sediments from the Lomonosov Ridge. Paleoceanography and Paleoclimatology 23, PA1S03, http://doi.org/10.1029/2007PA001476
Show in context Initial 187Os/188Os ratios (187Os/188Osi) were calculated with a Re decay constant of 1.666 x 10⁻¹¹ and a depositional age interpolated from the age model of Backman et al. (2008).
View in article
In this approach, the mass accumulation rate of Os buried in the Arctic Basin is first estimated from typical early Eocene concentrations in Site M0004A of ∼250 pg g−1 (this study and Poirier and Hillaire-Marcel, 2011), a dry bulk density of 1.4 g cm−3 (O’Regan, 2008) and an Eocene sediment accumulation rate of 0.002 cm yr−1 (Backman et al., 2008).
View in article
Birck, J-L., Roy Barman, M., Capmas, F. (1997) Re-Os measurements at the femtomole level in natural samples. Geostandards Newsletter 21, 19–27. http://doi.org/10.1111/j.1751-908X.1997.tb00528.x
Show in context Os was extracted from the chilled digest with CCl4, then back extracted into HBr and micro-distilled using Cr(VI)-H2SO4 (Cohen and Waters, 1996; Birck et al., 1997).
View in article
Blakey, R. (2020) Paleotectonic and paleogeographic history of the Arctic region. Atlantic Geology 57, 7–39, http://doi.org/10.4138/atlgeol.2021.002
Show in context Simplified map adapted from Blakey (2020).
View in article
Brinkhuis, H., Schouten, S., Collinson, M.E., Sluijs, A., Sinninghe Damsté, J.S., Dickens, G.R., Huber, M., Cronin, T.M., Onodera, J., Takahashi, K., Bujak, J.P., Stein, R., van der Burgh, J., Eldrett, J.S., Harding, I.C., Lotter, A.F., Sangiorgi, F., van Konijnenburg-van Cittert, H., de Leeuw, J.W., Matthiessen, J., Backman, J., Moran, K., Expedition 302 Scientists (2006) Episodic fresh surface waters in the Eocene Arctic Ocean. Nature 441, 606–609. https://doi.org/10.1038/nature04692
Show in context By reducing the exchange of high salinity water, these tectonically driven events triggered a change to brackish/freshwater conditions in the basin during the late Early Eocene, as recorded by the well documented presence of the freshwater fern Azolla during the period ∼49–48 Ma (Brinkhuis et al., 2006).
View in article
This divergence reached a maximum ∼49–44 Ma, a period of time that brackets the Azolla interval and the occurrence of seasonal sea ice, both linked to fresher surface water conditions (Brinkhuis et al., 2006; Stickley et al., 2009).
View in article
This range is consistent with oxygen and strontium isotope salinity reconstructions of ∼2–24 PSU for the same time interval (Waddell and Moore, 2008; Gleason et al., 2009), but is higher than the ∼1–6 PSU salinities required for the proliferation of Azolla ferns (Brinkhuis et al., 2006).
View in article
Cohen, A.S., Waters, F.G. (1996) Separation of osmium from geological materials by solvent extraction for analysis by thermal ionisation mass spectrometry. Analytica Chimica Acta 332, 269–275. https://doi.org/10.1016/0003-2670(96)00226-7
Show in context Os was extracted from the chilled digest with CCl4, then back extracted into HBr and micro-distilled using Cr(VI)-H2SO4 (Cohen and Waters, 1996; Birck et al., 1997).
View in article
Cope, J.T., Winguth, A. (2011) On the sensitivity of ocean circulation to arctic freshwater input during the Paleocene/Eocene Thermal Maximum. Palaeogeography, Palaeoclimatology, Palaeoecology 306, 82–94. https://doi.org/10.1016/j.palaeo.2011.03.032
Show in context Exchanges of heat and salt between the Arctic, Pacific, Atlantic and Tethys oceans would have been important factors controlling Eocene ocean circulation patterns and meridional heat transport, but model simulations disagree on the magnitude of circulation changes that may have been caused by progressive restriction (Roberts et al., 2009; Cope and Winguth, 2011).
View in article
Closure of the Arctic Ocean has been suggested as a cause of transient and/or persistent deep water overturning in the North Atlantic and North Pacific Oceans, due to a reduction in freshwater export to regions of overturning (Roberts et al., 2009; Cope and Winguth, 2011; Hutchinson et al., 2019).
View in article
Dickson, A.J., Cohen, A.S., Coe, A.L. (2012) Seawater oxygenation during the Paleocene-Eocene Thermal Maximum. Geology 40, 637–642, https://doi.org/10.1130/G32977.1
Show in context Reduced inflow of open ocean waters also caused the Arctic Ocean to evolve to anoxic-sulfidic depositional conditions, both over the long term duration of the Early–Middle Eocene (März et al., 2010) and over shorter hyperthermal events such as the Paleocene–Eocene Thermal Maximum (Dickson et al., 2012).
View in article
Dickson, A.J., Cohen, A.S., Coe, A.L., Davies, M., Shcherbinina, E.A., Gavrilov, Y.O. (2015) Evidence for weathering and volcanism during the PETM from Arctic Ocean and Peri-Tethys osmium isotope records. Palaeogeography, Palaeoclimatology, Palaeoecology 438, 300–307, https://doi.org/10.1016/j.palaeo.2015.08.019
Show in context These measurements span the period 55.1–44.7 Ma and link the data published by Dickson et al. (2015, 2021) for the PETM and Eocene Thermal Maximum 2 (ETM-2) to the Middle Eocene (and younger) Os data published by Poirier and Hillaire-Marcel (2009, 2011).
View in article
Published Os datasets are from Poirier and Hillaire-Marcel (2009, 2011) and Dickson et al. (2015, 2021).
View in article
In marginal marine basins, mixing ratios may also be controlled by the degree of water mass restriction, due to the variable input of open ocean seawater imprinted with unradiogenic Os from seafloor hydrothermal systems and basalt weathering (Dickson et al., 2015).
View in article
This comparison, in Figure 2, shows that although there were transient episodes of divergence between the Arctic and global Os records in the early Eocene, such as during the PETM (Dickson et al., 2015), the long term divergence in the records became pronounced after Eocene Thermal Maximum 2 (ETM2), at ∼54 Ma.
View in article
Dickson, A.J., Cohen, A.S., Davies, M. (2021) The osmium isotope signature of Phanerozoic Large Igneous Provinces. In: Ernst, R., Dickson, A.J., Bekker, A. (Eds) Large Igneous Provinces: a driver of global environmental and biotic changes. AGU Geophysical Monograph Series 255. https://doi.org/10.1002/9781119507444
Show in context These measurements span the period 55.1–44.7 Ma and link the data published by Dickson et al. (2015, 2021) for the PETM and Eocene Thermal Maximum 2 (ETM-2) to the Middle Eocene (and younger) Os data published by Poirier and Hillaire-Marcel (2009, 2011).
View in article
187Os/188Osi ratios in the lower part of the section are similar to those published for Eocene Thermal Maximum 2 (ETM-2) by Dickson et al. (2021).
View in article
Published Os datasets are from Poirier and Hillaire-Marcel (2009, 2011) and Dickson et al. (2015, 2021).
View in article
Gleason, J.D., Thomas, D.J., Moore Jr, T.C., Blum, J.D., Owen, R.M., Haley, B.A. (2009) Early to middle Eocene history of the Arctic Ocean from Nd-Sr isotopes in fossil fish debris, Lomonosov Ridge. Paleoceanography and Paleoclimatology 24, PA2215, https://doi.org/10.1029/2008PA001685
Show in context Oxygen, neodymium, and strontium isotope data indicate low salinity conditions (Waddell and Moore, 2008; Gleason et al., 2009), which may have facilitated sea ice growth and an enhanced polar albedo effect in the middle Eocene (Stickley et al., 2009).
View in article
This range is consistent with oxygen and strontium isotope salinity reconstructions of ∼2–24 PSU for the same time interval (Waddell and Moore, 2008; Gleason et al., 2009), but is higher than the ∼1–6 PSU salinities required for the proliferation of Azolla ferns (Brinkhuis et al., 2006).
View in article
Hutchinson, D.K., Coxall, H.K., O’Regan, M., Nilsson, J., Caballero, R., de Boer, A.M. (2019) Arctic closure as a trigger for Atlantic overturning at the Eocene–Oligocene transition. Nature Communications 10, 3797, https://doi.org/10.1038/s41467-019-11828-z
Show in context Despite being well characterised, the timing of hydrographic restriction in the Arctic Basin is uncertain (Moran et al., 2006) and the water mass exchange rates that contributed to restricted conditions are not well quantified by hydrographic models (e.g., Stärz et al., 2017; Hutchinson et al., 2019).
View in article
Closure of the Arctic Ocean has been suggested as a cause of transient and/or persistent deep water overturning in the North Atlantic and North Pacific Oceans, due to a reduction in freshwater export to regions of overturning (Roberts et al., 2009; Cope and Winguth, 2011; Hutchinson et al., 2019).
View in article
Jakobsson, M., Backman, J., Rudels, B., Nycander, J., Frank, M., Mayer, L., Jokat, W., Sangiorgi, F., O’Regan, M., Brinkhuis, H., King, J and Moran, K. (2007) The early Miocene onset of a ventilated regime in the Arctic Ocean. Nature 447, 986–990, https://doi.org/10.1038/nature05924
Show in context This value is close to the modern exchange rate of Mediterranean seawater through the Bosphorus into the Black Sea (∼0.0097 Sv; Özsoy and Ünlüata, 1997), where modern sediment 187Os/188Os ratios have also been characterised by mixing between seawater and local detrital end members (Ravizza et al., 1991), and is ∼1000 times lower than modern exchanges across the Fram Strait (Jakobsson et al., 2007).
View in article
Levasseur, S., Birck, J-L., Allègre, C.J. (1998) Direct measurement of femtomoles of osmium and the 187Os/186Os ratio in seawater. Science 282, 272–274, https://doi.org/10.1126/science.282.5387.272
Show in context A final step is to convert Osriv and Ossw to seawater volumes using ocean and river concentrations, initially assumed to be comparable to modern values of ∼11 pg l−1 (Levasseur et al., 1998) and ∼8 pg l−1 (Levasseur et al., 1999), respectively. friv and fsw are used to calculate Arctic salinity by assigning end member values of ∼0 PSU and ∼35 PSU.
View in article
Levasseur, S., Birck, J-L., Allègre, C.J. (1999) The osmium riverine flux and the oceanic mass balance of osmium. Earth and Planetary Science Letters 174, 7–23, https://doi.org/10.1016/S0012-821X(99)00259-9
Show in context A final step is to convert Osriv and Ossw to seawater volumes using ocean and river concentrations, initially assumed to be comparable to modern values of ∼11 pg l−1 (Levasseur et al., 1998) and ∼8 pg l−1 (Levasseur et al., 1999), respectively. friv and fsw are used to calculate Arctic salinity by assigning end member values of ∼0 PSU and ∼35 PSU.
View in article
März, C., Schnetger, B., Brumsack, H-J. (2010) Paleoenvironmental implications of Cenozoic sediments from the central Arctic Ocean (IODP Expedition 302) using inorganic geochemistry. Paleoceanography and Paleoclimatology 25, https://doi.org/10.1029/2009PA001860
Show in context Reduced inflow of open ocean waters also caused the Arctic Ocean to evolve to anoxic-sulfidic depositional conditions, both over the long term duration of the Early–Middle Eocene (März et al., 2010) and over shorter hyperthermal events such as the Paleocene–Eocene Thermal Maximum (Dickson et al., 2012).
View in article
The divergent Os isotope trends after 54 Ma are accompanied by relatively low Os concentrations (Fig. 2), which, given the associated transition to euxinic depositional conditions (März et al., 2010), are likely related to basin scale trace metal depletion.
View in article
The multi-million year divergent trend in 187Os/188Os, which starts after ∼54 Ma and parallels a switch to a persistently euxinic, silled Arctic Basin (März et al., 2010), is accompanied by a decline in seawater exchange in all sensitivity tests to below ∼0.01 Sv.
View in article
Moran, K., Backman, J., Brinkhuis, H., Clemens, S.C., Cronin, T., Dickens, G.R., Eynaud, F., Gattacceca, J., Jakobsson, M., Jordan, R.W., Kaminski, M., King, J., Koc, N., Krylov, A., Martinez, N., Matthiessen, J., McInroy, D., Moore, T.C., Onodera, J., O’Regan, M., Pälike, H., Rea, B., Rio, D., Sakamoto, T., Smith, D.C., Stein, R., St John, K., Suto, I., Suzuki, N., Takahashi, K., Watanabe, M., Yamamoto, M., Farrell, J., Frank, M., Kubik, P., Jokat, W., Kristoffersen, Y. (2006) The Cenozoic palaeoenvironment of the Arctic Ocean. Nature 441, 601–605, https://doi.org/10.1038/nature04800
Show in context The Paleogene Arctic Ocean became hydrographically restricted in the Early to Middle Eocene due to both the closure of the Turgay Strait in northern Eurasia, and the progressive shoaling of the North Atlantic ridge, which probably acted as a valve for water exchange with the northern polar latitudes (Moran et al., 2006; Stärz et al., 2017; Fig. 1).
View in article
Despite being well characterised, the timing of hydrographic restriction in the Arctic Basin is uncertain (Moran et al., 2006) and the water mass exchange rates that contributed to restricted conditions are not well quantified by hydrographic models (e.g., Stärz et al., 2017; Hutchinson et al., 2019).
View in article
O’Regan, M. (2008) Data report: high resolution bulk density, dry density, and porosity records from the Arctic Coring Expedition, IODP Expedition 302. In: Backman, J., Moran, K., McInroy, D.B., Mayer, L.A., Expedition 302 Scientists. Proceedings of the IODP 302. Integrated Ocean Drilling Program Management International, Inc., Edinburgh. https://doi.org/10.2204/iodp.proc.302.201.2008
Show in context In this approach, the mass accumulation rate of Os buried in the Arctic Basin is first estimated from typical early Eocene concentrations in Site M0004A of ∼250 pg g−1 (this study and Poirier and Hillaire-Marcel, 2011), a dry bulk density of 1.4 g cm−3 (O’Regan, 2008) and an Eocene sediment accumulation rate of 0.002 cm yr−1 (Backman et al., 2008).
View in article
Özsoy, E., Ünlüata, Ü (1997) Oceanography of the Black Sea: a review of some recent results. Earth-Science Reviews 42, 231–272, https://doi.org/10.1016/S0012-8252(97)81859-4
Show in context BSI: modern Black Sea inflow of ∼0.0097 Sv from Özsoy and Ünlüata (1997).
View in article
This value is close to the modern exchange rate of Mediterranean seawater through the Bosphorus into the Black Sea (∼0.0097 Sv; Özsoy and Ünlüata, 1997), where modern sediment 187Os/188Os ratios have also been characterised by mixing between seawater and local detrital end members (Ravizza et al., 1991), and is ∼1000 times lower than modern exchanges across the Fram Strait (Jakobsson et al., 2007).
View in article
Pegram, W.J., Turekian, K.K. (1999) The osmium isotopic composition change of Cenozoic sea water as inferred from a deep-sea core corrected for meteoric contributions. Geochimica et Cosmochimica Acta 63, 4053–4058, https://doi.org/10.1016/S0016-7037(99)00308-7
Show in context The open ocean 187Os/188Os trend, taken from the ferromanganese crust data of Peucker-Ehrenbrink et al. (1995) and Pegram and Turkian (1999) is shown with grey shading.
View in article
The Eocene Arctic Ocean satisfies these requirements because the near-continuous 187Os/188Osi record reported in this study can be compared directly with open ocean Os isotope records obtained from ferromanganese crusts and metalliferous sediments (Peucker-Ehrenbrink et al., 1995; Pegram and Turekian, 1999).
View in article
Peucker-Ehrenbrink, B., Jahn, B. (2001) Rhenium-osmium isotope systematics and platinum group element concentrations: loess and the upper continental crust. Geochemistry, Geophysics, Geosystems 2, 2001GC000172, https://doi.org/10.1029/2001GC000172
Show in context Riverine input fluxes are assigned a fixed 187Os/188Os of 1.4 (Peucker-Ehrenbrink and Jahn, 2001) and open ocean seawater 187Os/188Os is calculated as 2 million year averages of Fe/Mn-crust and metalliferous sediment data between 56–44 Ma (Table S-2).
View in article
Peucker-Ehrenbrink, B., Ravizza, G. (2000) The marine osmium isotope record. Terra Nova 12, 205–219. https://doi.org/10.1046/j.1365-3121.2000.00295.x
Show in context Mixing ratios can be controlled in principle by increases or decreases in the flux of either end member, by processes typically linked to continental weathering and/or changing rates of submarine volcanic activity (Peucker-Ehrenbrink and Ravizza, 2000).
View in article
Peucker-Ehrenbrink, B., Ravizza, G., Hofmann, A.W. (1995) The marine 187Os/188Os record of the past 80 million years. Earth and Planetary Science Letters 130, 155–167. https://doi.org/10.1016/0012-821X(95)00003-U
Show in context The open ocean 187Os/188Os trend, taken from the ferromanganese crust data of Peucker-Ehrenbrink et al. (1995) and Pegram and Turkian (1999) is shown with grey shading.
View in article
The Eocene Arctic Ocean satisfies these requirements because the near-continuous 187Os/188Osi record reported in this study can be compared directly with open ocean Os isotope records obtained from ferromanganese crusts and metalliferous sediments (Peucker-Ehrenbrink et al., 1995; Pegram and Turekian, 1999).
View in article
Poirier, A., Hillaire-Marcel, C. (2009) Os-isotope insights in major environmental changes of the Arctic Ocean during the Cenozoic. Geophysical Research Letters 36, L11602, https://doi.org/10.1029/2009GL037422
Show in context These measurements span the period 55.1–44.7 Ma and link the data published by Dickson et al. (2015, 2021) for the PETM and Eocene Thermal Maximum 2 (ETM-2) to the Middle Eocene (and younger) Os data published by Poirier and Hillaire-Marcel (2009, 2011).
View in article
The part of the ACEX core below ∼300 mcd is not affected by the alternative age model of Poirier and Hillaire-Marcel (2009) but core levels above ∼300 mcd would be progressively shifted to younger ages by up to 7 Myr. The choice of age model therefore has a small effect on the calculation of 187Os/188Osi (Fig. S-1).
View in article
Published Os datasets are from Poirier and Hillaire-Marcel (2009, 2011) and Dickson et al. (2015, 2021).
View in article
The Poirier and Hillaire-Marcel (2009) age model shifts the timing of maximum divergence ∼2 Myr younger.
View in article
Use of the Poirier and Hillaire-Marcel (2009) ACEX age model does not significantly affect the magnitude of the hydrographic calculations, but shifts the timing of minimum salinity to younger ages by ∼2 Myr.
View in article
Poirier, A., Hillaire-Marcel, C. (2011) Improved Os-isotope stratigraphy of the Arctic Ocean. Geophysical Research Letters 38, L14607, https://doi.org/10.1029/2011GL047953
Show in context These measurements span the period 55.1–44.7 Ma and link the data published by Dickson et al. (2015, 2021) for the PETM and Eocene Thermal Maximum 2 (ETM-2) to the Middle Eocene (and younger) Os data published by Poirier and Hillaire-Marcel (2009, 2011).
View in article
187Os/188Osi ratios overlap the values previously published by Poirer and Hillaire-Marcel (2011) for the upper part of the studied section.
View in article
Published Os datasets are from Poirier and Hillaire-Marcel (2009, 2011) and Dickson et al. (2015, 2021).
View in article
In this approach, the mass accumulation rate of Os buried in the Arctic Basin is first estimated from typical early Eocene concentrations in Site M0004A of ∼250 pg g−1 (this study and Poirier and Hillaire-Marcel, 2011), a dry bulk density of 1.4 g cm−3 (O’Regan, 2008) and an Eocene sediment accumulation rate of 0.002 cm yr−1 (Backman et al., 2008).
View in article
Ravizza, G., Turekian, K.K., Hay, B.J. (1991) The geochemistry of rhenium and osmium in recent sediments from the Black Sea. Geochimica et Cosmochimica Acta 55, 3741–3752, https://doi.org/10.1016/0016-7037(91)90072-D
Show in context This value is close to the modern exchange rate of Mediterranean seawater through the Bosphorus into the Black Sea (∼0.0097 Sv; Özsoy and Ünlüata, 1997), where modern sediment 187Os/188Os ratios have also been characterised by mixing between seawater and local detrital end members (Ravizza et al., 1991), and is ∼1000 times lower than modern exchanges across the Fram Strait (Jakobsson et al., 2007).
View in article
Roberts, C.D., LeGrande, A.N., Tripati, A.K. (2009) Climate sensitivity to Arctic seaway restriction during the early Paleogene. Earth and Planetary Science Letters 286, 576–585, https://doi.org/10.1016/j.epsl.2009.07.026
Show in context Exchanges of heat and salt between the Arctic, Pacific, Atlantic and Tethys oceans would have been important factors controlling Eocene ocean circulation patterns and meridional heat transport, but model simulations disagree on the magnitude of circulation changes that may have been caused by progressive restriction (Roberts et al., 2009; Cope and Winguth, 2011).
View in article
We note that the open ocean salinity end member used in the calculations is higher than modelled North Atlantic salinities under conditions of limited Arctic exchange (Roberts et al., 2009; Stärz et al., 2017).
View in article
Closure of the Arctic Ocean has been suggested as a cause of transient and/or persistent deep water overturning in the North Atlantic and North Pacific Oceans, due to a reduction in freshwater export to regions of overturning (Roberts et al., 2009; Cope and Winguth, 2011; Hutchinson et al., 2019).
View in article
Stärz, M., Jokat, W., Knorr, G., Lohmann, G. (2017) Threshold in North Atlantic-Arctic Ocean circulation controlled by the subsidence of the Greenland-Scotland ridge. Nature Communications 8, 15681, https://doi.org/10.1038/ncomms15681
Show in context The Paleogene Arctic Ocean became hydrographically restricted in the Early to Middle Eocene due to both the closure of the Turgay Strait in northern Eurasia, and the progressive shoaling of the North Atlantic ridge, which probably acted as a valve for water exchange with the northern polar latitudes (Moran et al., 2006; Stärz et al., 2017; Fig. 1).
View in article
Despite being well characterised, the timing of hydrographic restriction in the Arctic Basin is uncertain (Moran et al., 2006) and the water mass exchange rates that contributed to restricted conditions are not well quantified by hydrographic models (e.g., Stärz et al., 2017; Hutchinson et al., 2019).
View in article
We note that the open ocean salinity end member used in the calculations is higher than modelled North Atlantic salinities under conditions of limited Arctic exchange (Roberts et al., 2009; Stärz et al., 2017).
View in article
Stickley, C.E., St John, K., Koc, N., Jordan, R.W., Passchier, S., Pearce, R.B., Kearns, L.E. (2009) Evidence for middle Eocene Arctic sea ice from diatoms and ice-rafted debris. Nature 460, 376–379, https://doi.org/10.1038/nature08163
Show in context Oxygen, neodymium, and strontium isotope data indicate low salinity conditions (Waddell and Moore, 2008; Gleason et al., 2009), which may have facilitated sea ice growth and an enhanced polar albedo effect in the middle Eocene (Stickley et al., 2009).
View in article
This divergence reached a maximum ∼49–44 Ma, a period of time that brackets the Azolla interval and the occurrence of seasonal sea ice, both linked to fresher surface water conditions (Brinkhuis et al., 2006; Stickley et al., 2009).
View in article
Sweere, T., van den Boorn, S., Dickson, A.J., Reichart, G-J. (2016) Definition of new trace-metal proxies for the controls on organic matter enrichment in marine sediments based on Mn, Co, Mo and Cd concentrations. Chemical Geology 441, 235–245, https://doi.org/10.1016/j.chemgeo.2016.08.028
Show in context The use of Os isotope data to quantify hydrographic parameters can complement existing approaches to inferring basin hydrography using elemental proxies (Algeo and Lyons, 2006; Sweere et al., 2016) but requires overcoming the hurdle of obtaining an open ocean Os isotope record that is time equivalent to one produced from a marginal basin.
View in article
Waddell, L.M., Moore, T.C. (2008) Salinity of the Eocene Arctic Ocean from oxygen isotope analysis of fish bone carbonate. Paleoceanography and Paleoclimatology 23, PA1S12, https://doi.org/10.1029/2007PA001451
Show in context Oxygen, neodymium, and strontium isotope data indicate low salinity conditions (Waddell and Moore, 2008; Gleason et al., 2009), which may have facilitated sea ice growth and an enhanced polar albedo effect in the middle Eocene (Stickley et al., 2009).
View in article
This range is consistent with oxygen and strontium isotope salinity reconstructions of ∼2–24 PSU for the same time interval (Waddell and Moore, 2008; Gleason et al., 2009), but is higher than the ∼1–6 PSU salinities required for the proliferation of Azolla ferns (Brinkhuis et al., 2006).
View in article
top
Supplementary Information
The Supplementary Information includes:
Download Table S-1 (xlsx)
Download the Supplementary Information (PDF)
Figures

Figure 1 Palaeogeography of the Arctic region at ca. 50 Ma. Simplified map adapted from Blakey (2020)
Blakey, R. (2020) Paleotectonic and paleogeographic history of the Arctic region. Atlantic Geology 57, 7–39, http://doi.org/10.4138/atlgeol.2021.002
. Oceanic straits allowing periodic exchanges of water into the Arctic are marked with arrows. TS: Turgay Strait. NAR: North Atlantic Ridge. BS: Bering Strait. SB: Sverdrup basin.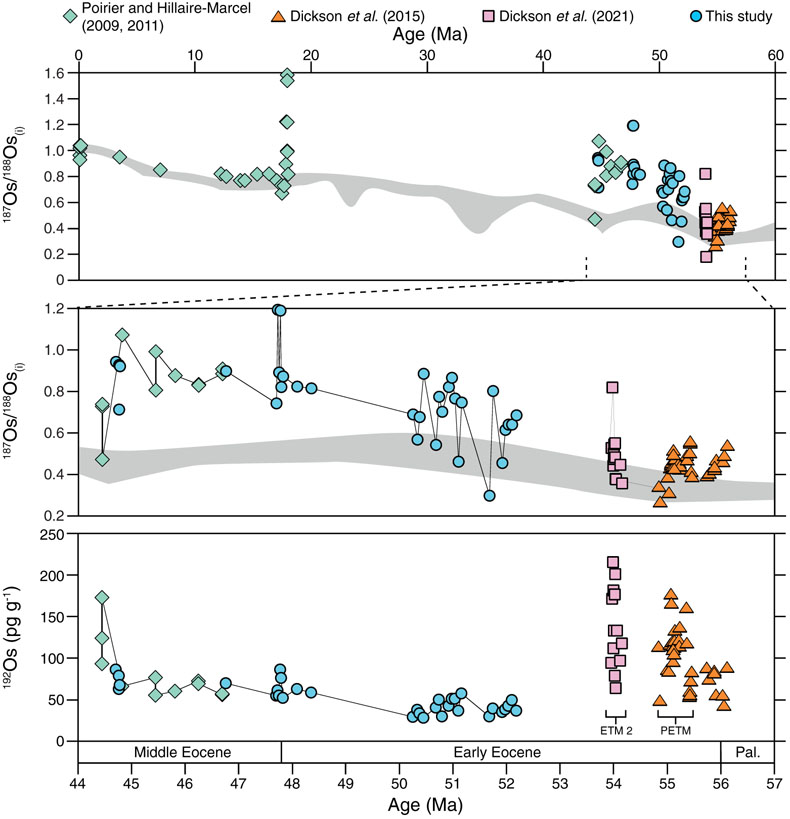
Figure 2 Initial osmium isotope (187Os/188Osi) ratios and unradiogenic concentrations (192Os, pg g−1) of sediments deposited at IODP Site M0004A. The open ocean 187Os/188Os trend, taken from the ferromanganese crust data of Peucker-Ehrenbrink et al. (1995)
Peucker-Ehrenbrink, B., Ravizza, G., Hofmann, A.W. (1995) The marine 187Os/188Os record of the past 80 million years. Earth and Planetary Science Letters 130, 155–167. https://doi.org/10.1016/0012-821X(95)00003-U
and Pegram and Turkian (1999)Pegram, W.J., Turekian, K.K. (1999) The osmium isotopic composition change of Cenozoic sea water as inferred from a deep-sea core corrected for meteoric contributions. Geochimica et Cosmochimica Acta 63, 4053–4058, https://doi.org/10.1016/S0016-7037(99)00308-7
is shown with grey shading. Published Os datasets are from Poirier and Hillaire-Marcel (2009Poirier, A., Hillaire-Marcel, C. (2009) Os-isotope insights in major environmental changes of the Arctic Ocean during the Cenozoic. Geophysical Research Letters 36, L11602, https://doi.org/10.1029/2009GL037422
, 2011Poirier, A., Hillaire-Marcel, C. (2011) Improved Os-isotope stratigraphy of the Arctic Ocean. Geophysical Research Letters 38, L14607, https://doi.org/10.1029/2011GL047953
) and Dickson et al. (2015Dickson, A.J., Cohen, A.S., Coe, A.L., Davies, M., Shcherbinina, E.A., Gavrilov, Y.O. (2015) Evidence for weathering and volcanism during the PETM from Arctic Ocean and Peri-Tethys osmium isotope records. Palaeogeography, Palaeoclimatology, Palaeoecology 438, 300–307, https://doi.org/10.1016/j.palaeo.2015.08.019
, 2021Dickson, A.J., Cohen, A.S., Davies, M. (2021) The osmium isotope signature of Phanerozoic Large Igneous Provinces. In: Ernst, R., Dickson, A.J., Bekker, A. (Eds) Large Igneous Provinces: a driver of global environmental and biotic changes. AGU Geophysical Monograph Series 255. https://doi.org/10.1002/9781119507444
). ETM 2: Eocene Thermal Maximum 2. PETM: Paleocene–Eocene Thermal Maximum. Pal: Paleocene.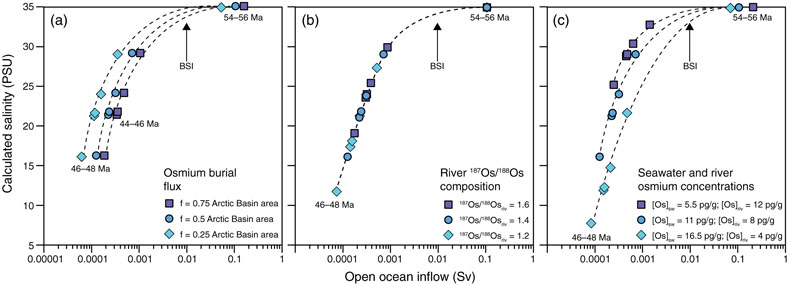
Figure 3 Calculated rates of open ocean seawater inflow to the Arctic Ocean, and Arctic Basin salinities. (a) Sensitivity tests of varying Os burial fluxes. (b) Sensitivity tests of varying pan-Arctic river compositions. (c) Sensitivity tests of varying the Os concentration in open ocean seawater and Arctic Rivers. BSI: modern Black Sea inflow of ∼0.0097 Sv from Özsoy and Ünlüata (1997)
Özsoy, E., Ünlüata, Ü (1997) Oceanography of the Black Sea: a review of some recent results. Earth-Science Reviews 42, 231–272, https://doi.org/10.1016/S0012-8252(97)81859-4
.