Dust transport enhanced land surface weatherability in a cooling world
Affiliations | Corresponding Author | Cite as | Funding information- Share this article


-
Article views:192Cumulative count of HTML views and PDF downloads.
- Download Citation
- Rights & Permissions
top
Abstract
Figures
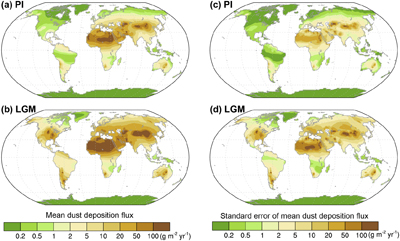 Figure 1 Mean land dust deposition fluxes (a, b) and their standard error (c, d) in experiments of preindustrial (PI) and Last Glacial Maximum (LGM) periods integrated from five climate model results (see Methods). | 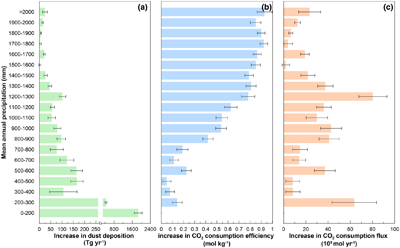 Figure 2 Increases in land dust deposition (a), efficiency (b) and flux (c) of atmospheric CO2 consumption by silicate weathering in the LGM compared with the PI categorised by mean annual precipitation (MAP). Note that increases in CO2 consumption efficiency (a measure of the amount of CO2 consumed by silicate weathering per kilogram rock) and flux in each zone with MAP >200 mm are estimated from the differences in CO2 consumption efficiency and flux between those zones and the arid region (MAP <200 mm). Error bars show one standard error of the mean. |
| Figure 1 | Figure 2 |
top
Introduction
Land surface weatherability is the susceptibility of the land surface to chemical weathering (e.g., Kump and Arthur, 1997
Kump, L.R., Arthur, M.A. (1997) Global Chemical Erosion during the Cenozoic: Weatherability Balances the Budgets. In: Ruddiman, W.F. (Ed.) Tectonic Uplift and Climate Change. Springer, Boston, 399–426. https://doi.org/10.1007/978-1-4615-5935-1_18
). Silicate weathering is a key negative feedback that regulates the long term global carbon cycle (e.g., Walker et al., 1981Walker, J.C.G., Hays, P.B., Kasting, J.F. (1981) A negative feedback mechanism for the long-term stabilization of Earth’s surface temperature. Journal of Geophysical Research: Oceans 86, 9776–9782. https://doi.org/10.1029/JC086iC10p09776
). Therefore, together with the amount of silicate rocks in the critical zone, the weatherability of those silicate rocks has acted as an important variable in silicate weathering and the associated atmospheric carbon dioxide consumption. Variation in land surface weatherability was proposed as the dominant mechanism regulating the long term evolution of atmospheric carbon dioxide levels in the Phanerozoic (e.g., Francois and Walker, 1992Francois, L.M., Walker, J.C.G. (1992) Modelling the Phanerozoic carbon cycle and climate: constraints from the 87Sr/86Sr isotopic ratio of seawater. American Journal of Science 292, 81–135. https://doi.org/10.2475/ajs.292.2.81
; Kump and Arthur, 1997Kump, L.R., Arthur, M.A. (1997) Global Chemical Erosion during the Cenozoic: Weatherability Balances the Budgets. In: Ruddiman, W.F. (Ed.) Tectonic Uplift and Climate Change. Springer, Boston, 399–426. https://doi.org/10.1007/978-1-4615-5935-1_18
; Caves et al., 2016Caves, J.K., Jost, A.B., Lau, K.V., Maher, K. (2016) Cenozoic carbon cycle imbalances and a variable weathering feedback. Earth and Planetary Science Letters 450, 152–163. https://doi.org/10.1016/j.epsl.2016.06.035
; Caves Rugenstein et al., 2019Caves Rugenstein, J.K., Ibarra, D.E., von Blanckenburg, F. (2019) Neogene cooling driven by land surface reactivity rather than increased weathering fluxes. Nature 571, 99–102. https://doi.org/10.1038/s41586-019-1332-y
). In particular, inverse modelling of marine proxies suggested that the Neogene cooling was driven by a rise in weatherability over time (Caves Rugenstein et al., 2019Caves Rugenstein, J.K., Ibarra, D.E., von Blanckenburg, F. (2019) Neogene cooling driven by land surface reactivity rather than increased weathering fluxes. Nature 571, 99–102. https://doi.org/10.1038/s41586-019-1332-y
), which may have been caused by the uplift of the Himalaya-Tibetan Plateau (e.g., Raymo et al., 1988Raymo, M.E., Ruddiman, W.F., Froelich, P.N. (1988) Influence of late Cenozoic mountain building on ocean geochemical cycles. Geology 16, 649–653. https://doi.org/10.1130/0091-7613(1988)016<0649:IOLCMB>2.3.CO;2
; Kump and Arthur, 1997Kump, L.R., Arthur, M.A. (1997) Global Chemical Erosion during the Cenozoic: Weatherability Balances the Budgets. In: Ruddiman, W.F. (Ed.) Tectonic Uplift and Climate Change. Springer, Boston, 399–426. https://doi.org/10.1007/978-1-4615-5935-1_18
) and in combination with the exposure of Mg-rich lithologies in East and Southeast Asia (Park et al., 2020Park, Y., Maffre, P., Goddéris, Y., Macdonald, F.A., Anttila, E.S.C., Swanson-Hysell, N.L. (2020) Emergence of the southeast Asian islands as a driver for Neogene cooling. Proceedings of the National Academy of Sciences 117, 25319–25326. https://doi.org/10.1073/pnas.2011033117
; Yang et al., 2021Yang, Y., Galy, A., Fang, X., France-Lanord, C., Wan, S., Yang, R., Zhang, J., Zhang, R., Yang, S., Miao, Y., Liu, Y., Ye, C. (2021) East Asian monsoon intensification promoted weathering of the magnesium-rich southern China upper crust and its global significance. Science China Earth Sciences 64, 1155–1170. https://doi.org/10.1007/s11430-020-9781-3
). Nevertheless, all of these studies suggest the dominant control of denudation of the continents on silicate weatherability. However, the temporal evolution of denudation fluxes during the late Cenozoic on the Himalaya-Tibetan Plateau and globe remains controversial (e.g., Métivier et al., 1999Métivier, F., Gaudemer, Y., Tapponnier, P., Klein, M. (1999) Mass accumulation rates in Asia during the Cenozoic. Geophysical Journal International 137, 280–318. https://doi.org/10.1046/j.1365-246X.1999.00802.x
; Clift, 2006Clift., P.D. (2006) Controls on the erosion of Cenozoic Asia and the flux of clastic sediment to the ocean. Earth and Planetary Science Letters 241, 571–580. https://doi.org/10.1016/j.epsl.2005.11.028
; Herman et al., 2013Herman, F., Seward, D., Valla, P.G., Carter, A., Kohn, B., Willett, S.D., Ehlers, T.A. (2013) Worldwide acceleration of mountain erosion under a cooling Climate. Nature 504, 423–426. https://doi.org/10.1038/nature12877
; Lenard et al., 2020Lenard, S.J.P., Lave, J., France-Lanord, C., Aumaitre, G., Bourlès, D.L., Keddadouche, K. (2020) Steady erosion rates in the Himalayas through late Cenozoic climatic changes. Nature Geoscience 13, 448–452. https://doi.org/10.1038/s41561-020-0585-2
).Reconstructing land surface weatherability is not easy because it has always been affected by different factors, e.g., tectonic activity, mountain building, surface lithology, glacier erosion, and vegetation cover (Francois and Walker, 1992
Francois, L.M., Walker, J.C.G. (1992) Modelling the Phanerozoic carbon cycle and climate: constraints from the 87Sr/86Sr isotopic ratio of seawater. American Journal of Science 292, 81–135. https://doi.org/10.2475/ajs.292.2.81
). Unlike those proposed influencing factors of weatherability, here we propose that aeolian dust plays a role in sustaining high land surface weatherability in a cooling world. Aeolian dust is transported from arid sources to less arid areas, which can increase global land surface weatherability in two ways. First, the transport of less altered fine grained material to a more humid environment leads to a net increase in land surface weatherability. Second, aeolian dust provides nutrients to the vegetation (Ridgwell, 2002Ridgwell, A.J. (2002) Dust in the Earth system: the biogeochemical linking of land, air and sea. Philosophical Transactions of the Royal Society A: Mathematical, Physical and Engineering Sciences 360, 2905–2924. https://doi.org/10.1098/rsta.2002.1096
), which further increases silicate weathering rates. To test this idea, here we quantify the increase in dust deposition fluxes to the less arid continental regions and the associated atmospheric CO2 consumption caused by silicate weathering between the preindustrial (PI) period and the Last Glacial Maximum (LGM), because global dust cycles in the two periods are only well constrained by palaeo-dust record and climate modelling.top
Results and Discussion
We conducted palaeoclimate simulations in our study (Figs. S-1 to S-3), where the preindustrial experiment (called PI-Exp) represents the warm condition of the last few kyr, and the LGM experiment (called LGM-Exp) corresponds to the cold condition ∼21 kyr ago. To reveal the uncertainty of modelling data, we also collected another four modelling results from previous studies (Supplementary Information). The mean dust deposition flux over land and standard error of all five data sets are illustrated in Figure 1. We also summed the PI and LGM dust deposition fluxes from each model based on the mean annual precipitation (MAP) ranges (Fig. S-4). All the modelling results showed enhanced LGM dust deposition in terms of flux and spatial extent compared to PI conditions (Figs. 1, S-4). Dust deposition is high in the arid region around deserts in Central and East Asia, North Africa and Australia. However, the simulations clearly show that dust has also been transported to regions where the climate is wetter (Figs. S-1 to S-4). For both PI and LGM simulations, the amount of dust transported to regions with MAP >400 mm and >200 mm accounts for ∼31 % and ∼47 % of the global dust deposition flux in both simulations, respectively, despite the expansion of the arid regions during the LGM. Global land dust deposition has increased in almost all MAP zones during the LGM (Fig. 2a). The global net increases in aeolian dust (LGM-Exp minus PI-Exp) are 1621 ± 99 Tg yr−1 and 1072 ± 69 Tg yr−1 for regions with MAP >200 mm and >400 mm, respectively.

Figure 1 Mean land dust deposition fluxes (a, b) and their standard error (c, d) in experiments of preindustrial (PI) and Last Glacial Maximum (LGM) periods integrated from five climate model results (see Methods).

Figure 2 Increases in land dust deposition (a), efficiency (b) and flux (c) of atmospheric CO2 consumption by silicate weathering in the LGM compared with the PI categorised by mean annual precipitation (MAP). Note that increases in CO2 consumption efficiency (a measure of the amount of CO2 consumed by silicate weathering per kilogram rock) and flux in each zone with MAP >200 mm are estimated from the differences in CO2 consumption efficiency and flux between those zones and the arid region (MAP <200 mm). Error bars show one standard error of the mean.
Dust promotes weatherability. The intensity of dust silicate weathering is strongly dependent on climatic conditions (e.g., Goddéris et al., 2010
Goddéris, Y., Williams, J.Z., Schott, J., Pollard, D., Brantley, S.L. (2010) Time evolution of the mineralogical composition of Mississippi Valley loess over the last 10 kyr: Climate and geochemical modeling. Geochimica et Cosmochimica Acta 74, 6357–6374. https://doi.org/10.1016/j.gca.2010.08.023
, 2013Goddéris, Y., Brantley, S.L., François, L.M., Schott, J., Pollard, D., Déqué, M., Dury, M. (2013) Rates of consumption of atmospheric CO2 through the weathering of loess during the next 100 yr of climate change. Biogeosciences 10, 135–148. https://doi.org/10.5194/bg-10-135-2013
). In arid regions, the scarcity of precipitation and vegetation limits the weathering of silicate minerals, as seen by a low degree of Na depletion in silicates (Fig. S-5). In particular, a silicate Na2O/Al2O3 ratio of 0.17 in arid regions with MAP <200 mm is slightly less than, but close to, that of 0.20 for unweathered upper continental crust (Figs. S-5, S-6). However, when the dust settles in more humid zones, silicates will be more prone to weathering, as seen by the much lower Na2O/Al2O3 ratio (Fig. S-7a). Such dust has even become the main provider of fresh silicates and nutrients to the biosphere in some extreme scenarios where the local supply of fresh rocks is insufficient. For example, on the Hawaiian basaltic bedrock, much of the soil inorganic element originates from China and central Asian deserts (e.g., Kurtz et al., 2001Kurtz, A.C., Derry, L.A., Chadwick, O.A. (2001) Accretion of Asian dust to Hawaiian soils: isotopic, elemental, and mineral mass balances. Geochimica et Cosmochimica Acta 65, 1971–1983. https://doi.org/10.1016/S0016-7037(01)00575-0
). In addition, the fining of dust during long distance transport produces material with a greater surface area that promotes weathering.Dust exerts important biogeochemical controls on the downwind terrestrial ecosystems of humid regions (Ridgwell, 2002
Ridgwell, A.J. (2002) Dust in the Earth system: the biogeochemical linking of land, air and sea. Philosophical Transactions of the Royal Society A: Mathematical, Physical and Engineering Sciences 360, 2905–2924. https://doi.org/10.1098/rsta.2002.1096
) because 1) its mineralogy and grain size strongly influence the water- and nutrient-holding properties of the soil, and 2) it is a source of nutrients for some ecosystems. For example, in Amazonia, the soils are already highly weathered and nutrient-depleted, and dust transported across the Atlantic supports the ecosystems (Swap et al., 1992Swap, R., Garstang, M., Greco, S., Talbot, R., Kållberg, P. (1992) Saharan dust in the Amazon Basin. Tellus B: Chemical and Physical Meteorology 44, 133–149. https://doi.org/10.3402/tellusb.v44i2.15434
). Some soils on the Hawaiian Islands suggest an analogous situation (Chadwick et al., 1999Chadwick, O.A., Derry, L.A., Vitousek, P.M., Huebert, B.J., Hedin, L.O. (1999) Changing sources of nutrients during four million years of ecosystem development. Nature 397, 491–497. https://doi.org/10.1038/17276
). Therefore, via the fertilisation of vegetation, dust settling in areas with such highly weathered soils facilitates the silicate weathering process.Weathering of aeolian dust is also pronounced in broad, less humid regions. Rainfall composition provides a valuable approach for addressing dust weathering kinetics. Rainfall compositions in less humid North China show high 87Sr/86Sr and low Ca/Sr ratios (Rao et al., 2017
Rao, W., Han, G., Tan, H., Jin, K., Wang, S., Chen, T. (2017) Chemical and Sr isotopic characteristics of rainwater on the Alxa Desert Plateau, North China: Implication for air quality and ion sources. Atmospheric Research 193, 163–172. https://doi.org/10.1016/j.atmosres.2017.04.007
), corresponding to fast dissolution of some silicates. Dust silicate weathering can also be found in Himalayas with heavy monsoon rainfall. The precipitation composition in Bangladesh and Nepal (Galy and France-Lanord, 1999Galy, A., France-Lanord, C. (1999) Weathering processes in the Ganges–Brahmaputra basin and the riverine alkalinity budget. Chemical Geology 159, 31–60. https://doi.org/10.1016/S0009-2541(99)00033-9
) can be well explained by the mixing of silicate with low Ca/Sr ratios and Himalayan carbonate and sea salts with high Ca/Sr ratios. This evidence suggests that part of the dust is rapidly weathered in the atmosphere or shortly after deposition, increasing the weatherability.In addition, dust weathering involves not only silicates but also carbonates (Goddéris et al., 2010
Goddéris, Y., Williams, J.Z., Schott, J., Pollard, D., Brantley, S.L. (2010) Time evolution of the mineralogical composition of Mississippi Valley loess over the last 10 kyr: Climate and geochemical modeling. Geochimica et Cosmochimica Acta 74, 6357–6374. https://doi.org/10.1016/j.gca.2010.08.023
). Due to abundant carbonate in dust and its rapid weathering rates in Mississippi loess, dolomite weathering can contribute to as high as 90 % CO2 consumption of overall dust weathering (Goddéris et al., 2010Goddéris, Y., Williams, J.Z., Schott, J., Pollard, D., Brantley, S.L. (2010) Time evolution of the mineralogical composition of Mississippi Valley loess over the last 10 kyr: Climate and geochemical modeling. Geochimica et Cosmochimica Acta 74, 6357–6374. https://doi.org/10.1016/j.gca.2010.08.023
, 2013Goddéris, Y., Brantley, S.L., François, L.M., Schott, J., Pollard, D., Déqué, M., Dury, M. (2013) Rates of consumption of atmospheric CO2 through the weathering of loess during the next 100 yr of climate change. Biogeosciences 10, 135–148. https://doi.org/10.5194/bg-10-135-2013
). Carbonate weathering can consume CO2 on time scales shorter than a million years, and dust transport thus enhances the overall continental weatherability through this short term CO2 consumption mechanism as well.Dust promotes atmospheric CO2 consumption by silicate weathering. Global continental weatherability has been elevated by dust transport to humid regions in multiple ways, but only atmospheric CO2 consumption by silicate weathering can be estimated because the biogeochemical impact of dust and climate modulated dust carbonate weathering rate are difficult to assess quantitatively. In the context of dust silicate weathering, with an increase in MAP, the degree of silicate weathering alternation has increased, as shown by the decreasing Na2O/Al2O3 ratio and the increasing long term atmospheric CO2 consumption efficiency (a measure of the amount of CO2 consumed by silicate weathering per kilogram rock) (Fig. S-7). We use the dust silicate weathering and the associated CO2 consumption efficiency in regions with MAP <200 mm as a base value to evaluate the increases in dust deposition flux and the associated atmospheric CO2 consumption in each climate zone with MAP >200 mm (Supplementary Information, Fig. 2). The additional long term atmospheric CO2 consumption flux by silicate weathering yielded 0.431 ± 0.030 Tmol yr−1 and 0.503 ± 0.037 Tmol yr−1 for regions with MAP >400 mm and MAP >200 mm during the LGM period, respectively. Such fluxes are significant and represent 15–19 % of modern day long term global continental silicate weathering (Gaillardet et al., 1999
Gaillardet, J., Dupré, B., Louvat, P., Allègre, C.J. (1999) Global silicate weathering and CO2 consumption rates deduced from the chemistry of large rivers. Chemical Geology 159, 3–30. https://doi.org/10.1016/S0009-2541(99)00031-5
). On the other hand, the cooling by 4.4–6.8 °C from PI to LGM conditions used in our modelling would at least lower modern day silicate weathering by 23 to 35 %, depending on the type of lithology and parametric laws used (West, 2012West, A.J. (2012) Thickness of the chemical weathering zone and implications for erosional and climatic drivers of weathering and for carbon-cycle feedbacks. Geology 40, 811–814. https://doi.org/10.1130/G33041.1
; Li et al., 2016Li, G., Hartmann, J., Derry, L.A., West, A.J., You, C.-F., Long, X., Zhan, T., Li, L., Li, G., Qiu, W., Li, T., Liu, L., Chen, Y., Ji, J., Zhao, L., Chen, J. (2016) Temperature dependence of basalt weathering. Earth and Planetary Science Letters 443, 59–69. https://doi.org/10.1016/j.epsl.2016.03.015
). Our calculation shows that the increase in weatherability related to enhanced dust production and transport under the LGM is likely to be as important as the effect of global temperature decrease on atmospheric CO2 consumption by silicate weathering, which may sustain less variable silicate weathering flux into the ocean at glacial-interglacial timescales (e.g., von Blanckenburg et al., 2015von Blanckenburg, F., Bouchez, J., Ibarra, D.E., Maher, K. (2015) Stable runoff and weathering fluxes into the oceans over Quaternary climate cycles. Nature Geoscience 8, 538–542. https://doi.org/10.1038/ngeo2452
).top
Implications
Our study suggests that a dustier world in glacial periods comes with higher land surface weatherability during the late Neogene cooling, where higher land surface weatherability caused by aeolian dust can have an enhanced ability to buffer the carbon cycle fluctuation. A dusty world may have appeared in the Neogene, because modern major global dust source areas, e.g., North Africa and the broad Asian arid region, were formed during the Neogene (Guo et al., 2002
Guo, Z.T., Ruddiman, W.F., Hao, Q.Z., Wu, H.B., Qiao, Y.S., Zhu, R.X., Peng, S.Z., Wei, J.J., Yuan, B.Y., Liu, T.S. (2002) Onset of Asian desertification by 22 Myr ago inferred from loess deposits in China. Nature 416, 159–163. https://doi.org/10.1038/416159a
; Zhang et al., 2014Zhang, Z., Ramstein, G., Schuster, M., Li, C., Contoux, C., Yan, Q. (2014) Aridification of the Sahara desert caused by Tethys Sea shrinkage during the Late Miocene. Nature 513, 401–404. https://doi.org/10.1038/nature13705
). Pre-Quaternary global dust deposition is difficult to constrain due to a paucity of robust boundary conditions (e.g., vegetation) and palaeo-dust reconstructions. The global dust emission of the mid-Pliocene (3.3–3.0 Ma, a warm period prior to Quaternary glacial cycles) was only half or even less of that in the PI period (Shi et al., 2011Shi, Z., Liu, X., An, Z., Yi, B., Yang, P., Mahowald, N. (2011) Simulated variations of eolian dust from inner Asian deserts at the mid-Pliocene, last glacial maximum, and present day: contributions from the regional tectonic uplift and global climate change. Climate Dynamics, 37, 2289–2301. https://doi.org/10.1007/s00382-011-1078-1
; Sagoo and Storelvmo, 2017Sagoo, N., Storelvmo, T. (2017) Testing the sensitivity of past climates to the indirect effects of dust. Geophysical Research Letters 44, 5807–5817. https://doi.org/10.1002/2017GL072584
), which may suggest less dust deposition in warming periods during the late Neogene on timescales of millions of years. This aeolian dust-driven high degree of weatherability in a cooling world may provide an independent explanation for the overall low levels of atmospheric CO2 in the Neogene and similar cooling stages during the deep past, but it requires to be further examined by more robust palaeo-dust reconstruction and modelling.top
Acknowledgements
This study was supported by the National Key Research and Development Program of China (2022YFF0800502), the Second Tibetan Plateau Scientific Expedition and Research (2019QZKK0707), and the National Natural Science Foundation of China (42171010, 42002129). AG was supported by ANR GI-NOAH (ANR-19-CE01-0014), and FL acknowledges support from projects ANID FONDECYT 1191223 and FONDAP 1522A0001. Yonggang Liu is thanked for dust modelling assistance. Two anonymous reviewers are thanked for their helpful comments.
Editor: Gavin Foster
top
References
Caves, J.K., Jost, A.B., Lau, K.V., Maher, K. (2016) Cenozoic carbon cycle imbalances and a variable weathering feedback. Earth and Planetary Science Letters 450, 152–163. https://doi.org/10.1016/j.epsl.2016.06.035
 Show in context
 Variation in land surface weatherability was proposed as the dominant mechanism regulating the long term evolution of atmospheric carbon dioxide levels in the Phanerozoic (e.g., Francois and Walker, 1992; Kump and Arthur, 1997; Caves et al., 2016; Caves Rugenstein et al., 2019).
View in article
Caves Rugenstein, J.K., Ibarra, D.E., von Blanckenburg, F. (2019) Neogene cooling driven by land surface reactivity rather than increased weathering fluxes. Nature 571, 99–102. https://doi.org/10.1038/s41586-019-1332-y
 Show in context
 Variation in land surface weatherability was proposed as the dominant mechanism regulating the long term evolution of atmospheric carbon dioxide levels in the Phanerozoic (e.g., Francois and Walker, 1992; Kump and Arthur, 1997; Caves et al., 2016; Caves Rugenstein et al., 2019).
View in article
In particular, inverse modelling of marine proxies suggested that the Neogene cooling was driven by a rise in weatherability over time (Caves Rugenstein et al., 2019), which may have been caused by the uplift of the Himalaya-Tibetan Plateau (e.g., Raymo et al., 1988; Kump and Arthur, 1997) and in combination with the exposure of Mg-rich lithologies in East and Southeast Asia (Park et al., 2020; Yang et al., 2021).
View in article
Chadwick, O.A., Derry, L.A., Vitousek, P.M., Huebert, B.J., Hedin, L.O. (1999) Changing sources of nutrients during four million years of ecosystem development. Nature 397, 491–497. https://doi.org/10.1038/17276
 Show in context
 For example, in Amazonia, the soils are already highly weathered and nutrient-depleted, and dust transported across the Atlantic supports the ecosystems (Swap et al., 1992). Some soils on the Hawaiian Islands suggest an analogous situation (Chadwick et al., 1999).
View in article
Clift., P.D. (2006) Controls on the erosion of Cenozoic Asia and the flux of clastic sediment to the ocean. Earth and Planetary Science Letters 241, 571–580. https://doi.org/10.1016/j.epsl.2005.11.028
 Show in context
 However, the temporal evolution of denudation fluxes during the late Cenozoic on the Himalaya-Tibetan Plateau and globe remains controversial (e.g., Métivier et al., 1999; Clift, 2006; Herman et al., 2013; Lenard et al., 2020).
View in article
Francois, L.M., Walker, J.C.G. (1992) Modelling the Phanerozoic carbon cycle and climate: constraints from the 87Sr/86Sr isotopic ratio of seawater. American Journal of Science 292, 81–135. https://doi.org/10.2475/ajs.292.2.81
 Show in context
 Variation in land surface weatherability was proposed as the dominant mechanism regulating the long term evolution of atmospheric carbon dioxide levels in the Phanerozoic (e.g., Francois and Walker, 1992; Kump and Arthur, 1997; Caves et al., 2016; Caves Rugenstein et al., 2019).
View in article
Reconstructing land surface weatherability is not easy because it has always been affected by different factors, e.g., tectonic activity, mountain building, surface lithology, glacier erosion, and vegetation cover (Francois and Walker, 1992).
View in article
Gaillardet, J., Dupré, B., Louvat, P., Allègre, C.J. (1999) Global silicate weathering and CO2 consumption rates deduced from the chemistry of large rivers. Chemical Geology 159, 3–30. https://doi.org/10.1016/S0009-2541(99)00031-5
 Show in context
 Such fluxes are significant and represent 15–19 % of modern day long term global continental silicate weathering (Gaillardet et al., 1999).
View in article
Galy, A., France-Lanord, C. (1999) Weathering processes in the Ganges–Brahmaputra basin and the riverine alkalinity budget. Chemical Geology 159, 31–60. https://doi.org/10.1016/S0009-2541(99)00033-9
 Show in context
 The precipitation composition in Bangladesh and Nepal (Galy and France-Lanord, 1999) can be well explained by the mixing of silicate with low Ca/Sr ratios and Himalayan carbonate and sea salts with high Ca/Sr ratios.
View in article
Goddéris, Y., Williams, J.Z., Schott, J., Pollard, D., Brantley, S.L. (2010) Time evolution of the mineralogical composition of Mississippi Valley loess over the last 10 kyr: Climate and geochemical modeling. Geochimica et Cosmochimica Acta 74, 6357–6374. https://doi.org/10.1016/j.gca.2010.08.023
 Show in context
 The intensity of dust silicate weathering is strongly dependent on climatic conditions (e.g., Goddéris et al., 2010, 2013).
View in article
In addition, dust weathering involves not only silicates but also carbonates (Goddéris et al., 2010).
View in article
Due to abundant carbonate in dust and its rapid weathering rates in Mississippi loess, dolomite weathering can contribute to as high as 90 % CO2 consumption of overall dust weathering (Goddéris et al., 2010, 2013).
View in article
Goddéris, Y., Brantley, S.L., François, L.M., Schott, J., Pollard, D., Déqué, M., Dury, M. (2013) Rates of consumption of atmospheric CO2 through the weathering of loess during the next 100 yr of climate change. Biogeosciences 10, 135–148. https://doi.org/10.5194/bg-10-135-2013
 Show in context
 The intensity of dust silicate weathering is strongly dependent on climatic conditions (e.g., Goddéris et al., 2010, 2013).
View in article
Due to abundant carbonate in dust and its rapid weathering rates in Mississippi loess, dolomite weathering can contribute to as high as 90 % CO2 consumption of overall dust weathering (Goddéris et al., 2010, 2013).
View in article
Guo, Z.T., Ruddiman, W.F., Hao, Q.Z., Wu, H.B., Qiao, Y.S., Zhu, R.X., Peng, S.Z., Wei, J.J., Yuan, B.Y., Liu, T.S. (2002) Onset of Asian desertification by 22 Myr ago inferred from loess deposits in China. Nature 416, 159–163. https://doi.org/10.1038/416159a
 Show in context
 A dusty world may have appeared in the Neogene, because modern major global dust source areas, e.g., North Africa and the broad Asian arid region, were formed during the Neogene (Guo et al., 2002; Zhang et al., 2014).
View in article
Herman, F., Seward, D., Valla, P.G., Carter, A., Kohn, B., Willett, S.D., Ehlers, T.A. (2013) Worldwide acceleration of mountain erosion under a cooling Climate. Nature 504, 423–426. https://doi.org/10.1038/nature12877
 Show in context
 However, the temporal evolution of denudation fluxes during the late Cenozoic on the Himalaya-Tibetan Plateau and globe remains controversial (e.g., Métivier et al., 1999; Clift, 2006; Herman et al., 2013; Lenard et al., 2020).
View in article
Kump, L.R., Arthur, M.A. (1997) Global Chemical Erosion during the Cenozoic: Weatherability Balances the Budgets. In: Ruddiman, W.F. (Ed.) Tectonic Uplift and Climate Change. Springer, Boston, 399–426. https://doi.org/10.1007/978-1-4615-5935-1_18
 Show in context
 Land surface weatherability is the susceptibility of the land surface to chemical weathering (e.g., Kump and Arthur, 1997). Silicate weathering is a key negative feedback that regulates the long term global carbon cycle (e.g., Walker et al., 1981).
View in article
Variation in land surface weatherability was proposed as the dominant mechanism regulating the long term evolution of atmospheric carbon dioxide levels in the Phanerozoic (e.g., Francois and Walker, 1992; Kump and Arthur, 1997; Caves et al., 2016; Caves Rugenstein et al., 2019).
View in article
In particular, inverse modelling of marine proxies suggested that the Neogene cooling was driven by a rise in weatherability over time (Caves Rugenstein et al., 2019), which may have been caused by the uplift of the Himalaya-Tibetan Plateau (e.g., Raymo et al., 1988; Kump and Arthur, 1997) and in combination with the exposure of Mg-rich lithologies in East and Southeast Asia (Park et al., 2020; Yang et al., 2021).
View in article
Kurtz, A.C., Derry, L.A., Chadwick, O.A. (2001) Accretion of Asian dust to Hawaiian soils: isotopic, elemental, and mineral mass balances. Geochimica et Cosmochimica Acta 65, 1971–1983. https://doi.org/10.1016/S0016-7037(01)00575-0
 Show in context
 For example, on the Hawaiian basaltic bedrock, much of the soil inorganic element originates from China and central Asian deserts (e.g., Kurtz et al., 2001).
View in article
Lenard, S.J.P., Lave, J., France-Lanord, C., Aumaitre, G., Bourlès, D.L., Keddadouche, K. (2020) Steady erosion rates in the Himalayas through late Cenozoic climatic changes. Nature Geoscience 13, 448–452. https://doi.org/10.1038/s41561-020-0585-2
 Show in context
 However, the temporal evolution of denudation fluxes during the late Cenozoic on the Himalaya-Tibetan Plateau and globe remains controversial (e.g., Métivier et al., 1999; Clift, 2006; Herman et al., 2013; Lenard et al., 2020).
View in article
Li, G., Hartmann, J., Derry, L.A., West, A.J., You, C.-F., Long, X., Zhan, T., Li, L., Li, G., Qiu, W., Li, T., Liu, L., Chen, Y., Ji, J., Zhao, L., Chen, J. (2016) Temperature dependence of basalt weathering. Earth and Planetary Science Letters 443, 59–69. https://doi.org/10.1016/j.epsl.2016.03.015
 Show in context
 On the other hand, the cooling by 4.4–6.8 °C from PI to LGM conditions used in our modelling would at least lower modern day silicate weathering by 23 to 35 %, depending on the type of lithology and parametric laws used (West, 2012; Li et al., 2016).
View in article
Métivier, F., Gaudemer, Y., Tapponnier, P., Klein, M. (1999) Mass accumulation rates in Asia during the Cenozoic. Geophysical Journal International 137, 280–318. https://doi.org/10.1046/j.1365-246X.1999.00802.x
 Show in context
 However, the temporal evolution of denudation fluxes during the late Cenozoic on the Himalaya-Tibetan Plateau and globe remains controversial (e.g., Métivier et al., 1999; Clift, 2006; Herman et al., 2013; Lenard et al., 2020).
View in article
Park, Y., Maffre, P., Goddéris, Y., Macdonald, F.A., Anttila, E.S.C., Swanson-Hysell, N.L. (2020) Emergence of the southeast Asian islands as a driver for Neogene cooling. Proceedings of the National Academy of Sciences 117, 25319–25326. https://doi.org/10.1073/pnas.2011033117
 Show in context
 In particular, inverse modelling of marine proxies suggested that the Neogene cooling was driven by a rise in weatherability over time (Caves Rugenstein et al., 2019), which may have been caused by the uplift of the Himalaya-Tibetan Plateau (e.g., Raymo et al., 1988; Kump and Arthur, 1997) and in combination with the exposure of Mg-rich lithologies in East and Southeast Asia (Park et al., 2020; Yang et al., 2021).
View in article
Rao, W., Han, G., Tan, H., Jin, K., Wang, S., Chen, T. (2017) Chemical and Sr isotopic characteristics of rainwater on the Alxa Desert Plateau, North China: Implication for air quality and ion sources. Atmospheric Research 193, 163–172. https://doi.org/10.1016/j.atmosres.2017.04.007
 Show in context
 Rainfall compositions in less humid North China show high 87Sr/86Sr and low Ca/Sr ratios (Rao et al., 2017), corresponding to fast dissolution of some silicates.
View in article
Raymo, M.E., Ruddiman, W.F., Froelich, P.N. (1988) Influence of late Cenozoic mountain building on ocean geochemical cycles. Geology 16, 649–653. https://doi.org/10.1130/0091-7613(1988)016<0649:IOLCMB>2.3.CO;2
 Show in context
 In particular, inverse modelling of marine proxies suggested that the Neogene cooling was driven by a rise in weatherability over time (Caves Rugenstein et al., 2019), which may have been caused by the uplift of the Himalaya-Tibetan Plateau (e.g., Raymo et al., 1988; Kump and Arthur, 1997) and in combination with the exposure of Mg-rich lithologies in East and Southeast Asia (Park et al., 2020; Yang et al., 2021).
View in article
Ridgwell, A.J. (2002) Dust in the Earth system: the biogeochemical linking of land, air and sea. Philosophical Transactions of the Royal Society A: Mathematical, Physical and Engineering Sciences 360, 2905–2924. https://doi.org/10.1098/rsta.2002.1096
 Show in context
 Second, aeolian dust provides nutrients to the vegetation (Ridgwell, 2002), which further increases silicate weathering rates.
View in article
Dust exerts important biogeochemical controls on the downwind terrestrial ecosystems of humid regions (Ridgwell, 2002) because 1) its mineralogy and grain size strongly influence the water- and nutrient-holding properties of the soil, and 2) it is a source of nutrients for some ecosystems.
View in article
Sagoo, N., Storelvmo, T. (2017) Testing the sensitivity of past climates to the indirect effects of dust. Geophysical Research Letters 44, 5807–5817. https://doi.org/10.1002/2017GL072584
 Show in context
 The global dust emission of the mid-Pliocene (3.3–3.0 Ma, a warm period prior to Quaternary glacial cycles) was only half or even less of that in the PI period (Shi et al., 2011; Sagoo and Storelvmo, 2017), which may suggest less dust deposition in warming periods during the late Neogene on timescales of millions of years.
View in article
Shi, Z., Liu, X., An, Z., Yi, B., Yang, P., Mahowald, N. (2011) Simulated variations of eolian dust from inner Asian deserts at the mid-Pliocene, last glacial maximum, and present day: contributions from the regional tectonic uplift and global climate change. Climate Dynamics, 37, 2289–2301. https://doi.org/10.1007/s00382-011-1078-1
 Show in context
 The global dust emission of the mid-Pliocene (3.3–3.0 Ma, a warm period prior to Quaternary glacial cycles) was only half or even less of that in the PI period (Shi et al., 2011; Sagoo and Storelvmo, 2017), which may suggest less dust deposition in warming periods during the late Neogene on timescales of millions of years.
View in article
Swap, R., Garstang, M., Greco, S., Talbot, R., Kållberg, P. (1992) Saharan dust in the Amazon Basin. Tellus B: Chemical and Physical Meteorology 44, 133–149. https://doi.org/10.3402/tellusb.v44i2.15434
 Show in context
 For example, in Amazonia, the soils are already highly weathered and nutrient-depleted, and dust transported across the Atlantic supports the ecosystems (Swap et al., 1992). Some soils on the Hawaiian Islands suggest an analogous situation (Chadwick et al., 1999).
View in article
von Blanckenburg, F., Bouchez, J., Ibarra, D.E., Maher, K. (2015) Stable runoff and weathering fluxes into the oceans over Quaternary climate cycles. Nature Geoscience 8, 538–542. https://doi.org/10.1038/ngeo2452
 Show in context
 Our calculation shows that the increase in weatherability related to enhanced dust production and transport under the LGM is likely to be as important as the effect of global temperature decrease on atmospheric CO2 consumption by silicate weathering, which may sustain less variable silicate weathering flux into the ocean at glacial-interglacial timescales (e.g., von Blanckenburg et al., 2015).
View in article
Walker, J.C.G., Hays, P.B., Kasting, J.F. (1981) A negative feedback mechanism for the long-term stabilization of Earth’s surface temperature. Journal of Geophysical Research: Oceans 86, 9776–9782. https://doi.org/10.1029/JC086iC10p09776
 Show in context
 Land surface weatherability is the susceptibility of the land surface to chemical weathering (e.g., Kump and Arthur, 1997). Silicate weathering is a key negative feedback that regulates the long term global carbon cycle (e.g., Walker et al., 1981).
View in article
West, A.J. (2012) Thickness of the chemical weathering zone and implications for erosional and climatic drivers of weathering and for carbon-cycle feedbacks. Geology 40, 811–814. https://doi.org/10.1130/G33041.1
 Show in context
 On the other hand, the cooling by 4.4–6.8 °C from PI to LGM conditions used in our modelling would at least lower modern day silicate weathering by 23 to 35 %, depending on the type of lithology and parametric laws used (West, 2012; Li et al., 2016).
View in article
Yang, Y., Galy, A., Fang, X., France-Lanord, C., Wan, S., Yang, R., Zhang, J., Zhang, R., Yang, S., Miao, Y., Liu, Y., Ye, C. (2021) East Asian monsoon intensification promoted weathering of the magnesium-rich southern China upper crust and its global significance. Science China Earth Sciences 64, 1155–1170. https://doi.org/10.1007/s11430-020-9781-3
 Show in context
 In particular, inverse modelling of marine proxies suggested that the Neogene cooling was driven by a rise in weatherability over time (Caves Rugenstein et al., 2019), which may have been caused by the uplift of the Himalaya-Tibetan Plateau (e.g., Raymo et al., 1988; Kump and Arthur, 1997) and in combination with the exposure of Mg-rich lithologies in East and Southeast Asia (Park et al., 2020; Yang et al., 2021).
View in article
Zhang, Z., Ramstein, G., Schuster, M., Li, C., Contoux, C., Yan, Q. (2014) Aridification of the Sahara desert caused by Tethys Sea shrinkage during the Late Miocene. Nature 513, 401–404. https://doi.org/10.1038/nature13705
 Show in context
 A dusty world may have appeared in the Neogene, because modern major global dust source areas, e.g., North Africa and the broad Asian arid region, were formed during the Neogene (Guo et al., 2002; Zhang et al., 2014).
View in article
top
Supplementary Information
The Supplementary Information includes:
Download the Supplementary Information (PDF)
Figures
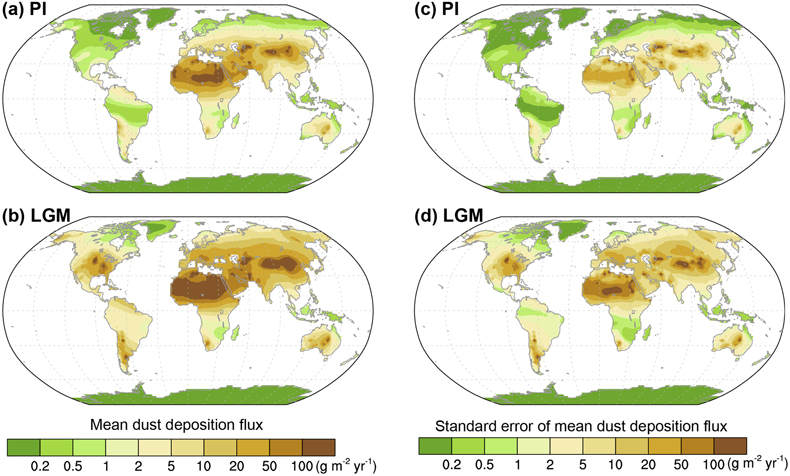
Figure 1 Mean land dust deposition fluxes (a, b) and their standard error (c, d) in experiments of preindustrial (PI) and Last Glacial Maximum (LGM) periods integrated from five climate model results (see Methods).
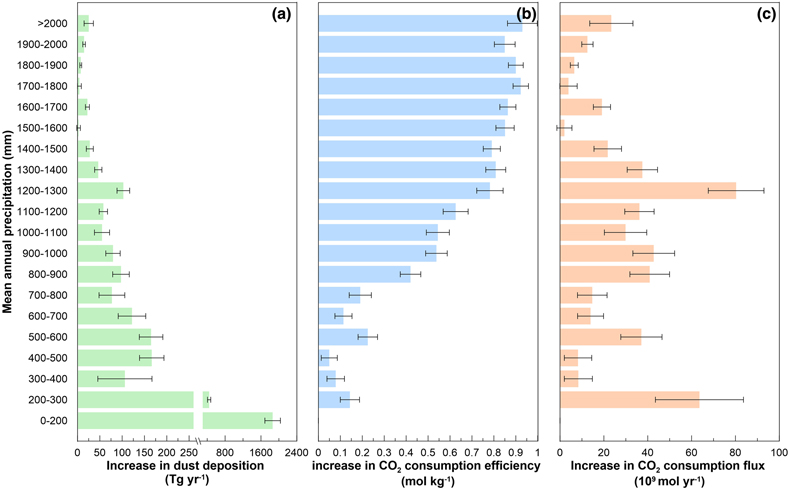
Figure 2 Increases in land dust deposition (a), efficiency (b) and flux (c) of atmospheric CO2 consumption by silicate weathering in the LGM compared with the PI categorised by mean annual precipitation (MAP). Note that increases in CO2 consumption efficiency (a measure of the amount of CO2 consumed by silicate weathering per kilogram rock) and flux in each zone with MAP >200 mm are estimated from the differences in CO2 consumption efficiency and flux between those zones and the arid region (MAP <200 mm). Error bars show one standard error of the mean.


