




Reliability of Raman analyses of CO2-rich fluid inclusions as a geobarometer at Kīlauea
Affiliations | Corresponding Author | Cite as | Funding information
Published by the European Association of Geochemistry
under Creative Commons License CC BY 4.0
Keywords: fluid inclusions, CO2, Raman spectroscopy, geobarometry, Kīlauea volcano


- Share this article


Article views:2,996Cumulative count of HTML views and PDF downloads.
- Download Citation
- Rights & Permissions

top
Abstract
Figures
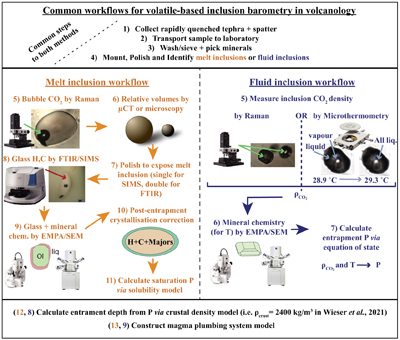 Figure 1 Melt inclusion and fluid inclusion workflows for magma storage depth measurements. Melt inclusion workflow steps are in orange text and fluid inclusion steps are in blue. | 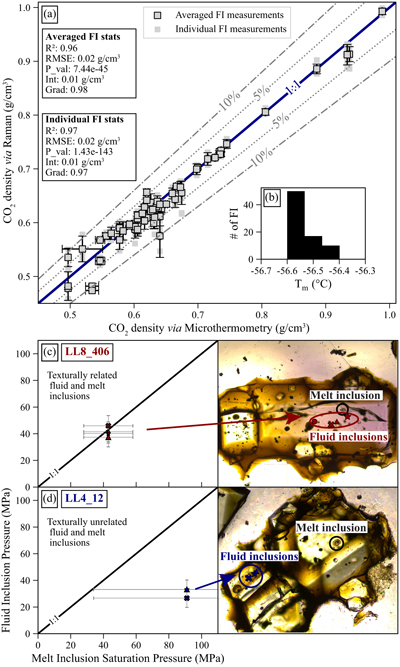 Figure 2 Comparison of Raman spectroscopy vs. Microthermometry, and of melt inclusion barometry vs. fluid inclusion barometry. (a, b) Density via Raman vs. density obtained from microthermometry. Outlined symbols represent averaged Raman measurement for each fluid inclusion and symbols without outlines are individual Raman measurements. Error bars show ±1σ of repeated measurements for Raman and microthermometry. (c) Crystal with clearly texturally related melt inclusions and fluid inclusions (LL8_406) showing overlapping pressures. (d) Crystal with texturally unrelated melt inclusions and fluid inclusions (LL4_12); fluid inclusions are found in a smaller olivine crystal in the same crystal cluster and return lower pressures. Specific crystal plots and images for every other pair identified are provided in the Supplementary Information Image Database for detailed comparisons. | 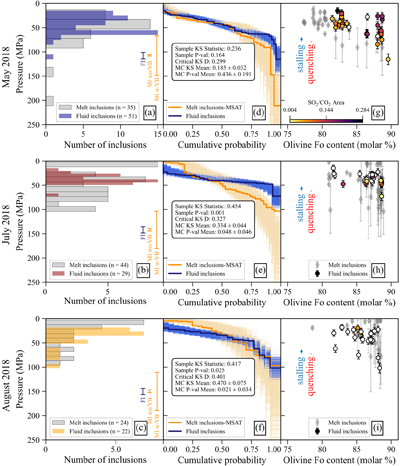 Figure 3 Comparing fluid inclusion and melt inclusion pressures for May, July and August 2018. (a–c) Histograms of pressures, with error bars indicate the average 1σ uncertainty for melt inclusions with vapour bubbles (MI w/VB) and without vapour bubbles (MI wo/VB), and the average 1σ fluid inclusion (FI) uncertainty. (d–f) Results of KS tests comparing fluid inclusion and melt inclusion pressure cumulative probability functions (CDF) from Monte Carlo simulations. For melt inclusions, the MagmaSat (Ghiorso and Gualda, 2015) results are shown (further details and five different solubility models in Supplementary Information). (g–i) Melt inclusion and fluid inclusion pressures vs. Fo content of the host olivine for (g) May 2018, (h) July 2018 and (i) August 2018. Fluid inclusions are coloured by SO2/CO2 peak area ratio. Blue and red arrows depict the maximum reduction in the internal pressure of a fluid inclusion trapped at the South Caldera reservoir induced by slow quenching (red in Fig. 4a, b) and 2 year stalling (blue in Fig. 4c, d). | 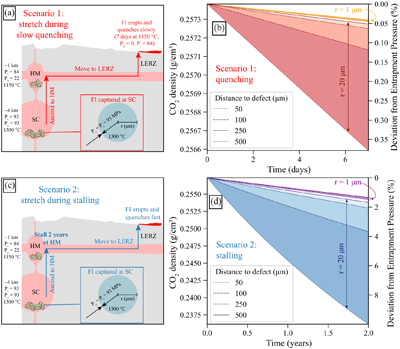 Figure 4 Assessing crystal cargoes and fluid inclusion re-equilibration. (a) Schematic diagram of Kīlauea plumbing system showing the scenario modelled in (b), where 1 and 20 μm radii fluid inclusions are captured in olivine crystals at the South Caldera (SC), they are transported to Halema‘uma‘u (HM) reservoir, almost immediately mobilised to the Lower East Rift Zone (LERZ), erupted, and slowly quenched for 7 days (T is kept at 1150 °C in the model). (b) Stretching model for slow quenching scenario in (a). (c) Diagram for the scenario modelled in (d), where the magma stalls at Halema‘uma‘u (HM) reservoir for 2 years prior to eruption. (d) Stretching model for stalling scenario in (c). |
| Figure 1 | Figure 2 | Figure 3 | Figure 4 |
top
Introduction
Understanding magma storage depth is crucial for interpreting volcanic signals, predicting eruptive changes and assessing the potential for volcanic unrest. This parameter is commonly determined using erupted materials and petrological tools like melt inclusion, mineral-mineral and mineral-melt barometry (Klügel et al., 2005
Klügel, A., Hansteen, T.H., Galipp, K. (2005) Magma storage and underplating beneath Cumbre Vieja volcano, La Palma (Canary Islands). Earth and Planetary Science Letters 236, 211–226. https://doi.org/10.1016/j.epsl.2005.04.006
; Putirka, 2008Putirka, K.D. (2008) Thermometers and Barometers for Volcanic Systems. Reviews in Mineralogy and Geochemistry 69, 61–120. https://doi.org/10.2138/rmg.2008.69.3
; Barker et al., 2021Barker, A.K., Rydeblad, E.M., Silva, S.M.D.M. (2021) Magma Storage at Ocean Islands: Insights From Cape Verde. In: Masotta, M., Beier, C., Mollo, S. (Eds.) Crustal Magmatic System Evolution: Anatomy, Architecture, and Physico‐Chemical Processes. American Geophysical Union and Wiley, Hoboken, NJ, 45–78. https://doi.org/10.1002/9781119564485.ch3
). However, many petrological tools present large uncertainties (i.e. ±8–19 km for clinopyroxene-based barometers; Wieser et al., 2023Wieser, P.E., Kent, A.J.R., Till, C.B., Donovan, J., Neave, D.A., Blatter, D.L., Krawczynski, M.J. (2023) Barometers Behaving Badly I: Assessing the Influence of Analytical and Experimental Uncertainty on Clinopyroxene Thermobarometry Calculations at Crustal Conditions. Journal of Petrology 64, egac126. https://doi.org/10.1093/petrology/egac126
) and require extensive sample preparation, making them unsuitable for real time monitoring. For example, melt inclusion work involves numerous time and resource consuming sample preparation, analytical and data processing steps (Fig. 1). Despite meticulous efforts, calculated pressures often come with significant analytical and systematic uncertainties (e.g., melt and bubble volume measurements, solubility models, post-entrapment crystallisation corrections) that can range from 20 % to 50 % when fully propagated (Tucker et al., 2019Tucker, J.M., Hauri, E.H., Pietruszka, A.J., Garcia, M.O., Marske, J.P., Trusdell, F.A. (2019) A high carbon content of the Hawaiian mantle from olivine-hosted melt inclusions. Geochimica et Cosmochimica Acta 254, 156–172. https://doi.org/10.1016/j.gca.2019.04.001
; Wieser et al., 2021Wieser, P.E., Lamadrid, H., Maclennan, J., Edmonds, M., Matthews, S., Iacovino, K., Jenner, F.E., Gansecki, C., Trusdell, F., Lee, R.L., Ilyinskaya, E. (2021) Reconstructing Magma Storage Depths for the 2018 Kīlauean Eruption From Melt Inclusion CO2 Contents: The Importance of Vapor Bubbles. Geochemistry, Geophysics, Geosystems 22, e2020GC009364. https://doi.org/10.1029/2020GC009364
; DeVitre et al., 2023DeVitre, C.L., Gazel, E., Ramalho, R.S., Venugopal, S., Steele-MacInnis, M., Hua, J., Allison, C.M., Moore, L.R., Carracedo, J.C., Monteleone, B. (2023) Oceanic intraplate explosive eruptions fed directly from the mantle. Proceedings of the National Academy of Sciences 120, e2302093120. https://doi.org/10.1073/pnas.2302093120
).Figure 1 Melt inclusion and fluid inclusion workflows for magma storage depth measurements. Melt inclusion workflow steps are in orange text and fluid inclusion steps are in blue.
CO2-dominated fluid inclusions, tiny droplets of exsolved fluids enclosed in growing crystals within a degassing melt (Roedder, 1979
Roedder, E. (1979) Origin and significance of magmatic inclusions. Bulletin de Minéralogie 102, 487–510. https://doi.org/10.3406/bulmi.1979.7299
), offer a compelling alternative to melt inclusions for deducing magma storage depths. At magmatic temperatures, the CO2 density in a melt’s exsolved fluid phase strongly depends on pressure, with little sensitivity to temperature (Dayton et al., 2023Dayton, K., Gazel, E., Wieser, P., Troll, V.R., Carracedo, J.C., La Madrid, H., Roman, D.C., Ward, J., Aulinas, M., Geiger, H., Deegan, F.M., Gisbert, G., Perez-Torrado, F.J. (2023) Deep magma storage during the 2021 La Palma eruption. Science Advances 9, eade7641. https://doi.org/10.1126/sciadv.ade7641
). Therefore, with a well constrained CO2 density within a fluid inclusion and a reasonable estimate of entrapment temperature, the entrapment pressure can be calculated using an equation of state (Fig. 1). Traditionally, CO2 density in fluid inclusions has been assessed using microthermometry, which involves observing phase changes during heating and cooling. this method has proven successful in CO2-dominated volcanic systems (<10 mol % H2O), particularly those with deep magma storage systems like the Canary Islands, Cabo Verde Islands, and the Azores (Klügel et al., 2005Klügel, A., Hansteen, T.H., Galipp, K. (2005) Magma storage and underplating beneath Cumbre Vieja volcano, La Palma (Canary Islands). Earth and Planetary Science Letters 236, 211–226. https://doi.org/10.1016/j.epsl.2005.04.006
, 2020Klügel, A., Day, S., Schmid, M., Faria, B. (2020) Magma Plumbing During the 2014–2015 Eruption of Fogo (Cape Verde Islands). Frontiers in Earth Science 8, 157. https://doi.org/10.3389/feart.2020.00157
; Zanon and Frezzotti, 2013Zanon, V., Frezzotti, M.L. (2013) Magma storage and ascent conditions beneath Pico and Faial islands (Azores archipelago): A study on fluid inclusions. Geochemistry, Geophysics, Geosystems 14, 3494–3514. https://doi.org/10.1002/ggge.20221
). However, it is difficult to measure fluid inclusions trapped in shallower volcanic systems (<∼6 km) by microthermometry, because the density of CO2 is below critical and the homogenisation of the liquid into the vapour phase is nearly impossible to observe optically (Hansteen and Klügel, 2008Hansteen, T.H., Klügel, A. (2008) Fluid Inclusion Thermobarometry as a Tracer for Magmatic Processes. Reviews in Mineralogy and Geochemistry 69, 143–177. https://doi.org/10.2138/rmg.2008.69.5
). Microthermometry also requires the use of specialised heating/cooling stages and the preparation of double polished crystal wafers (Fig. 1). The past decade of advances in the accuracy of Raman-based CO2 densimetry has opened new avenues for the technique (Lamadrid et al., 2017Lamadrid, H.M., Moore, L.R., Moncada, D., Rimstidt, J.D., Burruss, R.C., Bodnar, R.J. (2017) Reassessment of the Raman CO2 densimeter. Chemical Geology 450, 210–222. https://doi.org/10.1016/j.chemgeo.2016.12.034
; DeVitre et al., 2021DeVitre, C.L., Allison, C.M., Gazel, E. (2021) A high-precision CO2 densimeter for Raman spectroscopy using a Fluid Density Calibration Apparatus. Chemical Geology 584, 120522. https://doi.org/10.1016/j.chemgeo.2021.120522
). Specifically, Raman can measure the density of very small fluid inclusions (down to ∼1 μm) and/or those with low bulk CO2 densities (<0.45 g/cm3), impossible by microthermometry, with an accuracy of ∼0.02 g/cm3 (Yuan and Mayanovic, 2017Yuan, X., Mayanovic, R.A. (2017) An Empirical Study on Raman Peak Fitting and Its Application to Raman Quantitative Research. Applied Spectroscopy 71, 2325–2338. https://doi.org/10.1177/0003702817721527
). Raman requires only a single polish to ensure visibility of fluid inclusions within ∼50 μm of the surface, resulting in fewer preparation steps than microthermometry and melt inclusion work (Fig. 1). Because Raman is also commonly employed in fields like chemistry, biology, material science and physics, instrumentation is available at many research institutions. Recent studies suggest that fluid inclusions may have potential as a petrological monitoring tool, enabling relatively rapid constraints on magma storage depth (Dayton et al., 2023Dayton, K., Gazel, E., Wieser, P., Troll, V.R., Carracedo, J.C., La Madrid, H., Roman, D.C., Ward, J., Aulinas, M., Geiger, H., Deegan, F.M., Gisbert, G., Perez-Torrado, F.J. (2023) Deep magma storage during the 2021 La Palma eruption. Science Advances 9, eade7641. https://doi.org/10.1126/sciadv.ade7641
).However, fluid inclusions are prone to post-entrapment modifications, like stretching and decrepitation, and significant re-equilibration before eruption (e.g., Wanamaker and Evans, 1989
Wanamaker, B.J., Evans, B. (1989) Mechanical re-equilibration of fluid inclusions in San Carlos olivine by power-law creep. Contributions to Mineralogy and Petrology 102, 102–111. https://doi.org/10.1007/BF01160194
; Hansteen and Klügel, 2008Hansteen, T.H., Klügel, A. (2008) Fluid Inclusion Thermobarometry as a Tracer for Magmatic Processes. Reviews in Mineralogy and Geochemistry 69, 143–177. https://doi.org/10.2138/rmg.2008.69.5
). This rapid re-equilibration may cause fluid inclusions to reflect stalling levels rather than true capture depths (Hansteen and Klügel, 2008Hansteen, T.H., Klügel, A. (2008) Fluid Inclusion Thermobarometry as a Tracer for Magmatic Processes. Reviews in Mineralogy and Geochemistry 69, 143–177. https://doi.org/10.2138/rmg.2008.69.5
; Zanon and Frezzotti, 2013Zanon, V., Frezzotti, M.L. (2013) Magma storage and ascent conditions beneath Pico and Faial islands (Azores archipelago): A study on fluid inclusions. Geochemistry, Geophysics, Geosystems 14, 3494–3514. https://doi.org/10.1002/ggge.20221
), or even undergo reset during slow quenching (Klügel et al., 2020Klügel, A., Day, S., Schmid, M., Faria, B. (2020) Magma Plumbing During the 2014–2015 Eruption of Fogo (Cape Verde Islands). Frontiers in Earth Science 8, 157. https://doi.org/10.3389/feart.2020.00157
). As Raman-based fluid inclusion barometry gains popularity, a critical question arises: are the storage depths derived from CO2-dominated fluid inclusions consistent with melt inclusion barometry and other estimates of magma storage depths, or are they consistently reset by late stage processes during magma ascent?The 2018 Lower East Rift Zone (LERZ) eruption of Kīlauea volcano in Hawai‘i is an ideal test bed to assess fluid inclusion barometry, given that this volcano is extremely well monitored, and geophysical methods have revealed two main regions of magma storage (1–2 km and ∼3–5 km depth; Baker and Amelung, 2012
Baker, S., Amelung, F. (2012) Top-down inflation and deflation at the summit of Kīlauea Volcano, Hawai‘i observed with InSAR. Journal of Geophysical Research: Solid Earth 117, B12406. https://doi.org/10.1029/2011JB009123
; Anderson and Poland, 2016Anderson, K.R., Poland, M.P. (2016) Bayesian estimation of magma supply, storage, and eruption rates using a multiphysical volcano model: Kīlauea Volcano, 2000–2012. Earth and Planetary Science Letters 447, 161–171. https://doi.org/10.1016/j.epsl.2016.04.029
; Anderson et al., 2019Anderson, K.R., Johanson, I.A., Patrick, M.R., Gu, M., Segall, P., Poland, M.P., Montgomery-Brown, E.K., Miklius, A. (2019) Magma reservoir failure and the onset of caldera collapse at Kīlauea Volcano in 2018. Science 366, eaaz1822. https://doi.org/10.1126/science.aaz1822
). These geophysical estimates were corroborated by melt inclusion work on erupted 2018 samples (Lerner et al., 2021Lerner, A.H., Wallace, P.J., Shea, T., Mourey, A.J., Kelly, P.J., Nadeau, P.A., Elias, T., Kern, C., Clor, L.E., Gansecki, C., Lee, R.L., Moore, L.R., Werner, C.A. (2021) The petrologic and degassing behavior of sulfur and other magmatic volatiles from the 2018 eruption of Kīlauea, Hawai‘i: melt concentrations, magma storage depths, and magma recycling. Bulletin of Volcanology 83, 43. https://doi.org/10.1007/s00445-021-01459-y
; Wieser et al., 2021Wieser, P.E., Lamadrid, H., Maclennan, J., Edmonds, M., Matthews, S., Iacovino, K., Jenner, F.E., Gansecki, C., Trusdell, F., Lee, R.L., Ilyinskaya, E. (2021) Reconstructing Magma Storage Depths for the 2018 Kīlauean Eruption From Melt Inclusion CO2 Contents: The Importance of Vapor Bubbles. Geochemistry, Geophysics, Geosystems 22, e2020GC009364. https://doi.org/10.1029/2020GC009364
). However, it is notable that both melt inclusion studies were submitted ∼2 years after the eruption had ended, a testament of the considerable analytical effort required (Fig. 1), and thus the unsuitability of this method as a monitoring tool. Here, we assess whether magma storage depths determined using Raman analyses of CO2-dominated fluid inclusions would have yielded the same results. First, we evaluate the accuracy of the Raman method through a direct comparison with microthermometry to validate our approach to determine entrapment pressures. We compare pressures from 102 olivine-hosted fluid inclusions to those of melt inclusions from the exact same samples (or crystals when possible). Our results reveal that magma storage depths calculated from fluid inclusion and melt inclusion barometry are statistically indistinguishable. However, fluid inclusions exhibit significantly smaller uncertainties and require far fewer preparation and analytical steps (Fig. 1).top
Calibrated Raman Spectroscopy is a Suitable Alternative to Microthermometry
Despite its relative ease compared with microthermometry, and ability to assess a wider range of CO2 densities, many aspects of the Raman method have been recently criticised (e.g., peak fitting, instrument drift, instrument calibrations), with suggestions it is “150× less accurate than microthermometry” (Bakker, 2021
Bakker, R.J. (2021) The perfection of Raman spectroscopic gas densimeters. Journal of Raman Spectroscopy 52, 1923–1948. https://doi.org/10.1002/jrs.6245
). To assess whether Raman spectroscopy can reliably be used to measure the density of CO2-dominated fluid inclusions, we measured olivine-hosted fluid inclusions from Fogo volcano, Cabo Verde (DeVitre et al., 2023DeVitre, C.L., Gazel, E., Ramalho, R.S., Venugopal, S., Steele-MacInnis, M., Hua, J., Allison, C.M., Moore, L.R., Carracedo, J.C., Monteleone, B. (2023) Oceanic intraplate explosive eruptions fed directly from the mantle. Proceedings of the National Academy of Sciences 120, e2302093120. https://doi.org/10.1073/pnas.2302093120
) using both our calibrated Raman instrument and microthermometry (ρCO2 > ∼0.45 g/cm3; Figs. 2a, S-4). We measured the inclusions on the Raman while maintaining a constant temperature of 37 °C and at low laser power to mitigate potential effects of laser induced heating on measured fermi diad separation (Hagiwara et al., 2021Hagiwara, Y., Yoshida, K., Yoneda, A., Torimoto, J., Yamamoto, J. (2021) Experimental variable effects on laser heating of inclusions during Raman spectroscopic analysis. Chemical Geology 559, 119928. https://doi.org/10.1016/j.chemgeo.2020.119928
). Melting temperatures for all fluid inclusions analysed using microthermometry (11 crystals, ∼60 fluid inclusions) are −56.5 ± 0.1 °C (Fig. 2a) which precludes the significant presence of any gaseous species other than CO2 (confirmed via Raman Spectroscopy). Homogenisation temperatures obtained range from −11.1 ± 0.1 to +31.6 ± 1 °C (Fig. S-4b) and yield calculated bulk densities between 0.49 and 0.99 g/cm3 (Fig. 2a). Results of microthermometry and calibrated Raman spectroscopy are generally within 5 % of each other (Fig. 2a), and up to 10 % for inclusions with near critical CO2 densities (∼0.45 g/cm3), where microthermometry becomes extremely sensitive to the accuracy of the homogenisation temperature and the phase transition is difficult to constrain (Hansteen and Klügel, 2008Hansteen, T.H., Klügel, A. (2008) Fluid Inclusion Thermobarometry as a Tracer for Magmatic Processes. Reviews in Mineralogy and Geochemistry 69, 143–177. https://doi.org/10.2138/rmg.2008.69.5
). Regression statistics confirm good agreement between the two methods (Fig. 2a; R2 = 0.96, RMSE = 0.02 g/cm3, p = 7.44e−45). Overall, this comparison validates Raman spectroscopy measurements as a suitable alternative to microthermometric measurements (see also Kobayashi et al., 2012Kobayashi, T., Yamamoto, J., Hirajima, T., Ishibashi, H., Hirano, N., Lai, Y., Prikhod’ko, V.S., Arai, S. (2012) Conformity and precision of CO2 densimetry in CO2 inclusions: microthermometry versus Raman microspectroscopic densimetry. Journal of Raman Spectroscopy 43, 1126–1133. https://doi.org/10.1002/jrs.3134
).Figure 2 Comparison of Raman spectroscopy vs. Microthermometry, and of melt inclusion barometry vs. fluid inclusion barometry. (a, b) Density via Raman vs. density obtained from microthermometry. Outlined symbols represent averaged Raman measurement for each fluid inclusion and symbols without outlines are individual Raman measurements. Error bars show ±1σ of repeated measurements for Raman and microthermometry. (c) Crystal with clearly texturally related melt inclusions and fluid inclusions (LL8_406) showing overlapping pressures. (d) Crystal with texturally unrelated melt inclusions and fluid inclusions (LL4_12); fluid inclusions are found in a smaller olivine crystal in the same crystal cluster and return lower pressures. Specific crystal plots and images for every other pair identified are provided in the Supplementary Information Image Database for detailed comparisons.
top
Fluid and Melt Inclusion Pressures Yield a Consistent Petrogenetic Model
Having validated the Raman method for CO2 density measurements, we aim to assess whether fluid inclusion pressures are a viable alternative to the commonly used melt inclusion method. The most robust comparison involves examining pressures from melt and fluid inclusions within a single crystal. Accordingly, we analysed 36 CO2-dominated fluid inclusions in 17 crystals that also contained melt inclusions, as measured by Wieser et al. (2021
Wieser, P.E., Lamadrid, H., Maclennan, J., Edmonds, M., Matthews, S., Iacovino, K., Jenner, F.E., Gansecki, C., Trusdell, F., Lee, R.L., Ilyinskaya, E. (2021) Reconstructing Magma Storage Depths for the 2018 Kīlauean Eruption From Melt Inclusion CO2 Contents: The Importance of Vapor Bubbles. Geochemistry, Geophysics, Geosystems 22, e2020GC009364. https://doi.org/10.1029/2020GC009364
; Fig. 2). Petrographic analysis was conducted to categorise fluid inclusions based on their shapes, positions, and approximate textural relationship to the melt inclusions. We remove fluid inclusions with a significant melt film (>20 vol. %) and poor quality Raman analyses (see Supplementary Information). Overall, we find that fluid inclusions hosted in the same crystals, same inclusion assemblages or apparent growth zones record the same entrapment pressures as reconstructed melt inclusions within the uncertainty of the methods (Fig. 2b). In contrast, texturally unrelated fluid inclusions and melt inclusions (e.g., the fluid inclusion is present in the same crystal cluster but within a separate smaller crystal) tend to yield different pressures (Fig. 2d). If crystals were attached via synneusis (Wieser et al., 2019Wieser, P.E., Vukmanovic, Z., Kilian, R., Ringe, E., Holness, M.B., Maclennan, J., Edmonds, M. (2019) To sink, swim, twin, or nucleate: A critical appraisal of crystal aggregation processes. Geology 47, 948–952. https://doi.org/10.1130/G46660.1
; DiBenedetto et al., 2020DiBenedetto, M., Qin, Z., Suckale, J. (2020) Crystal aggregates record the pre-eruptive flow field in the volcanic conduit at Kīlauea, Hawaii. Science Advances 6, eabd4850. https://doi.org/10.1126/sciadv.abd4850
), it is very plausible that the smaller crystal grew in a different environment, explaining the lower fluid inclusion pressure (Fig. 2c). In general, it appears that if fluid inclusions are well documented and selected with care (i.e. fluid inclusions in crystal core growth zones), the estimates of pressure for fluid inclusions are consistent with those from melt inclusion work at Kīlauea.The large errors on melt inclusion pressures are notable during these comparisons and mainly result from uncertainty in the relative volume of the vapour bubble (orange ‘MI w/VB’ error bar in Fig. 3; Wieser et al., 2021
Wieser, P.E., Lamadrid, H., Maclennan, J., Edmonds, M., Matthews, S., Iacovino, K., Jenner, F.E., Gansecki, C., Trusdell, F., Lee, R.L., Ilyinskaya, E. (2021) Reconstructing Magma Storage Depths for the 2018 Kīlauean Eruption From Melt Inclusion CO2 Contents: The Importance of Vapor Bubbles. Geochemistry, Geophysics, Geosystems 22, e2020GC009364. https://doi.org/10.1029/2020GC009364
; Tucker et al., 2019Tucker, J.M., Hauri, E.H., Pietruszka, A.J., Garcia, M.O., Marske, J.P., Trusdell, F.A. (2019) A high carbon content of the Hawaiian mantle from olivine-hosted melt inclusions. Geochimica et Cosmochimica Acta 254, 156–172. https://doi.org/10.1016/j.gca.2019.04.001
). The uncertainties on CO2-dominated fluid inclusion pressures are much smaller as they are only a result of peak fitting, drift corrections, and uncertainty in the temperature of fluid trapping/re-equilibration (Wieser and DeVitre, 2023Wieser, P.E., DeVitre, C.L. (2023) DiadFit: An Open-Source Python3 Tool for Peak fitting of Raman Data from silicate melts and CO2 fluids. EarthArXiv Preprint v3. https://doi.org/10.31223/X5CQ1F
). These sources of uncertainty were propagated in DiadFit (Wieser and DeVitre, 2013Wieser, P.E., DeVitre, C.L. (2023) DiadFit: An Open-Source Python3 Tool for Peak fitting of Raman Data from silicate melts and CO2 fluids. EarthArXiv Preprint v3. https://doi.org/10.31223/X5CQ1F
) using Monte Carlo simulations considering 50 K uncertainty on the temperature (see Supplementary Information for details on temperature) and a 1σ uncertainty on density based on peak fit uncertainties of CO2 spectra as well as the uncertainty in the Ne correction model. We also correct pressures for the presence of H2O in the exsolved fluid using the mixed CO2-H2O EOS of Duan and Zhang (2006)Duan, Z., Zhang, Z. (2006) Equation of state of the H2O, CO2, and H2O–CO2 systems up to 10 GPa and 2573.15 K: Molecular dynamics simulations with ab initio potential surface. Geochimica et Cosmochimica Acta 70, 2311–2324. https://doi.org/10.1016/j.gca.2006.02.009
using XH2O values inferred from melt inclusion data at Kīlauea (Wieser et al., 2021Wieser, P.E., Lamadrid, H., Maclennan, J., Edmonds, M., Matthews, S., Iacovino, K., Jenner, F.E., Gansecki, C., Trusdell, F., Lee, R.L., Ilyinskaya, E. (2021) Reconstructing Magma Storage Depths for the 2018 Kīlauean Eruption From Melt Inclusion CO2 Contents: The Importance of Vapor Bubbles. Geochemistry, Geophysics, Geosystems 22, e2020GC009364. https://doi.org/10.1029/2020GC009364
), further propagating the additional uncertainty introduced by this correction step (see Section S-3 of the Supplementary Information).Figure 3 Comparing fluid inclusion and melt inclusion pressures for May, July and August 2018. (a–c) Histograms of pressures, with error bars indicate the average 1σ uncertainty for melt inclusions with vapour bubbles (MI w/VB) and without vapour bubbles (MI wo/VB), and the average 1σ fluid inclusion (FI) uncertainty. (d–f) Results of KS tests comparing fluid inclusion and melt inclusion pressure cumulative probability functions (CDF) from Monte Carlo simulations. For melt inclusions, the MagmaSat (Ghiorso and Gualda, 2015
Ghiorso, M.S., Gualda, G.A.R. (2015) An H2O–CO2 mixed fluid saturation model compatible with rhyolite-MELTS. Contributions to Mineralogy and Petrology 169, 53. https://doi.org/10.1007/s00410-015-1141-8
) results are shown (further details and five different solubility models in Supplementary Information). (g–i) Melt inclusion and fluid inclusion pressures vs. Fo content of the host olivine for (g) May 2018, (h) July 2018 and (i) August 2018. Fluid inclusions are coloured by SO2/CO2 peak area ratio. Blue and red arrows depict the maximum reduction in the internal pressure of a fluid inclusion trapped at the South Caldera reservoir induced by slow quenching (red in Fig. 4a, b) and 2 year stalling (blue in Fig. 4c, d).Due to the scarcity of fluid inclusions in the exact same crystal as melt inclusions, direct comparisons are limited. To complement our dataset, we also analysed an additional 109 fluid inclusions in olivine crystals picked directly from the same sample split as the melt inclusions. After filtering those with >20 % melt film and poor quality spectra, we report a total of 102 fluid inclusions and compare them with 103 melt inclusions from Wieser et al. (2021)
Wieser, P.E., Lamadrid, H., Maclennan, J., Edmonds, M., Matthews, S., Iacovino, K., Jenner, F.E., Gansecki, C., Trusdell, F., Lee, R.L., Ilyinskaya, E. (2021) Reconstructing Magma Storage Depths for the 2018 Kīlauean Eruption From Melt Inclusion CO2 Contents: The Importance of Vapor Bubbles. Geochemistry, Geophysics, Geosystems 22, e2020GC009364. https://doi.org/10.1029/2020GC009364
. When subdivided by sample (May, July, August 2018), histograms indicate good agreement between the pressures recorded by fluid inclusions and melt inclusions (Fig. 3a–c), particularly when considering the analytical uncertainty associated with melt inclusions measurements.We apply the Kolmogorov–Smirnov test (KS) to evaluate if observed visual differences are statistically significant. Sample KS tests reveal that melt and fluid inclusion pressures are not significantly different for May 2018 (p = 0.16) but suggest a possible significant difference for July and August 2018 (p = 0.001 and 0.03, respectively). However, these comparisons are constrained by the relatively small n for each sample (n < 50) and the comparatively large analytical errors on melt inclusion measurements. To address this limitation, we conduct a Monte Carlo simulation using Python3, re-sampling each melt and fluid inclusion measurement 1000 times within analytical uncertainty. KS tests on these re-sampled distributions indicate that the fluid and melt inclusion pressure distributions are not significantly different for any of the three events (p = 0.44 ± 0.20, 0.05 ± 0.05 and 0.02 ± 0.03 for May, July and August, respectively), with differences attributable to the uncertainty in melt inclusion measurements.
Until now, we focused on the analytical uncertainty tied to melt and fluid inclusion saturation pressures. However, reconstructed melt inclusion H2O and CO2 concentrations undergo conversion into pressures using a solubility model, introducing substantial systematic uncertainty (see Wieser et al., 2022
Wieser, P.E., Iacovino, K., Matthews, S., Moore, G., Allison, C.M. (2022) VESIcal: 2. A Critical Approach to Volatile Solubility Modeling Using an Open-Source Python3 Engine. Earth and Space Science 9, e2021EA001932. https://doi.org/10.1029/2021EA001932
). In Figure 3g–i, we present pressures calculated using the MagmaSat model (Ghiorso and Gualda, 2015Ghiorso, M.S., Gualda, G.A.R. (2015) An H2O–CO2 mixed fluid saturation model compatible with rhyolite-MELTS. Contributions to Mineralogy and Petrology 169, 53. https://doi.org/10.1007/s00410-015-1141-8
), deemed most suitably calibrated at Kīlauea by Wieser et al. (2021)Wieser, P.E., Lamadrid, H., Maclennan, J., Edmonds, M., Matthews, S., Iacovino, K., Jenner, F.E., Gansecki, C., Trusdell, F., Lee, R.L., Ilyinskaya, E. (2021) Reconstructing Magma Storage Depths for the 2018 Kīlauean Eruption From Melt Inclusion CO2 Contents: The Importance of Vapor Bubbles. Geochemistry, Geophysics, Geosystems 22, e2020GC009364. https://doi.org/10.1029/2020GC009364
. Yet, little consensus exists; for the same eruption, Lerner et al. (2021)Lerner, A.H., Wallace, P.J., Shea, T., Mourey, A.J., Kelly, P.J., Nadeau, P.A., Elias, T., Kern, C., Clor, L.E., Gansecki, C., Lee, R.L., Moore, L.R., Werner, C.A. (2021) The petrologic and degassing behavior of sulfur and other magmatic volatiles from the 2018 eruption of Kīlauea, Hawai‘i: melt concentrations, magma storage depths, and magma recycling. Bulletin of Volcanology 83, 43. https://doi.org/10.1007/s00445-021-01459-y
employed the solubility model of Iacono-Marziano et al. (2012)Iacono-Marziano, G., Morizet, Y., Le Trong, E., Gaillard, F. (2012) New experimental data and semi-empirical parameterization of H2O–CO2 solubility in mafic melts. Geochimica et Cosmochimica Acta 97, 1–23. https://doi.org/10.1016/j.gca.2012.08.035
. Cumulative melt inclusion pressures for five different solubility models indicate that the uncertainty linked to model choice can readily explain any slight differences between melt and fluid inclusion pressures (Fig. S-9). Another advantage of fluid inclusion barometry, compared to melt inclusion barometry, is that the choice of EOS does not significantly contribute to the uncertainty (Hansteen and Klügel, 2008Hansteen, T.H., Klügel, A. (2008) Fluid Inclusion Thermobarometry as a Tracer for Magmatic Processes. Reviews in Mineralogy and Geochemistry 69, 143–177. https://doi.org/10.2138/rmg.2008.69.5
).Slight differences between fluid and melt inclusion pressures may be attributed to sampling bias linked to the complex histories of the 2018 crystal cargo. Lerner et al. (2021)
Lerner, A.H., Wallace, P.J., Shea, T., Mourey, A.J., Kelly, P.J., Nadeau, P.A., Elias, T., Kern, C., Clor, L.E., Gansecki, C., Lee, R.L., Moore, L.R., Werner, C.A. (2021) The petrologic and degassing behavior of sulfur and other magmatic volatiles from the 2018 eruption of Kīlauea, Hawai‘i: melt concentrations, magma storage depths, and magma recycling. Bulletin of Volcanology 83, 43. https://doi.org/10.1007/s00445-021-01459-y
and Wieser et al. (2021)Wieser, P.E., Lamadrid, H., Maclennan, J., Edmonds, M., Matthews, S., Iacovino, K., Jenner, F.E., Gansecki, C., Trusdell, F., Lee, R.L., Ilyinskaya, E. (2021) Reconstructing Magma Storage Depths for the 2018 Kīlauean Eruption From Melt Inclusion CO2 Contents: The Importance of Vapor Bubbles. Geochemistry, Geophysics, Geosystems 22, e2020GC009364. https://doi.org/10.1029/2020GC009364
proposed that crystals originate from two storage reservoirs beneath Kīlauea’s summit based on the relationship between melt inclusion saturation pressures, entrapment depths, and olivine forsterite content (Fo = Mg2+/[Mg2+ + Fe2+], atomic). Specifically, Wieser et al. (2021)Wieser, P.E., Lamadrid, H., Maclennan, J., Edmonds, M., Matthews, S., Iacovino, K., Jenner, F.E., Gansecki, C., Trusdell, F., Lee, R.L., Ilyinskaya, E. (2021) Reconstructing Magma Storage Depths for the 2018 Kīlauean Eruption From Melt Inclusion CO2 Contents: The Importance of Vapor Bubbles. Geochemistry, Geophysics, Geosystems 22, e2020GC009364. https://doi.org/10.1029/2020GC009364
reported entrapment depths of 0.89–1.74 km for low Fo (<81.5 mol %) olivines in equilibrium with the carrier melt and ∼2–5 km for high Fo (>81.5 mol %) olivines, aligning with geophysical estimates for the two magma reservoirs at Kīlauea (Poland et al., 2014Poland, M.P., Miklius, A., Montgomery-Brown, E.K. (2014) Magma supply, storage, and transport at shield-stage Hawaiian volcanoes. In: Poland, M.P., Takahashi, T.J., Landowski, C.M. (Eds.) Characteristics of Hawaiian volcanoes, USGS Professional Paper 1801. US Geological Survey, Reston, VA, 179–234. https://doi.org/10.3133/pp18015
; Anderson et al., 2019Anderson, K.R., Johanson, I.A., Patrick, M.R., Gu, M., Segall, P., Poland, M.P., Montgomery-Brown, E.K., Miklius, A. (2019) Magma reservoir failure and the onset of caldera collapse at Kīlauea Volcano in 2018. Science 366, eaaz1822. https://doi.org/10.1126/science.aaz1822
). Fluid inclusion pressures support this correlation, with those trapped in lower Fo content olivine crystals tending to have lower entrapment pressures (Fig. 3g–i). This highlights that similar petrogenetic interpretations can be derived from both fluid and melt inclusions.top
Assessing Fluid Inclusion Re-equilibration
Although differences between melt inclusions and fluid inclusions are not statistically significant (Fig. 3d–f), some fluid inclusions indicate shallower pressures compared to melt inclusions for an equivalent olivine Fo content (i.e. , Fig. 3e,h). Unlike melt inclusions, which contend with significant systematic uncertainties related to solubility models (Fig. S-9), the primary source of uncertainty for CO2-dominated fluid inclusions is re-equilibration during prolonged storage and transport. To assess whether re-equilibration could explain the seemingly lower pressures recorded by fluid inclusions in July 2018, we constructed a Python3 implementation of the mechanical re-equilibration model of Wanamaker and Evans (1989)
Wanamaker, B.J., Evans, B. (1989) Mechanical re-equilibration of fluid inclusions in San Carlos olivine by power-law creep. Contributions to Mineralogy and Petrology 102, 102–111. https://doi.org/10.1007/BF01160194
based on olivine relaxation through dislocation creep (RelaxiFI; see Data Availability). We model the effect of fluid inclusion stretching on the internal pressure and CO2 density for fluid inclusions using the EOS of Span and Wagner (1996)Span, R., Wagner, W. (1996) A New Equation of State for Carbon Dioxide Covering the Fluid Region from the Triple‐Point Temperature to 1100 K at Pressures up to 800 MPa. Journal of Physical and Chemical Reference Data 25, 1509–1596. https://doi.org/10.1063/1.555991
. We consider fluid inclusions with a radius of 1 and 20 μm at variable distances (50–500 μm) from crystal defect structures (i.e. cracks, crystal edges and boundaries). It has also been suggested that fluid inclusions erupted in lava flows may re-equilibrate during post-eruptive cooling (Klügel et al., 2020Klügel, A., Day, S., Schmid, M., Faria, B. (2020) Magma Plumbing During the 2014–2015 Eruption of Fogo (Cape Verde Islands). Frontiers in Earth Science 8, 157. https://doi.org/10.3389/feart.2020.00157
). The May 2018 sample is a rapidly quenched reticulite, and the Aug 2018 sample was water quenched from the lava channel. In contrast, the July 2018 sample was an air cooled overflow from the channel. Based on observing the formation and quenching of other overflows, we predict that cooling occurred within hours. However, even allowing up to 7 days of re-equilibration results in less than 1 % difference (Fig. 4a,b), well within analytical uncertainty. Next, we consider a fluid inclusion which may have been trapped in the deeper South Caldera reservoir (∼4 km, 1300 °C) before being mobilised to the Halema‘uma‘u reservoir (∼1 km depth, 1150 °C), and stored for 0–2 years prior to eruption (based on diffusion timescales from Mourey et al., 2023Mourey, A.J., Shea, T., Costa, F., Shiro, B., Longman, R.J. (2023) Years of magma intrusion primed Kīlauea Volcano (Hawai‘i) for the 2018 eruption: evidence from olivine diffusion chronometry and monitoring data. Bulletin of Volcanology 85, 18. https://doi.org/10.1007/s00445-023-01633-4
; Fig. 4c,d). In the most extreme case (stretching of a 20 μm radius fluid inclusion found 50 μm from a crystal defect), stalling for 2 years causes a decrease in CO2 density of less than 10 %, also smaller than the average measurement uncertainty.Figure 4 Assessing crystal cargoes and fluid inclusion re-equilibration. (a) Schematic diagram of Kīlauea plumbing system showing the scenario modelled in (b), where 1 and 20 μm radii fluid inclusions are captured in olivine crystals at the South Caldera (SC), they are transported to Halema‘uma‘u (HM) reservoir, almost immediately mobilised to the Lower East Rift Zone (LERZ), erupted, and slowly quenched for 7 days (T is kept at 1150 °C in the model). (b) Stretching model for slow quenching scenario in (a). (c) Diagram for the scenario modelled in (d), where the magma stalls at Halema‘uma‘u (HM) reservoir for 2 years prior to eruption. (d) Stretching model for stalling scenario in (c).
Overall, our results indicate that in shallow systems such as that of Kīlauea where the internal pressure of the fluid inclusion is relatively low, stretching on timescales relevant to magma storage in upper storage reservoirs and syn-eruptive quenching is unlikely to play a major role and re-equilibration is of no significant concern.
top
Conclusions
In analysing the 2018 LERZ eruption of Kīlauea volcano, we compared magma storage depth estimates using CO2-dominated fluid inclusions to those obtained through melt inclusion studies. Our findings suggest that fluid inclusions at Kīlauea are minimally affected by re-equilibration within relevant timescales for magma storage and migration. They consistently reflect entrapment depths comparable to melt inclusions in the same samples. Consequently, fluid inclusions emerge as a reliable alternative to melt inclusions for barometry in shallow CO2-dominated volcanic systems.
top
Author Contributions
CLD prepared the Fogo fluid inclusions, performed all Raman and microthermometry analyses, developed the MC subsampling and fluid inclusion re-equilibration code, and wrote the manuscript. PEW acquired the funding, prepared the Kīlauea fluid inclusions, wrote the peak fitting/EOS code, and edited the manuscript.
top
Acknowledgements
PEW and CLD acknowledge support from NSF EAR 2217371 and the Berkeley Rose Hills Innovator Program. We thank Dale Burns at Stanford University for assistance with the EMPA measurements. We thank Ricardo S. Ramalho for collecting the Fogo volcano samples. This work was possible thanks to the fabulous samples collected by USGS field teams in 2018 and we are particularly grateful of Frank Trusdell’s help with lava sampling as part of the PlumeTeam 2018 aerosol campaign. We also thank two anonymous reviewers and the editor Raúl Fonseca for their constructive comments which helped improve this manuscript.
Editor: Raul O.C. Fonseca
top
Data Availability
All data are made available with the publication. All data are also available on Github (https://github.com/cljdevitre/KilaueaMIFI2023) along with notebooks to reproduce figures published in the article, the notebooks for running the MC KS test simulations and data processing notebooks. This repository is archived on Zenodo (https://zenodo.org/doi/10.5281/zenodo.10520936). Peak fitting and EOS calculations were performed in DiadFit (see https://github.com/PennyWieser/DiadFit, https://doi.org/10.31223/X5CQ1F). The python3 tool developed to assess re-equilibration of FI is available at https://github.com/cljdevitre/RelaxiFI.
top
References
Anderson, K.R., Poland, M.P. (2016) Bayesian estimation of magma supply, storage, and eruption rates using a multiphysical volcano model: Kīlauea Volcano, 2000–2012. Earth and Planetary Science Letters 447, 161–171. https://doi.org/10.1016/j.epsl.2016.04.029
 Show in context
The 2018 Lower East Rift Zone (LERZ) eruption of Kīlauea volcano in Hawai‘i is an ideal test bed to assess fluid inclusion barometry, given that this volcano is extremely well monitored, and geophysical methods have revealed two main regions of magma storage (1–2 km and ∼3–5 km depth; Baker and Amelung, 2012; Anderson and Poland, 2016; Anderson et al., 2019).
View in article
Anderson, K.R., Johanson, I.A., Patrick, M.R., Gu, M., Segall, P., Poland, M.P., Montgomery-Brown, E.K., Miklius, A. (2019) Magma reservoir failure and the onset of caldera collapse at Kīlauea Volcano in 2018. Science 366, eaaz1822. https://doi.org/10.1126/science.aaz1822
Show in contextThe 2018 Lower East Rift Zone (LERZ) eruption of Kīlauea volcano in Hawai‘i is an ideal test bed to assess fluid inclusion barometry, given that this volcano is extremely well monitored, and geophysical methods have revealed two main regions of magma storage (1–2 km and ∼3–5 km depth; Baker and Amelung, 2012; Anderson and Poland, 2016; Anderson et al., 2019).
View in article
Specifically, Wieser et al. (2021) reported entrapment depths of 0.89–1.74 km for low Fo (<81.5 mol %) olivines in equilibrium with the carrier melt and ∼2–5 km for high Fo (>81.5 mol %) olivines, aligning with geophysical estimates for the two magma reservoirs at Kīlauea (Poland et al., 2014; Anderson et al., 2019).
View in article
Baker, S., Amelung, F. (2012) Top-down inflation and deflation at the summit of Kīlauea Volcano, Hawai‘i observed with InSAR. Journal of Geophysical Research: Solid Earth 117, B12406. https://doi.org/10.1029/2011JB009123
Show in contextThe 2018 Lower East Rift Zone (LERZ) eruption of Kīlauea volcano in Hawai‘i is an ideal test bed to assess fluid inclusion barometry, given that this volcano is extremely well monitored, and geophysical methods have revealed two main regions of magma storage (1–2 km and ∼3–5 km depth; Baker and Amelung, 2012; Anderson and Poland, 2016; Anderson et al., 2019).
View in article
Bakker, R.J. (2021) The perfection of Raman spectroscopic gas densimeters. Journal of Raman Spectroscopy 52, 1923–1948. https://doi.org/10.1002/jrs.6245
Show in contextDespite its relative ease compared with microthermometry, and ability to assess a wider range of CO2 densities, many aspects of the Raman method have been recently criticised (e.g., peak fitting, instrument drift, instrument calibrations), with suggestions it is “150× less accurate than microthermometry” (Bakker, 2021).
View in article
Barker, A.K., Rydeblad, E.M., Silva, S.M.D.M. (2021) Magma Storage at Ocean Islands: Insights From Cape Verde. In: Masotta, M., Beier, C., Mollo, S. (Eds.) Crustal Magmatic System Evolution: Anatomy, Architecture, and Physico‐Chemical Processes. American Geophysical Union and Wiley, Hoboken, NJ, 45–78. https://doi.org/10.1002/9781119564485.ch3
Show in contextThis parameter is commonly determined using erupted materials and petrological tools like melt inclusion, mineral-mineral and mineral-melt barometry (Klügel et al., 2005; Putirka, 2008; Barker et al., 2021).
View in article
Dayton, K., Gazel, E., Wieser, P., Troll, V.R., Carracedo, J.C., La Madrid, H., Roman, D.C., Ward, J., Aulinas, M., Geiger, H., Deegan, F.M., Gisbert, G., Perez-Torrado, F.J. (2023) Deep magma storage during the 2021 La Palma eruption. Science Advances 9, eade7641. https://doi.org/10.1126/sciadv.ade7641
Show in contextAt magmatic temperatures, the CO2 density in a melt’s exsolved fluid phase strongly depends on pressure, with little sensitivity to temperature (Dayton et al., 2023).
View in article
Recent studies suggest that fluid inclusions may have potential as a petrological monitoring tool, enabling relatively rapid constraints on magma storage depth (Dayton et al., 2023).
View in article
DeVitre, C.L., Allison, C.M., Gazel, E. (2021) A high-precision CO2 densimeter for Raman spectroscopy using a Fluid Density Calibration Apparatus. Chemical Geology 584, 120522. https://doi.org/10.1016/j.chemgeo.2021.120522
Show in contextThe past decade of advances in the accuracy of Raman-based CO2 densimetry has opened new avenues for the technique (Lamadrid et al., 2017; DeVitre et al., 2021).
View in article
DeVitre, C.L., Gazel, E., Ramalho, R.S., Venugopal, S., Steele-MacInnis, M., Hua, J., Allison, C.M., Moore, L.R., Carracedo, J.C., Monteleone, B. (2023) Oceanic intraplate explosive eruptions fed directly from the mantle. Proceedings of the National Academy of Sciences 120, e2302093120. https://doi.org/10.1073/pnas.2302093120
Show in contextDespite meticulous efforts, calculated pressures often come with significant analytical and systematic uncertainties (e.g., melt and bubble volume measurements, solubility models, post-entrapment crystallisation corrections) that can range from 20 % to 50 % when fully propagated (Tucker et al., 2019; Wieser et al., 2021; DeVitre et al., 2023).
View in article
To assess whether Raman spectroscopy can reliably be used to measure the density of CO2-dominated fluid inclusions, we measured olivine-hosted fluid inclusions from Fogo volcano, Cabo Verde (DeVitre et al., 2023) using both our calibrated Raman instrument and microthermometry (ρCO2 > ∼0.45 g/cm3; Figs. 2a, S-4).
View in article
DiBenedetto, M., Qin, Z., Suckale, J. (2020) Crystal aggregates record the pre-eruptive flow field in the volcanic conduit at Kīlauea, Hawaii. Science Advances 6, eabd4850. https://doi.org/10.1126/sciadv.abd4850
Show in contextIf crystals were attached via synneusis (Wieser et al., 2019; DiBenedetto et al., 2020), it is very plausible that the smaller crystal grew in a different environment, explaining the lower fluid inclusion pressure (Fig. 2c).
View in article
Duan, Z., Zhang, Z. (2006) Equation of state of the H2O, CO2, and H2O–CO2 systems up to 10 GPa and 2573.15 K: Molecular dynamics simulations with ab initio potential surface. Geochimica et Cosmochimica Acta 70, 2311–2324. https://doi.org/10.1016/j.gca.2006.02.009
Show in contextWe also correct pressures for the presence of H2O in the exsolved fluid using the mixed CO2-H2O EOS of Duan and Zhang (2006) using XH2O values inferred from melt inclusion data at Kīlauea (Wieser et al., 2021), further propagating the additional uncertainty introduced by this correction step (see Section S-3 of the Supplementary Information).
View in article
Ghiorso, M.S., Gualda, G.A.R. (2015) An H2O–CO2 mixed fluid saturation model compatible with rhyolite-MELTS. Contributions to Mineralogy and Petrology 169, 53. https://doi.org/10.1007/s00410-015-1141-8
Show in contextFor melt inclusions, the MagmaSat (Ghiorso and Gualda, 2015) results are shown (further details and five different solubility models in Supplementary Information).
View in article
In Figure 3g–i, we present pressures calculated using the MagmaSat model (Ghiorso and Gualda, 2015), deemed most suitably calibrated at Kīlauea by Wieser et al. (2021).
View in article
Hagiwara, Y., Yoshida, K., Yoneda, A., Torimoto, J., Yamamoto, J. (2021) Experimental variable effects on laser heating of inclusions during Raman spectroscopic analysis. Chemical Geology 559, 119928. https://doi.org/10.1016/j.chemgeo.2020.119928
Show in contextWe measured the inclusions on the Raman while maintaining a constant temperature of 37 °C and at low laser power to mitigate potential effects of laser induced heating on measured fermi diad separation (Hagiwara et al., 2021).
View in article
Hansteen, T.H., Klügel, A. (2008) Fluid Inclusion Thermobarometry as a Tracer for Magmatic Processes. Reviews in Mineralogy and Geochemistry 69, 143–177. https://doi.org/10.2138/rmg.2008.69.5
Show in contextHowever, it is difficult to measure fluid inclusions trapped in shallower volcanic systems (<∼6 km) by microthermometry, because the density of CO2 is below critical and the homogenisation of the liquid into the vapour phase is nearly impossible to observe optically (Hansteen and Klügel, 2008).
View in article
However, fluid inclusions are prone to post-entrapment modifications, like stretching and decrepitation, and significant re-equilibration before eruption (e.g., Wanamaker and Evans, 1989; Hansteen and Klügel, 2008).
View in article
This rapid re-equilibration may cause fluid inclusions to reflect stalling levels rather than true capture depths (Hansteen and Klügel, 2008; Zanon and Frezzotti, 2013), or even undergo reset during slow quenching (Klügel et al., 2020).
View in article
Results of microthermometry and calibrated Raman spectroscopy are generally within 5 % of each other (Fig. 2a), and up to 10 % for inclusions with near critical CO2 densities (∼0.45 g/cm3), where microthermometry becomes extremely sensitive to the accuracy of the homogenisation temperature and the phase transition is difficult to constrain (Hansteen and Klügel, 2008).
View in article
Another advantage of fluid inclusion barometry, compared to melt inclusion barometry, is that the choice of EOS does not significantly contribute to the uncertainty (Hansteen and Klügel, 2008).
View in article
Iacono-Marziano, G., Morizet, Y., Le Trong, E., Gaillard, F. (2012) New experimental data and semi-empirical parameterization of H2O–CO2 solubility in mafic melts. Geochimica et Cosmochimica Acta 97, 1–23. https://doi.org/10.1016/j.gca.2012.08.035
Show in contextYet, little consensus exists; for the same eruption, Lerner et al. (2021) employed the solubility model of Iacono-Marziano et al. (2012).
View in article
Kobayashi, T., Yamamoto, J., Hirajima, T., Ishibashi, H., Hirano, N., Lai, Y., Prikhod’ko, V.S., Arai, S. (2012) Conformity and precision of CO2 densimetry in CO2 inclusions: microthermometry versus Raman microspectroscopic densimetry. Journal of Raman Spectroscopy 43, 1126–1133. https://doi.org/10.1002/jrs.3134
Show in contextRegression statistics confirm good agreement between the two methods (Fig. 2a; R2 = 0.96, RMSE = 0.02 g/cm3, p = 7.44e−45). Overall, this comparison validates Raman spectroscopy measurements as a suitable alternative to microthermometric measurements (see also Kobayashi et al., 2012).
View in article
Klügel, A., Hansteen, T.H., Galipp, K. (2005) Magma storage and underplating beneath Cumbre Vieja volcano, La Palma (Canary Islands). Earth and Planetary Science Letters 236, 211–226. https://doi.org/10.1016/j.epsl.2005.04.006
Show in contextThis parameter is commonly determined using erupted materials and petrological tools like melt inclusion, mineral-mineral and mineral-melt barometry (Klügel et al., 2005; Putirka, 2008; Barker et al., 2021).
View in article
this method has proven successful in CO2-dominated volcanic systems (<10 mol % H2O), particularly those with deep magma storage systems like the Canary Islands, Cabo Verde Islands, and the Azores (Klügel et al., 2005, 2020; Zanon and Frezzotti, 2013).
View in article
Klügel, A., Day, S., Schmid, M., Faria, B. (2020) Magma Plumbing During the 2014–2015 Eruption of Fogo (Cape Verde Islands). Frontiers in Earth Science 8, 157. https://doi.org/10.3389/feart.2020.00157
Show in contextthis method has proven successful in CO2-dominated volcanic systems (<10 mol % H2O), particularly those with deep magma storage systems like the Canary Islands, Cabo Verde Islands, and the Azores (Klügel et al., 2005, 2020; Zanon and Frezzotti, 2013).
View in article
This rapid re-equilibration may cause fluid inclusions to reflect stalling levels rather than true capture depths (Hansteen and Klügel, 2008; Zanon and Frezzotti, 2013), or even undergo reset during slow quenching (Klügel et al., 2020).
View in article
It has also been suggested that fluid inclusions erupted in lava flows may re-equilibrate during post-eruptive cooling (Klügel et al., 2020).
View in article
Lamadrid, H.M., Moore, L.R., Moncada, D., Rimstidt, J.D., Burruss, R.C., Bodnar, R.J. (2017) Reassessment of the Raman CO2 densimeter. Chemical Geology 450, 210–222. https://doi.org/10.1016/j.chemgeo.2016.12.034
Show in contextThe past decade of advances in the accuracy of Raman-based CO2 densimetry has opened new avenues for the technique (Lamadrid et al., 2017; DeVitre et al., 2021).
View in article
Lerner, A.H., Wallace, P.J., Shea, T., Mourey, A.J., Kelly, P.J., Nadeau, P.A., Elias, T., Kern, C., Clor, L.E., Gansecki, C., Lee, R.L., Moore, L.R., Werner, C.A. (2021) The petrologic and degassing behavior of sulfur and other magmatic volatiles from the 2018 eruption of Kīlauea, Hawai‘i: melt concentrations, magma storage depths, and magma recycling. Bulletin of Volcanology 83, 43. https://doi.org/10.1007/s00445-021-01459-y
Show in contextThese geophysical estimates were corroborated by melt inclusion work on erupted 2018 samples (Lerner et al., 2021; Wieser et al., 2021).
View in article
Yet, little consensus exists; for the same eruption, Lerner et al. (2021) employed the solubility model of Iacono-Marziano et al. (2012).
View in article
Lerner et al. (2021) and Wieser et al. (2021) proposed that crystals originate from two storage reservoirs beneath Kīlauea’s summit based on the relationship between melt inclusion saturation pressures, entrapment depths, and olivine forsterite content (Fo = Mg2+/[Mg2+ + Fe2+], atomic).
View in article
Mourey, A.J., Shea, T., Costa, F., Shiro, B., Longman, R.J. (2023) Years of magma intrusion primed Kīlauea Volcano (Hawai‘i) for the 2018 eruption: evidence from olivine diffusion chronometry and monitoring data. Bulletin of Volcanology 85, 18. https://doi.org/10.1007/s00445-023-01633-4
Show in contextNext, we consider a fluid inclusion which may have been trapped in the deeper South Caldera reservoir (∼4 km, 1300 °C) before being mobilised to the Halema‘uma‘u reservoir (∼1 km depth, 1150 °C), and stored for 0–2 years prior to eruption (based on diffusion timescales from Mourey et al., 2023; Fig. 4c,d).
View in article
Poland, M.P., Miklius, A., Montgomery-Brown, E.K. (2014) Magma supply, storage, and transport at shield-stage Hawaiian volcanoes. In: Poland, M.P., Takahashi, T.J., Landowski, C.M. (Eds.) Characteristics of Hawaiian volcanoes, USGS Professional Paper 1801. US Geological Survey, Reston, VA, 179–234. https://doi.org/10.3133/pp18015
Show in contextSpecifically, Wieser et al. (2021) reported entrapment depths of 0.89–1.74 km for low Fo (<81.5 mol %) olivines in equilibrium with the carrier melt and ∼2–5 km for high Fo (>81.5 mol %) olivines, aligning with geophysical estimates for the two magma reservoirs at Kīlauea (Poland et al., 2014; Anderson et al., 2019).
View in article
Putirka, K.D. (2008) Thermometers and Barometers for Volcanic Systems. Reviews in Mineralogy and Geochemistry 69, 61–120. https://doi.org/10.2138/rmg.2008.69.3
Show in contextThis parameter is commonly determined using erupted materials and petrological tools like melt inclusion, mineral-mineral and mineral-melt barometry (Klügel et al., 2005; Putirka, 2008; Barker et al., 2021).
View in article
Roedder, E. (1979) Origin and significance of magmatic inclusions. Bulletin de Minéralogie 102, 487–510. https://doi.org/10.3406/bulmi.1979.7299
Show in contextCO2-dominated fluid inclusions, tiny droplets of exsolved fluids enclosed in growing crystals within a degassing melt (Roedder, 1979), offer a compelling alternative to melt inclusions for deducing magma storage depths.
View in article
Span, R., Wagner, W. (1996) A New Equation of State for Carbon Dioxide Covering the Fluid Region from the Triple‐Point Temperature to 1100 K at Pressures up to 800 MPa. Journal of Physical and Chemical Reference Data 25, 1509–1596. https://doi.org/10.1063/1.555991
Show in contextWe model the effect of fluid inclusion stretching on the internal pressure and CO2 density for fluid inclusions using the EOS of Span and Wagner (1996).
View in article
Tucker, J.M., Hauri, E.H., Pietruszka, A.J., Garcia, M.O., Marske, J.P., Trusdell, F.A. (2019) A high carbon content of the Hawaiian mantle from olivine-hosted melt inclusions. Geochimica et Cosmochimica Acta 254, 156–172. https://doi.org/10.1016/j.gca.2019.04.001
Show in contextDespite meticulous efforts, calculated pressures often come with significant analytical and systematic uncertainties (e.g., melt and bubble volume measurements, solubility models, post-entrapment crystallisation corrections) that can range from 20 % to 50 % when fully propagated (Tucker et al., 2019; Wieser et al., 2021; DeVitre et al., 2023).
View in article
The large errors on melt inclusion pressures are notable during these comparisons and mainly result from uncertainty in the relative volume of the vapour bubble (orange ‘MI w/VB’ error bar in Fig. 3; Wieser et al., 2021; Tucker et al., 2019).
View in article
Wanamaker, B.J., Evans, B. (1989) Mechanical re-equilibration of fluid inclusions in San Carlos olivine by power-law creep. Contributions to Mineralogy and Petrology 102, 102–111. https://doi.org/10.1007/BF01160194
Show in contextHowever, fluid inclusions are prone to post-entrapment modifications, like stretching and decrepitation, and significant re-equilibration before eruption (e.g., Wanamaker and Evans, 1989; Hansteen and Klügel, 2008).
View in article
To assess whether re-equilibration could explain the seemingly lower pressures recorded by fluid inclusions in July 2018, we constructed a Python3 implementation of the mechanical re-equilibration model of Wanamaker and Evans (1989) based on olivine relaxation through dislocation creep (RelaxiFI; see Data Availability.
View in article
Wieser, P.E., DeVitre, C.L. (2023) DiadFit: An Open-Source Python3 Tool for Peak fitting of Raman Data from silicate melts and CO2 fluids. EarthArXiv Preprint v3. https://doi.org/10.31223/X5CQ1F
Show in contextThe uncertainties on CO2-dominated fluid inclusion pressures are much smaller as they are only a result of peak fitting, drift corrections, and uncertainty in the temperature of fluid trapping/re-equilibration (Wieser and DeVitre, 2023).
View in article
These sources of uncertainty were propagated in DiadFit (Wieser and DeVitre, 2013) using Monte Carlo simulations considering 50 K uncertainty on the temperature (see Supplementary Information for details on temperature) and a 1σ uncertainty on density based on peak fit uncertainties of CO2 spectra as well as the uncertainty in the Ne correction model.
View in article
Wieser, P.E., Vukmanovic, Z., Kilian, R., Ringe, E., Holness, M.B., Maclennan, J., Edmonds, M. (2019) To sink, swim, twin, or nucleate: A critical appraisal of crystal aggregation processes. Geology 47, 948–952. https://doi.org/10.1130/G46660.1
Show in contextIf crystals were attached via synneusis (Wieser et al., 2019; DiBenedetto et al., 2020), it is very plausible that the smaller crystal grew in a different environment, explaining the lower fluid inclusion pressure (Fig. 2c).
View in article
Wieser, P.E., Lamadrid, H., Maclennan, J., Edmonds, M., Matthews, S., Iacovino, K., Jenner, F.E., Gansecki, C., Trusdell, F., Lee, R.L., Ilyinskaya, E. (2021) Reconstructing Magma Storage Depths for the 2018 Kīlauean Eruption From Melt Inclusion CO2 Contents: The Importance of Vapor Bubbles. Geochemistry, Geophysics, Geosystems 22, e2020GC009364. https://doi.org/10.1029/2020GC009364
Show in contextDespite meticulous efforts, calculated pressures often come with significant analytical and systematic uncertainties (e.g., melt and bubble volume measurements, solubility models, post-entrapment crystallisation corrections) that can range from 20 % to 50 % when fully propagated (Tucker et al., 2019; Wieser et al., 2021; DeVitre et al., 2023).
View in article
These geophysical estimates were corroborated by melt inclusion work on erupted 2018 samples (Lerner et al., 2021; Wieser et al., 2021).
View in article
The most robust comparison involves examining pressures from melt and fluid inclusions within a single crystal. Accordingly, we analysed 36 CO2-dominated fluid inclusions in 17 crystals that also contained melt inclusions, as measured by Wieser et al. (2021; Fig. 2).
View in article
The large errors on melt inclusion pressures are notable during these comparisons and mainly result from uncertainty in the relative volume of the vapour bubble (orange ‘MI w/VB’ error bar in Fig. 3; Wieser et al., 2021; Tucker et al., 2019).
View in article
After filtering those with >20 % melt film and poor quality spectra, we report a total of 102 fluid inclusions and compare them with 103 melt inclusions from Wieser et al. (2021).
View in article
We also correct pressures for the presence of H2O in the exsolved fluid using the mixed CO2-H2O EOS of Duan and Zhang (2006) using XH2O values inferred from melt inclusion data at Kīlauea (Wieser et al., 2021), further propagating the additional uncertainty introduced by this correction step (see Section S-3 of the Supplementary Information).
View in article
In Figure 3g–i, we present pressures calculated using the MagmaSat model (Ghiorso and Gualda, 2015), deemed most suitably calibrated at Kīlauea by Wieser et al. (2021).
View in article
Specifically, Wieser et al. (2021) reported entrapment depths of 0.89–1.74 km for low Fo (<81.5 mol %) olivines in equilibrium with the carrier melt and ∼2–5 km for high Fo (>81.5 mol %) olivines, aligning with geophysical estimates for the two magma reservoirs at Kīlauea (Poland et al., 2014; Anderson et al., 2019).
View in article
Lerner et al. (2021) and Wieser et al. (2021) proposed that crystals originate from two storage reservoirs beneath Kīlauea’s summit based on the relationship between melt inclusion saturation pressures, entrapment depths, and olivine forsterite content (Fo = Mg2+/[Mg2+ + Fe2+], atomic).
View in article
Wieser, P.E., Iacovino, K., Matthews, S., Moore, G., Allison, C.M. (2022) VESIcal: 2. A Critical Approach to Volatile Solubility Modeling Using an Open-Source Python3 Engine. Earth and Space Science 9, e2021EA001932. https://doi.org/10.1029/2021EA001932
Show in contextUntil now, we focused on the analytical uncertainty tied to melt and fluid inclusion saturation pressures. However, reconstructed melt inclusion H2O and CO2 concentrations undergo conversion into pressures using a solubility model, introducing substantial systematic uncertainty (see Wieser et al., 2022).
View in article
Wieser, P.E., Kent, A.J.R., Till, C.B., Donovan, J., Neave, D.A., Blatter, D.L., Krawczynski, M.J. (2023) Barometers Behaving Badly I: Assessing the Influence of Analytical and Experimental Uncertainty on Clinopyroxene Thermobarometry Calculations at Crustal Conditions. Journal of Petrology 64, egac126. https://doi.org/10.1093/petrology/egac126
Show in contextHowever, many petrological tools present large uncertainties (i.e. ±8–19 km for clinopyroxene-based barometers; Wieser et al., 2023) and require extensive sample preparation, making them unsuitable for real time monitoring.
View in article
Yuan, X., Mayanovic, R.A. (2017) An Empirical Study on Raman Peak Fitting and Its Application to Raman Quantitative Research. Applied Spectroscopy 71, 2325–2338. https://doi.org/10.1177/0003702817721527
Show in contextSpecifically, Raman can measure the density of very small fluid inclusions (down to ∼1 μm) and/or those with low bulk CO2 densities (<0.45 g/cm3), impossible by microthermometry, with an accuracy of ∼0.02 g/cm3 (Yuan and Mayanovic, 2017).
View in article
Zanon, V., Frezzotti, M.L. (2013) Magma storage and ascent conditions beneath Pico and Faial islands (Azores archipelago): A study on fluid inclusions. Geochemistry, Geophysics, Geosystems 14, 3494–3514. https://doi.org/10.1002/ggge.20221
Show in contextThis rapid re-equilibration may cause fluid inclusions to reflect stalling levels rather than true capture depths (Hansteen and Klügel, 2008; Zanon and Frezzotti, 2013), or even undergo reset during slow quenching (Klügel et al., 2020).
View in article
this method has proven successful in CO2-dominated volcanic systems (<10 mol % H2O), particularly those with deep magma storage systems like the Canary Islands, Cabo Verde Islands, and the Azores (Klügel et al., 2005, 2020; Zanon and Frezzotti, 2013).
View in article
top
Supplementary Information
The Supplementary Information includes:
- Detailed Materials and Methods
- Statistical Significance of the MI vs. FI Recorded Pressures
- Fluid % Effect on Calculated Densities and Pressures
- Figures S-1 to S-13
- Tables S-1 to S-7
- Supplementary Image Database
- Supplementary Information References
All raw data, including spectra, fitting images and Jupyter Lab notebooks to process and plot data can be found on the Github repository https://github.com/cljdevitre/KilaueaMIFI2023, which is archived on Zenodo (https://zenodo.org/doi/10.5281/zenodo.10520936).
Download the Supplementary Information (PDF)
Download Tables S-1 to S-7 (xlsx)
Download Supplementary Image Database (PDF)
Figures
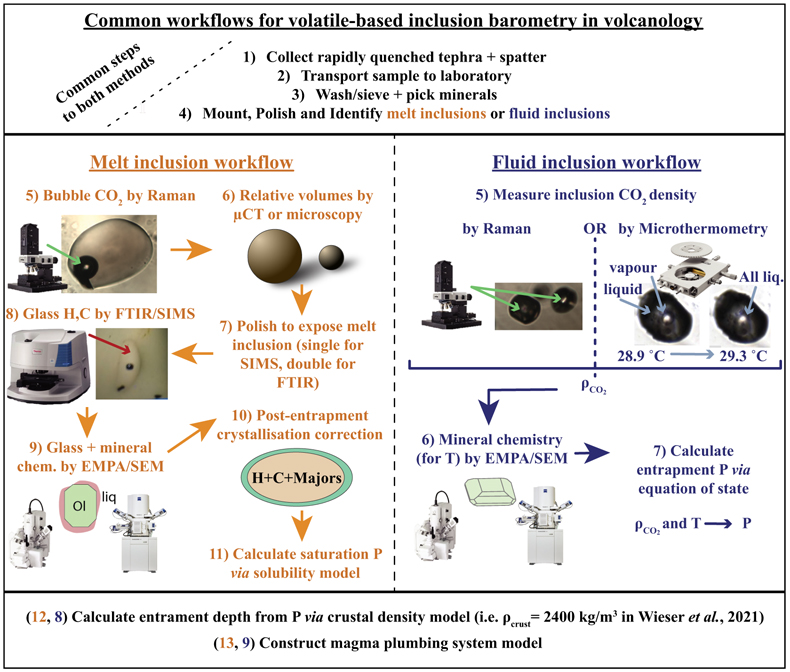
Figure 1 Melt inclusion and fluid inclusion workflows for magma storage depth measurements. Melt inclusion workflow steps are in orange text and fluid inclusion steps are in blue.
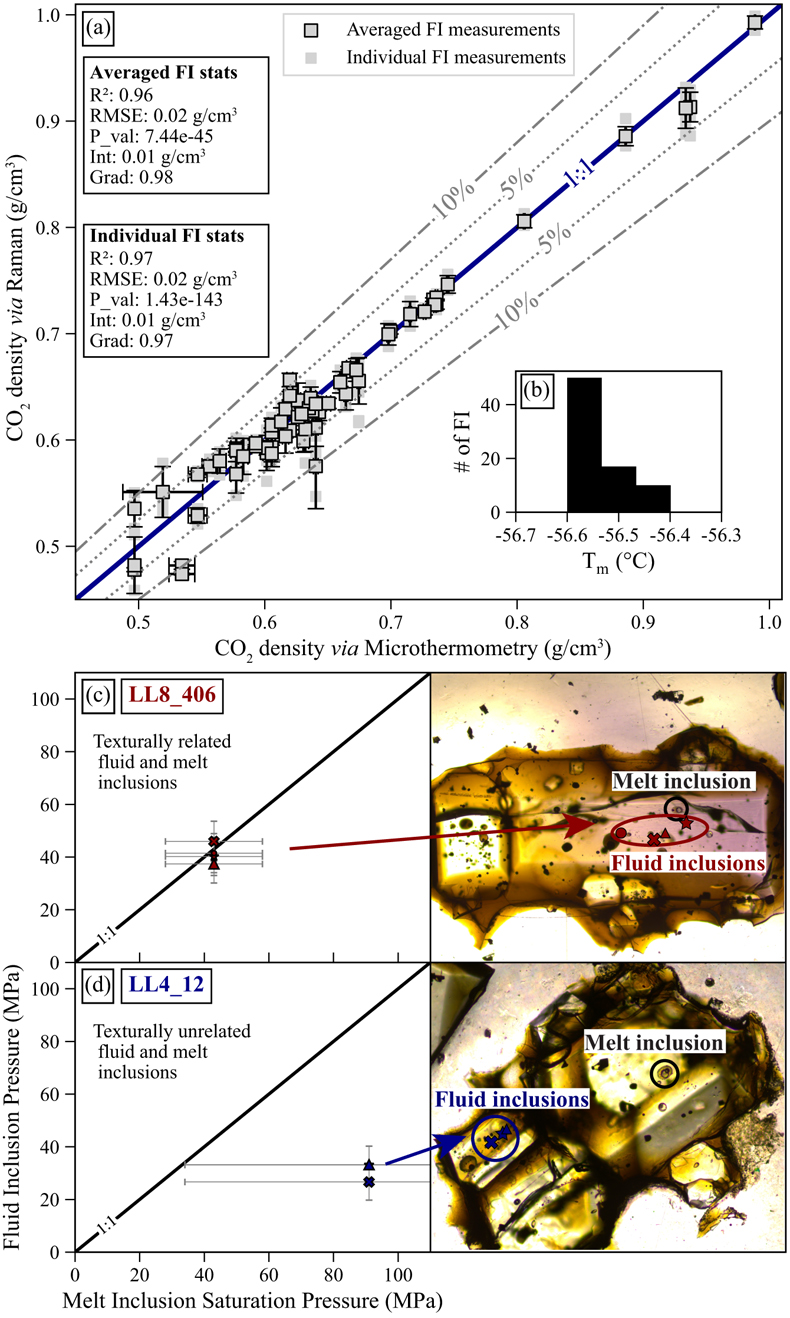
Figure 2 Comparison of Raman spectroscopy vs. Microthermometry, and of melt inclusion barometry vs. fluid inclusion barometry. (a, b) Density via Raman vs. density obtained from microthermometry. Outlined symbols represent averaged Raman measurement for each fluid inclusion and symbols without outlines are individual Raman measurements. Error bars show ±1σ of repeated measurements for Raman and microthermometry. (c) Crystal with clearly texturally related melt inclusions and fluid inclusions (LL8_406) showing overlapping pressures. (d) Crystal with texturally unrelated melt inclusions and fluid inclusions (LL4_12); fluid inclusions are found in a smaller olivine crystal in the same crystal cluster and return lower pressures. Specific crystal plots and images for every other pair identified are provided in the Supplementary Information Image Database for detailed comparisons.
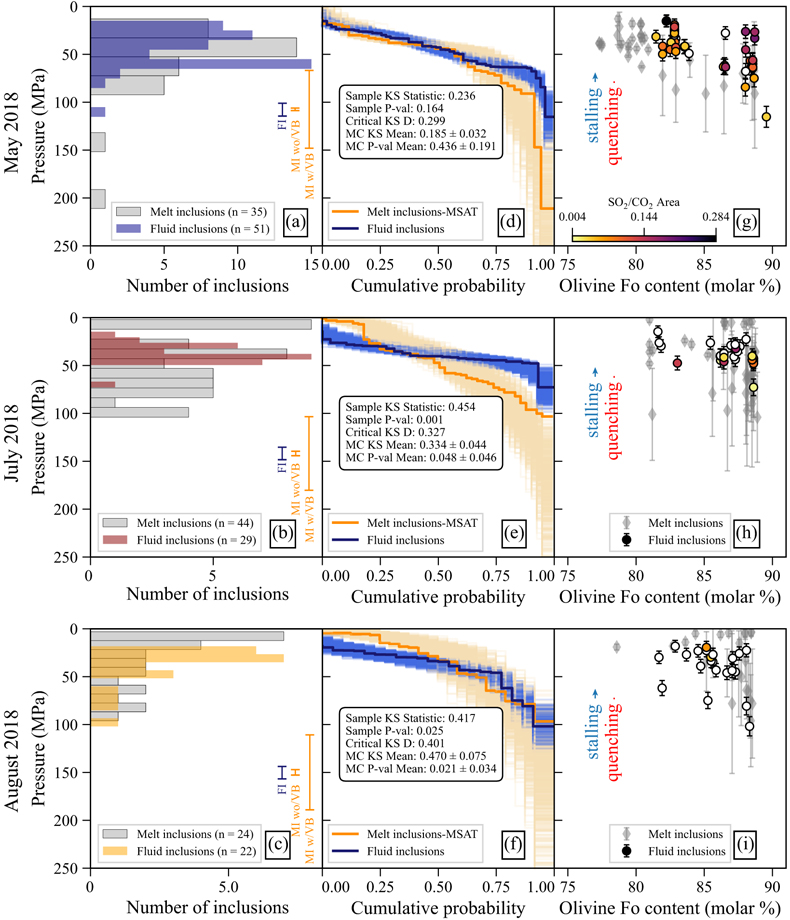
Figure 3 Comparing fluid inclusion and melt inclusion pressures for May, July and August 2018. (a–c) Histograms of pressures, with error bars indicate the average 1σ uncertainty for melt inclusions with vapour bubbles (MI w/VB) and without vapour bubbles (MI wo/VB), and the average 1σ fluid inclusion (FI) uncertainty. (d–f) Results of KS tests comparing fluid inclusion and melt inclusion pressure cumulative probability functions (CDF) from Monte Carlo simulations. For melt inclusions, the MagmaSat (Ghiorso and Gualda, 2015
Ghiorso, M.S., Gualda, G.A.R. (2015) An H2O–CO2 mixed fluid saturation model compatible with rhyolite-MELTS. Contributions to Mineralogy and Petrology 169, 53. https://doi.org/10.1007/s00410-015-1141-8
) results are shown (further details and five different solubility models in Supplementary Information). (g–i) Melt inclusion and fluid inclusion pressures vs. Fo content of the host olivine for (g) May 2018, (h) July 2018 and (i) August 2018. Fluid inclusions are coloured by SO2/CO2 peak area ratio. Blue and red arrows depict the maximum reduction in the internal pressure of a fluid inclusion trapped at the South Caldera reservoir induced by slow quenching (red in Fig. 4a, b) and 2 year stalling (blue in Fig. 4c, d).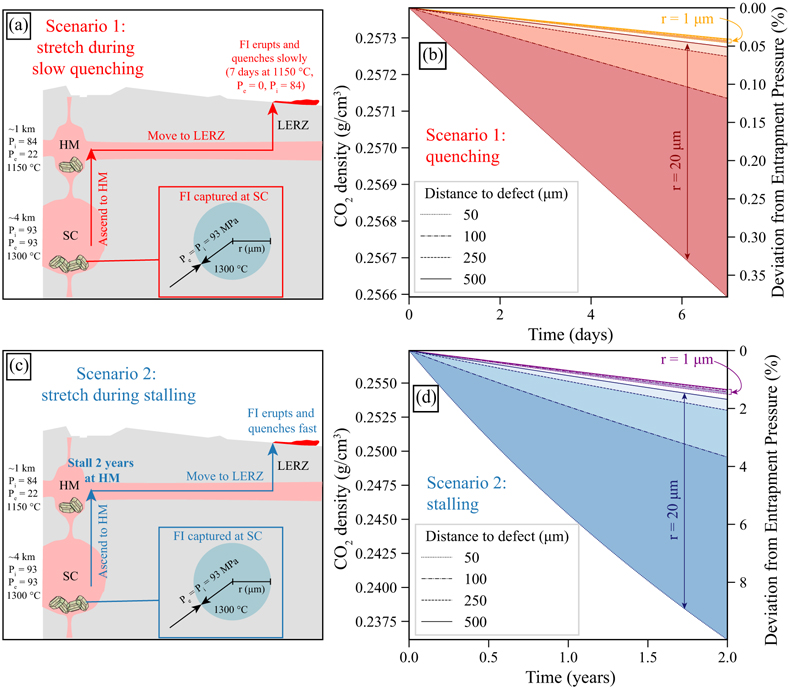
Figure 4 Assessing crystal cargoes and fluid inclusion re-equilibration. (a) Schematic diagram of Kīlauea plumbing system showing the scenario modelled in (b), where 1 and 20 μm radii fluid inclusions are captured in olivine crystals at the South Caldera (SC), they are transported to Halema‘uma‘u (HM) reservoir, almost immediately mobilised to the Lower East Rift Zone (LERZ), erupted, and slowly quenched for 7 days (T is kept at 1150 °C in the model). (b) Stretching model for slow quenching scenario in (a). (c) Diagram for the scenario modelled in (d), where the magma stalls at Halema‘uma‘u (HM) reservoir for 2 years prior to eruption. (d) Stretching model for stalling scenario in (c).