



Origins of the pervasive luminescence in modern stromatolites
Affiliations | Corresponding Author | Cite as | Funding information
Published by the European Association of Geochemistry
under Creative Commons License CC BY-NC-ND 4.0
Keywords: luminescence, fluorescence, stromatolite, pigment, CLSM


- Share this article


-
Article views:1,611Cumulative count of HTML views and PDF downloads.
- Download Citation
- Rights & Permissions

top
Abstract
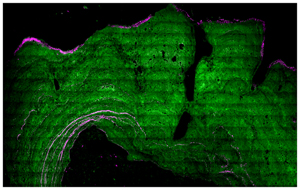
Figures
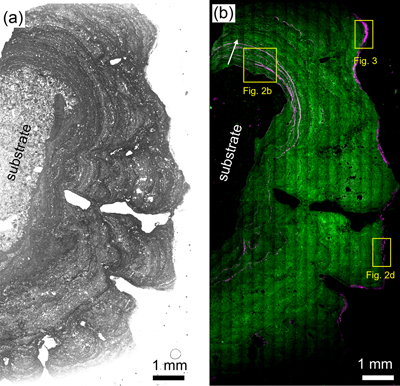 Figure 1 (a) Bright-field optical image showing the carbonate substrate (to the left), over which the stromatolite grows. (b) Composite epifluorescence mosaic of the same area as in (a). The white arrow indicates the stromatolitic growth direction. Holes are filled with resin. The mosaic is an overlay of one image (green fluorescence) obtained with the GFP filter (excitation, 450/50 nm; emission, 510/50 nm) and one image (magenta fluorescence) obtained with the CY5 filter (excitation, 640/30 nm; emission, 690/50 nm). | 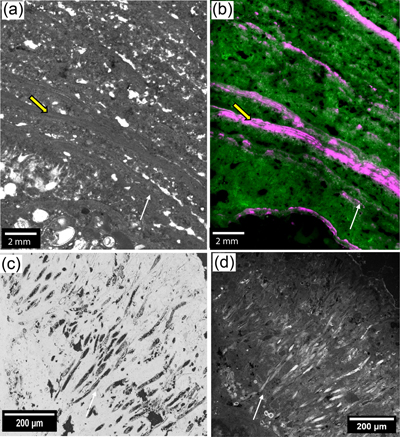 Figure 2 Distribution of the luminescence in a Mari Ermi stromatolite. The white arrows indicate the stromatolitic growth direction. (a) Bright field optical image showing some dark (e.g., yellow arrow) and bright, porous laminae. (b) Composite epifluorescence mosaic of the same area as shown in (a). Several dark laminae show a higher emission in the red compared with bright laminae. (c) Scanning electron microscopy image in the backscattered electron mode of an area located close to the stromatolite’s surface. Numerous filaments appear in black within a calcitic matrix (Debrie et al., 2022) that appears in white. (d) CLSM image obtained in the same area as in (c), showing high fluorescence in the filaments. A collection of fluorescence images at different emission wavelengths (between 400 and 730 nm, every 10 nm) was obtained with simultaneous excitations at 405, 488 and 633 nm. This collection was transformed to one single image by sum intensity projection, where the emission values at all wavelengths are summed for each pixel. More details are provided in the Supplementary Information. | 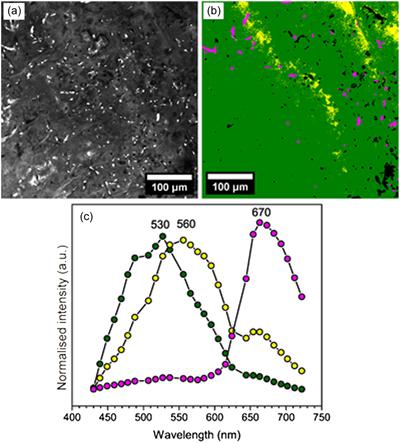 Figure 3 Spectral variations and distribution of the fluorescence. (a) Sum intensity projection of a CLSM stack acquired close to the surface of the stromatolite. (b) Map of the three main spectral components identified by segmentation of the hyperspectral image (Fig. S-1). The green, yellow and magenta areas relate to different spectral components. Black pixels correspond to micro-porosities filled with resin. (c) Average fluorescence emission spectra extracted from the pixels appearing in green, yellow and magenta in (b). The green, yellow and magenta spectra show maxima at 530, 560 and 670 nm, respectively. | 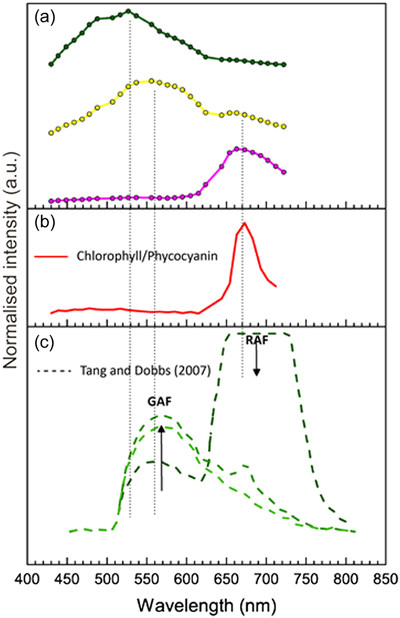 Figure 4 Spectral variations of luminescence in Sardinian stromatolites compared with some reference spectra. (a) Emission spectra of the three components identified in Mari Ermi stromatolites. (b) Fluorescence emission spectrum (405 – 488 – 633 nm laser excitation) of a chlorophyll/phycocyanin containing cell in the microbial mat covering Mari Ermi stromatolites. Fluorescence spectra of Mn in calcite and carotenoids are provided in the Supplementary Information. (c) Fluorescence emission spectra of variably degraded photosynthetic organisms. Spectra were derived from the study by Tang and Dobbs (2007). The black arrows show changes in the relative intensity of green autofluorescence (GAF) and chlorophyll-induced red autofluorescence (RAF) with increasing degradation. |
| Figure 1 | Figure 2 | Figure 3 | Figure 4 |
top
Introduction
Stromatolites are layered organo-sedimentary structures formed by microbial communities (Burne and Moore, 1987
Burne, R.V., Moore, L.S. (1987) Microbialites; organosedimentary deposits of benthic microbial communities. Palaios 2, 241–254. https://doi.org/10.2307/3514674
). They contain diverse organic molecules as remnants of the microorganisms that formed them, including lipids, proteins, carbohydrates, especially those composing extracellular polymeric substances (EPS), a variety of pigments and nucleic acids (Uveges et al., 2018Uveges, B.T., Teece, M.A., Fulton, J.M., Junium, C.K. (2018) Environmental controls on pigment distributions in the freshwater microbialites of Fayetteville Green Lake. Organic Geochemistry 125, 165–176. https://doi.org/10.1016/j.orggeochem.2018.08.012
). These biomolecules play crucial roles, influencing mineral precipitation, sediment binding and the overall structure of the microbial mats (Dupraz et al., 2009Dupraz, C., Reid, R.P., Braissant, O., Decho, A.W., Norman, R.S., Visscher, P.T. (2009) Processes of carbonate precipitation in modern microbial mats. Earth-Science Reviews 96, 141–162. https://doi.org/10.1016/j.earscirev.2008.10.005
). Thus, the preservation of these organic molecules is crucial to understand, since they may provide valuable information about paleoenvironments and the evolution of microbial communities. For this purpose, EPS (e.g., Benzerara et al., 2006Benzerara, K., Menguy, N., López-García, P., Yoon, T.-H., Kazmierczak, J., Tyliszczak, T., Guyot, F., Brown Jr, G.E. (2006) Nanoscale detection of organic signatures in carbonate microbialites. Proceedings of the National Academy of Sciences 103, 9440–9445. https://doi.org/10.1073/pnas.0603255103
) and lipid biomarkers (e.g., Johnson et al., 2018Johnson, D.B., Beddows, P.A., Flynn, T.M., Osburn, M.R. (2018) Microbial diversity and biomarker analysis of modern freshwater microbialites from Laguna Bacalar, Mexico. Geobiology 16, 319–337. https://doi.org/10.1111/gbi.12283
) have been prime targets searched for in the lithified portion of microbialites.Luminescence spectroscopy offers a powerful, non-destructive method to probe biological molecules in mineral–microbe assemblages (Lepot et al., 2008
Lepot, K., Benzerara, K., Brown Jr, G.E., Philippot, P. (2008) Microbially influenced formation of 2,724-million-year-old stromatolites. Nature Geoscience 1, 118–121. https://doi.org/10.1111/gbi.12096
). Luminescence is a general term encompassing the emission of light by a substance as a result of some form of energy input. Fluorescence is a specific type of luminescence occurring when a substance absorbs light at one wavelength and re-emits at a longer wavelength. Here, the terms 'fluorescence’ and 'luminescence’ will be used interchangeably. Many biological molecules autofluoresce, making luminescence an ideal tool for studying organic components in stromatolites without the need for staining. While several studies have used confocal laser scanning microscopy (CLSM) to study luminescence in modern microbial mats and biofilms (e.g., Kawaguchi and Decho, 2002Kawaguchi, T., Decho, A.W. (2002) In Situ Microspatial Imaging Using Two-Photon and Confocal Laser Scanning Microscopy of Bacteria and Extracellular Polymeric Secretions (EPS) Within Marine Stromatolites. Marine Biotechnology 4, 127–131. https://doi.org/10.1007/s10126-001-0073-7
; Zippel and Neu, 2011Zippel, B., Neu, T.R. (2011) Characterization of Glycoconjugates of Extracellular Polymeric Substances in Tufa-Associated Biofilms by Using Fluorescence Lectin-Binding Analysis. Applied and Environmental Microbiology 77, 505–516. https://doi.org/10.1128/AEM.01660-10
; Rouillard et al., 2020Rouillard, J., García-Ruiz, J.M., Kah, L., Gérard, E., Barrier, L., Nabhan, S., Gong, J., van Zuilen, M.A. (2020) Identifying microbial life in rocks: Insights from population morphometry. Geobiology 18, 282–305. https://doi.org/10.1111/gbi.12377
), its application to the more lithified portions of stromatolites remains limited. Furthermore, although CLSM provides high resolution hyperspectral data (Sinclair et al., 2006Sinclair, M.B., Haaland, D.M., Timlin, J.A., Jones, H.D.T. (2006) Hyperspectral confocal microscope. Applied Optics 45, 6283–6291. https://doi.org/10.1364/AO.45.006283
), it is primarily used for qualitative imaging, with limited analysis of the spectral information it offers (Gérard et al., 2013Gérard, E., Ménez, B., Couradeau, E., Moreira, D., Benzerara, K., Tavera, R., López-García, P. (2013) Specific carbonate–microbe interactions in the modern microbialites of Lake Alchichica (Mexico). The ISME Journal 7, 1997–2009. https://doi.org/10.1038/ismej.2013.81
, 2018Gérard, E., De Goeyse, S., Hugoni, M., Agogué, H., Richard, L., Milesi, V., et al. (2018) Key Role of Alphaproteobacteria and Cyanobacteria in the Formation of Stromatolites of Lake Dziani Dzaha (Mayotte, Western Indian Ocean). Frontiers in Microbiology 9, 796. https://doi.org/10.3389/fmicb.2018.00796
; Stigliano et al., 2023Stigliano, L., Caumartin, J., Benzerara, K. (2023) Micro-and nanoscale techniques for studying biofilm-mineral interactions. In: Gurtler, V., Patrauchan, M. (Eds.) Biofilms. Academic Press, London, 143–192. https://doi.org/10.1016/bs.mim.2023.04.001
). Here, we investigated the autofluorescence of modern lagoon stromatolites from Mari Ermi, a coastal pond in Western Sardinia, using CLSM. This site experiences seasonal droughts and salinity variations, reflected in the stromatolites’ complex mineralogical composition at the submicrometre scale (Debrie et al., 2022Debrie, J., Prêt, D., Menguy, N., Estève, I., Sans-Jofre, P., Saint Martin, J.-P., Benzerara, K. (2022) Mapping mineralogical heterogeneities at the nm-scale by scanning electron microscopy in modern Sardinian stromatolites: Deciphering the origin of their laminations. Chemical Geology 609, 121059. https://doi.org/10.1016/j.chemgeo.2022.121059
). Our study aimed to 1) characterise the spectral variability of the fluorescence signal, potentially indicating different types of organic molecules and 2) map the distribution of these spectral variations across entire depth sections of stromatolites at a submicrometre resolution. By thoroughly analysing the hyperspectral CLSM data, we highlight the pervasive nature of fluorescence in these stromatolites and discuss the origins and implications of this signal. This approach allows us to gain new insights into the distribution and preservation of organic molecules within stromatolites, furthering our understanding of these important geological structures and the microbial communities that create them.top
Results
Pervasive luminescence and variations of luminescence intensity across laminations in Mari Ermi stromatolites. Luminescence is ubiquitous in Mari Ermi stromatolites, as evidenced by correlated transmitted light microscopy and epifluorescence mosaics (Figs. 1, 2). This pervasive luminescence sharply contrasts with the absence of detectable signal in both the underlying carbonate pebble substrate and the resin-filled porous regions within the stromatolites (Fig. 1). As further explained in the discussion, most of this luminescence is likely due to the preservation of organics in the lithified portion of the stromatolites. Spectral analysis of the luminescence reveals significant spatial heterogeneity at the submillimetre scale (Fig. 1), with certain variations correlating with the stromatolite’s laminar structure (Fig. 2a, b). Notably, laminae appearing bright under transmitted light microscopy predominantly exhibit green luminescence, whereas darker laminae display lower overall intensities (Fig. 1) and occasionally manifest a redder luminescence signature (Fig. 2b). At higher magnification, the spatial distribution of luminescence intensity becomes more nuanced. Regions of elevated intensity are observed, with some fluorescence signals associated with microbial filaments proximal to the stromatolite surfaces (Fig. 2c, d). These changes are likely related to the molecule content, but possibly also to variations in the characteristics of the fluorescing molecules.
Figure 1 (a) Bright-field optical image showing the carbonate substrate (to the left), over which the stromatolite grows. (b) Composite epifluorescence mosaic of the same area as in (a). The white arrow indicates the stromatolitic growth direction. Holes are filled with resin. The mosaic is an overlay of one image (green fluorescence) obtained with the GFP filter (excitation, 450/50 nm; emission, 510/50 nm) and one image (magenta fluorescence) obtained with the CY5 filter (excitation, 640/30 nm; emission, 690/50 nm).
Figure 2 Distribution of the luminescence in a Mari Ermi stromatolite. The white arrows indicate the stromatolitic growth direction. (a) Bright field optical image showing some dark (e.g., yellow arrow) and bright, porous laminae. (b) Composite epifluorescence mosaic of the same area as shown in (a). Several dark laminae show a higher emission in the red compared with bright laminae. (c) Scanning electron microscopy image in the backscattered electron mode of an area located close to the stromatolite’s surface. Numerous filaments appear in black within a calcitic matrix (Debrie et al., 2022
Debrie, J., Prêt, D., Menguy, N., Estève, I., Sans-Jofre, P., Saint Martin, J.-P., Benzerara, K. (2022) Mapping mineralogical heterogeneities at the nm-scale by scanning electron microscopy in modern Sardinian stromatolites: Deciphering the origin of their laminations. Chemical Geology 609, 121059. https://doi.org/10.1016/j.chemgeo.2022.121059
) that appears in white. (d) CLSM image obtained in the same area as in (c), showing high fluorescence in the filaments. A collection of fluorescence images at different emission wavelengths (between 400 and 730 nm, every 10 nm) was obtained with simultaneous excitations at 405, 488 and 633 nm. This collection was transformed to one single image by sum intensity projection, where the emission values at all wavelengths are summed for each pixel. More details are provided in the Supplementary Information.Luminescence spectral variations in Mari Ermi stromatolites. A first analysis of CLSM hyperspectral images demonstrates that most of the emitted luminescence corresponds to green light (∼530–560 range; Fig. 1b). However, some spatial variations of the luminescence spectral properties (“colours”) are observed. First, a red luminescence (∼670 nm in wavelength) is detected at the surface of the stromatolites. A red with some green luminescence is also observed deeper in some dark laminations (Figs. 1, 2b). The spectral variability was further analysed based on hyperspectral data acquired over a 4 × 4 mm2 area close to the stromatolite surface, encompassing an alternation of bright and dark laminae (Fig. 3). Three wavelength intervals were defined after inspection of the dataset spectral variability and analysis of end member spectra generated by non-negative multivariate statistical analyses (Figs. S-1, S-2): a green interval, C1 (430 to 537 nm), a yellow one, C2 (556 to 624 nm) and a red one, C3 (644 to 722 nm). The choice of three instead of two components was also supported by multivariate statistical analyses (Fig. S-2). The relative contributions of these intervals were calculated for the spectrum of each pixel of the image. All pixels were finally plotted in a ternary scatterplot (Fig. S-1a). Most of the pixels spread between C1 and C2, indicating that most luminescence spectra mainly show a green emission contribution mixed with a, more or less, intense yellow luminescence. The remaining pixels are located closer to the red (C3) component. Overall, all pixels spread between three different spectral components, which explains all the observed spectral variability (Figs. 3b, c and S-1b). The measured spectra of the pixels the most representative of these three spectral components (purest pixels) are shown in Figure 3c (similar to end member spectra obtained by multivariate analyses, Fig. S-2). None of these spectra can be explained by a linear combination of the other two. Moreover, pixels representative of these three spectral components were back projected to the hyperspectral map to assess their spatial distribution (Fig. 3b). The green spectral component (C1) (Fig. S-1c) shows a broad peak with a maximum intensity at 530 nm. The spatial distribution of this component is the most widespread in the stromatolite, corresponding to the pervasive signal initially observed. The yellow spectral component (C2) (Fig. S-1d) looks spectrally similar but with a broad peak centred at a higher wavelength (∼560 nm) and an additional small emission peak at ∼ 670 nm (red fluorescence). This component appears in some dark laminae of the stromatolite. In some deeper laminae (Figs. 1, 2), the red fluorescence peak can be relatively higher. Last, the red component (C3) (Fig. S-1e) shows a maximum intensity at 670 nm with little to no green. This component was spatially restricted to spheres or filaments measuring ∼10 to 30 μm in diameter, located near the surface of stromatolites, with a high fluorescence intensity. Three similar “virtual” spectral end members were obtained by a non-negative matrix factorisation (NNMF) statistical analysis but with a noisier appearance (Fig. S-2).
Figure 3 Spectral variations and distribution of the fluorescence. (a) Sum intensity projection of a CLSM stack acquired close to the surface of the stromatolite. (b) Map of the three main spectral components identified by segmentation of the hyperspectral image (Fig. S-1). The green, yellow and magenta areas relate to different spectral components. Black pixels correspond to micro-porosities filled with resin. (c) Average fluorescence emission spectra extracted from the pixels appearing in green, yellow and magenta in (b). The green, yellow and magenta spectra show maxima at 530, 560 and 670 nm, respectively.
top
Discussion
The luminescence is not only observed as a strong signal in living biofilms at the surface of Mari Ermi stromatolites (Fig. 1), but it is also pervasive in their deeper lithified portion. This fluorescence shows some spectral variability, and three different spectral components are identified (Fig. 4a), with a tentative interpretation below.
Figure 4 Spectral variations of luminescence in Sardinian stromatolites compared with some reference spectra. (a) Emission spectra of the three components identified in Mari Ermi stromatolites. (b) Fluorescence emission spectrum (405 – 488 – 633 nm laser excitation) of a chlorophyll/phycocyanin containing cell in the microbial mat covering Mari Ermi stromatolites. Fluorescence spectra of Mn in calcite and carotenoids are provided in the Supplementary Information. (c) Fluorescence emission spectra of variably degraded photosynthetic organisms. Spectra were derived from the study by Tang and Dobbs (2007)
Tang, Y.Z., Dobbs, F.C. (2007) Green Autofluorescence in Dinoflagellates, Diatoms, and Other Microalgae and Its Implications for Vital Staining and Morphological Studies. Applied and Environmental Microbiology 73, 2306–2313. https://doi.org/10.1128/AEM.01741-06
. The black arrows show changes in the relative intensity of green autofluorescence (GAF) and chlorophyll-induced red autofluorescence (RAF) with increasing degradation.Origin of red fluorescence in the Sardinian stromatolites. The spectrum of the red component (C3) exhibits a maximum value at 670 nm and is co-localised with filaments measuring approximately 10–15 μm in diameter and 100 to 150 μm in length. These filaments have been interpreted as cyanobacteria entombed by calcite precipitation (Saint Martin and Saint Martin, 2015
Saint Martin, J.-P., Saint Martin, S. (2015) Discovery of calcareous microbialites in coastal ponds of western Sardinia (Italy). Geo-Eco-Marina 21, 35–53. https://journal.geoecomar.ro/geo-eco-marina/article/view/03_2015
; Debrie et al., 2022Debrie, J., Prêt, D., Menguy, N., Estève, I., Sans-Jofre, P., Saint Martin, J.-P., Benzerara, K. (2022) Mapping mineralogical heterogeneities at the nm-scale by scanning electron microscopy in modern Sardinian stromatolites: Deciphering the origin of their laminations. Chemical Geology 609, 121059. https://doi.org/10.1016/j.chemgeo.2022.121059
). While it is possible that a yet unidentified inorganic fluorochrome may contribute to this fluorescence, we note that phycocyanin and chlorophyll emit at a similar wavelength, approximately 650 and 685 nm, and that the emission spectrum of a cyanobacterium (Dartnell et al., 2011Dartnell, L.R., Storrie-Lombardi, M.C., Mullineaux, C.W., Ruban, A.V., Wright, G., Griffiths, A.D., Muller, J.-P., Ward, J.M. (2011) Degradation of Cyanobacterial Biosignatures by Ionizing Radiation. Astrobiology 11, 997–1016. https://doi.org/10.1089/ast.2011.0663
) looks very similar to the C3 component in Mari Ermi stromatolites. Moreover, similar spectra were measured in the biofilms covering Mari Ermi microbialites (Fig. 4b), further supporting the assignment of this spectral component to chlorophyll and/or phycocyanin.This type of spectrum was detected in the filaments of the upper part of the stromatolite section only. Chlorophyll degradation occurs through various processes, such as intense irradiation (Dartnell et al., 2011
Dartnell, L.R., Storrie-Lombardi, M.C., Mullineaux, C.W., Ruban, A.V., Wright, G., Griffiths, A.D., Muller, J.-P., Ward, J.M. (2011) Degradation of Cyanobacterial Biosignatures by Ionizing Radiation. Astrobiology 11, 997–1016. https://doi.org/10.1089/ast.2011.0663
), a likely minor factor under the conditions present at Mari Ermi. Other degradation mechanisms include grazing and partial hydrolysis by various enzymes, including chlorophyllases produced by diatoms (Villanueva et al., 1994Villanueva, J., Grimalt, J.O., de Wit, R., Keely, B.J., Maxwell, J.R. (1994) Chlorophyll and carotenoid pigments in solar saltern microbial mats. Geochimica et Cosmochimica Acta 58, 4703–4715. https://doi.org/10.1016/0016-7037(94)90202-X
). By contrast, chlorophyll was unlikely degraded during data collection, since the 2 % laser power employed is a standard setting for capturing pristine spectra of chlorophyll and phycocyanin (e.g., Gerard et al., 2018Gérard, E., De Goeyse, S., Hugoni, M., Agogué, H., Richard, L., Milesi, V., et al. (2018) Key Role of Alphaproteobacteria and Cyanobacteria in the Formation of Stromatolites of Lake Dziani Dzaha (Mayotte, Western Indian Ocean). Frontiers in Microbiology 9, 796. https://doi.org/10.3389/fmicb.2018.00796
). Chlorophyll degradation in Mari Ermi stromatolites produces a variety of byproducts, with varying fluorescence spectra or no fluorescence at all for the most advanced ones (Hörtensteiner, 2006Hörtensteiner, S. (2006) Chlorophyll Degradation During Senescence. Annual Review of Plant Biology 57, 55–77. https://doi.org/10.1146/annurev.arplant.57.032905.105212
). Overall, the occurrence of this red spectral component down to a limited depth suggests that there is a maximum depth, above which chlorophyll/phycocyanin with intact spectral characteristics is preserved. Sun et al. (1991)Sun, M., Aller, R.C., Lee, C. (1991) Early diagenesis of chlorophyll-a in Long Island Sound sediments: A measure of carbon flux and particle reworking. Journal of Marine Research 49, 379–401. https://doi.org/10.1357/002224091784995927
showed that chlorophyll degrades very rapidly in sediments under oxic conditions, with a half-life of a few tens of days, whereas parameters such as anoxia may extend preservation for more than a few decades (Pirtle-Levy et al., 2009Pirtle-Levy, R., Grebmeier, J.M., Cooper, L.W., Larsen, I.L. (2009) Chlorophyll a in Arctic sediments implies long persistence of algal pigments. Deep Sea Research Part II: Topical Studies in Oceanography 56, 1326–1338. https://doi.org/10.1016/j.dsr2.2008.10.022
). Lepot et al. (2014)Lepot, K., Compère, P., Gérard, E., Namsaraev, Z., Verleyen, E., Tavernier, I., et al. (2014) Organic and mineral imprints in fossil photosynthetic mats of an East Antarctic lake. Geobiology 12, 424–450. https://doi.org/10.1111/gbi.12096
detected chlorophyll fluorescence in 160-year-old sediments but suggested that they may have underestimated preservation because of some pigment loss upon sample preparation. The detection of chlorophyll residues with mass spectrometry probes signatures of porphyrin and not intact chlorophyll, which can therefore be at a much more advanced degradation stage than mentioned above. Such signatures have been detected in rocks as old as 1.1 billion years (Gueneli et al., 2018Gueneli, N., McKenna, A.M., Ohkouchi, N., Boreham, C.J., Beghin, J., Javaux, E.J., Brocks, J.J. (2018) 1.1-billion-year-old porphyrins establish a marine ecosystem dominated by bacterial primary producers. Proceedings of the National Academy of Sciences 115, E6978–E6986. https://doi.org/10.1073/pnas.1803866115
).Origin of green fluorescence in Mari Ermi stromatolites. Interpreting the origin of the two other spectral components, primarily emitting in the green, is less straightforward. One hypothesis is that they are inorganic in origin, possibly linked with the presence of luminescence activators within calcite, the predominant mineral phase composing Mari Ermi stromatolites (Debrie et al., 2022
Debrie, J., Prêt, D., Menguy, N., Estève, I., Sans-Jofre, P., Saint Martin, J.-P., Benzerara, K. (2022) Mapping mineralogical heterogeneities at the nm-scale by scanning electron microscopy in modern Sardinian stromatolites: Deciphering the origin of their laminations. Chemical Geology 609, 121059. https://doi.org/10.1016/j.chemgeo.2022.121059
). The most well known activator in this context is Mn2+, present at trace levels in Mari Ermi stromatolites (see Table S-1). However, Mn2+ substitution in calcite typically yields a luminescence spectrum centred at approximately 600–610 nm (Fig. S-2), which significantly diverges from the spectrum observed here (see Figs. 3c and 4a). Alternatively, the two components might have an organic origin. A first hypothesis could be that the observed signal is associated with non-pigmented material of currently unknown origin. However, in the remainder of this discussion, we will focus on a pigment-based origin, since, based on the observation of the biofilms at the surface of these modern stromatolites, pigments appear as an obvious source of fluorescence, likely to be preserved upon lithification. The broad emission bands with maxima at 530 and 560 nm observed for the two Mari Ermi components bear a striking resemblance with the emission spectra of carotenoid pigments (Fig. S-3) (Vermaas et al., 2008Vermaas, W.F.J., Timlin, J.A., Jones, H.D.T., Sinclair, M.B., Nieman, L.T., Hamad, S.W., Melgaard, D.K., Haaland, D.M. (2008) In vivo hyperspectral confocal fluorescence imaging to determine pigment localization and distribution in cyanobacterial cells. Proceedings of the National Academy of Sciences 105, 4050–4055. https://doi.org/10.1073/pnas.0708090105
). If these components are indeed carotenoids, their spatial distribution suggests that they significantly outweigh undegraded chlorophyll/phycocyanin within Mari Ermi stromatolites. This observation could be explained in two possible ways: either carotenoids are more abundant than chlorophyll/phycocyanin in the microbial mats, which is not observed (Fig. 4b), or there is preferential degradation of phycocyanin/chlorophyll compared to carotenoids. Consistently, carotenoids are known to be resistant to certain processes of degradation due to their antioxidant properties (Nelson and Cox, 2005Nelson, D.L., Cox, M.M. (2005) Lehninger Principles of Biochemistry. Fourth Edition, W.H. Freeman and Company, New York.
). Future analyses of biomarkers would help to further test these ideas.Alternatively, a seemingly more parsimonious interpretation for the two green luminescent components is that they correspond to two different degradation stages of chlorophyll and/or phycocyanin. Several studies have shown that chlorophyll-type pigments are frequently preserved with some structural modifications (Tahoun et al., 2021
Tahoun, M., Gee, C.T., McCoy, V.E., Sander, P.M., Müller, C.E. (2021) Chemistry of porphyrins in fossil plants and animals. RSC Advances 11, 7552–7563. https://doi.org/10.1039/D0RA10688G
). Moreover, the breakdown of photosynthetic pigments has been shown to result in the appearance of what has been called a non-specific green autofluorescence (GAF). This process intensifies after cellular death (Schulze et al., 2011Schulze, K., López, D.A., Tillich, U.M., Frohme, M. (2011) A simple viability analysis for unicellular cyanobacteria using a new autofluorescence assay, automated microscopy, and ImageJ. BMC Biotechnology 11, 118. https://doi.org/10.1186/1472-6750-11-118
) and has been detected for a diversity of microorganisms such as algae, dinoflagellates, diatoms (Tang and Dobbs, 2007Tang, Y.Z., Dobbs, F.C. (2007) Green Autofluorescence in Dinoflagellates, Diatoms, and Other Microalgae and Its Implications for Vital Staining and Morphological Studies. Applied and Environmental Microbiology 73, 2306–2313. https://doi.org/10.1128/AEM.01741-06
) and cyanobacteria (Roldán et al., 2014Roldán, M., Ascaso, C., Wierzchos, J. (2014) Fluorescent Fingerprints of Endolithic Phototrophic Cyanobacteria Living within Halite Rocks in the Atacama Desert. Applied and Environmental Microbiology 80, 2998–3006. https://doi.org/10.1128/AEM.03428-13
). GAF emission spectra measured at different degradation stages show a major peak at a wavelength varying between 530 up and 550 nm together with a peak at 670 nm which becomes smaller in intensity at more advanced degradation (Tang and Dobbs, 2007Tang, Y.Z., Dobbs, F.C. (2007) Green Autofluorescence in Dinoflagellates, Diatoms, and Other Microalgae and Its Implications for Vital Staining and Morphological Studies. Applied and Environmental Microbiology 73, 2306–2313. https://doi.org/10.1128/AEM.01741-06
). The spectra of the two green-emitting components found in Mari Ermi stromatolites are very similar to the two different degradation stages. In this scenario, the spectral component showing a maximum emission at 560 nm, accompanied by a small peak at 670 nm, represent an intermediate stage in the chlorophyll/phycocyanin degradation pathway. Conversely, the component that exhibits a primary peak at 530 nm, with no discernible emission at 670 nm, corresponds to a later stage of degradation. In this context, the relatively higher red signal observed in some of the deeper laminae, as shown in Figures 1 and 2, would be best explained as an additional stage where pigments are best preserved, suggesting a quicker lithification of the laminae containing them. Additionally, spectra with a small peak at 670 nm also show a red-shifted emission maximum (560 nm) compared to spectra with no 670 nm peak (emission maximum at 530 nm). Based on existing spectral references, it remains unclear whether this spectral shift is also correlated with the degradation advance of chlorophyll/phycocyanin or some variability of the initial pigment assemblage.Variations of the green fluorescence intensity and spectral characteristics between laminae. The green fluorescence intensity differed between laminae; bright laminae had a higher fluorescence intensity than dark laminae (Fig. 1). Debrie et al. (2022)
Debrie, J., Prêt, D., Menguy, N., Estève, I., Sans-Jofre, P., Saint Martin, J.-P., Benzerara, K. (2022) Mapping mineralogical heterogeneities at the nm-scale by scanning electron microscopy in modern Sardinian stromatolites: Deciphering the origin of their laminations. Chemical Geology 609, 121059. https://doi.org/10.1016/j.chemgeo.2022.121059
proposed that bright laminae formed in the presence of denser microbial biofilms compared with dark laminae. This would be consistent with the interpretation of this fluorescence as GAF, resulting from chlorophyll/phycocyanin degradation, with the higher fluorescence intensity in bright laminae resulting from an initially higher microbial cell density.In addition to the intensity, the fluorescence spectral properties vary between laminae (Figs. 2b, 3b). While an emission peak at 670 nm was observed in dark laminae, sometimes quite deep under the stromatolite surface (Fig. 1), it was negligible in bright laminae. According to the aforementioned hypothesis, this could be explained by a stronger degradation of chlorophyll/phycocyanin in bright laminae than in dark laminae. Similarly, the porosity has been shown to be higher in bright laminae than in dark laminae (Debrie et al. 2022
Debrie, J., Prêt, D., Menguy, N., Estève, I., Sans-Jofre, P., Saint Martin, J.-P., Benzerara, K. (2022) Mapping mineralogical heterogeneities at the nm-scale by scanning electron microscopy in modern Sardinian stromatolites: Deciphering the origin of their laminations. Chemical Geology 609, 121059. https://doi.org/10.1016/j.chemgeo.2022.121059
). Overall, it could be speculated that higher porosity may allow longer contact time between porewater and pigments, resulting in more advanced degradation. Alternatively, if porosity is secondary, this may be indicative of locally more important transformations which may have also impacted pigment degradation.top
Conclusions
Three distinct photoluminescence signals are observed in modern stromatolites from Mari Ermi, Sardinia. While other, yet to be identified, origins may exist, these signals are best interpreted as the results of relatively intact to variably degraded pigments produced by the microorganisms that thrived during the formation of the stromatolites. Notably, well preserved chlorophyll/phycocyanin pigments are mainly associated with morphologically preserved microfossils, predominantly near the stromatolite’s surface, and occasionally in some deeper laminae. Variably degraded chlorophyll/phycocyanin molecules were pervasive within the carbonate matrix, generating a non-specific green autofluorescence (GAF). GAF varied in intensity and spectrally across distinct laminae, possibly due to varying degradation advances. The varying degrees of pigment degradation across laminae may provide clues about the diagenetic history of stromatolites and the environmental conditions they experienced over time. Future research should focus on determining the maximum duration of fluorescent pigment preservation, the effects of environmental factors on organic signature persistence, and the comparison of luminescence characteristics between modern and ancient stromatolites. These investigations will improve our understanding of organic matter preservation in stromatolites, a knowledge useful for better interpreting the fossil record of past life on Earth.
top
Acknowledgements
Our work has benefitted from the financial support from the Paris Ile-de-France Region – DIM “Matériaux anciens et patrimoniaux” (MAP) and from the French national INSU programme Interrvie. We thank Imène Esteve, Stéphanie Delbrel and Béatrice Doisneau for support at the SEM facility and Massimo Marras and Roberto Brundu from the marine protected area “Peninsula of Sinis - Island of Mal di Ventre”. We thank two anonymous reviewers and Satish Myneni for their comments that significantly improved the quality of the manuscript.
Editor: Satish Myneni
top
References
Benzerara, K., Menguy, N., López-García, P., Yoon, T.-H., Kazmierczak, J., Tyliszczak, T., Guyot, F., Brown Jr, G.E. (2006) Nanoscale detection of organic signatures in carbonate microbialites. Proceedings of the National Academy of Sciences 103, 9440–9445. https://doi.org/10.1073/pnas.0603255103
 Show in context
 For this purpose, EPS (e.g., Benzerara et al., 2006) and lipid biomarkers (e.g., Johnson et al., 2018) have been prime targets searched for in the lithified portion of microbialites.
View in article
Burne, R.V., Moore, L.S. (1987) Microbialites; organosedimentary deposits of benthic microbial communities. Palaios 2, 241–254. https://doi.org/10.2307/3514674
Show in context Stromatolites are layered organo-sedimentary structures formed by microbial communities (Burne and Moore, 1987).
View in article
Dartnell, L.R., Storrie-Lombardi, M.C., Mullineaux, C.W., Ruban, A.V., Wright, G., Griffiths, A.D., Muller, J.-P., Ward, J.M. (2011) Degradation of Cyanobacterial Biosignatures by Ionizing Radiation. Astrobiology 11, 997–1016. https://doi.org/10.1089/ast.2011.0663
Show in context While it is possible that a yet unidentified inorganic fluorochrome may contribute to this fluorescence, we note that phycocyanin and chlorophyll emit at a similar wavelength, approximately 650 and 685 nm, and that the emission spectrum of a cyanobacterium (Dartnell et al., 2011) looks very similar to the C3 component in Mari Ermi stromatolites.
View in article
This type of spectrum was detected in the filaments of the upper part of the stromatolite section only. Chlorophyll degradation occurs through various processes, such as intense irradiation (Dartnell et al., 2011), a likely minor factor under the conditions present at Mari Ermi.
View in article
Debrie, J., Prêt, D., Menguy, N., Estève, I., Sans-Jofre, P., Saint Martin, J.-P., Benzerara, K. (2022) Mapping mineralogical heterogeneities at the nm-scale by scanning electron microscopy in modern Sardinian stromatolites: Deciphering the origin of their laminations. Chemical Geology 609, 121059. https://doi.org/10.1016/j.chemgeo.2022.121059
Show in context This site experiences seasonal droughts and salinity variations, reflected in the stromatolites’ complex mineralogical composition at the submicrometre scale (Debrie et al., 2022).
View in article
Numerous filaments appear in black within a calcitic matrix (Debrie et al., 2022) that appears in white.
View in article
These filaments have been interpreted as cyanobacteria entombed by calcite precipitation (Saint Martin and Saint Martin, 2015; Debrie et al., 2022).
View in article
One hypothesis is that they are inorganic in origin, possibly linked with the presence of luminescence activators within calcite, the predominant mineral phase composing Mari Ermi stromatolites (Debrie et al., 2022).
View in article
Debrie et al. (2022) proposed that bright laminae formed in the presence of denser microbial biofilms compared with dark laminae.
View in article
Similarly, the porosity has been shown to be higher in bright laminae than in dark laminae (Debrie et al. 2022).
View in article
Dupraz, C., Reid, R.P., Braissant, O., Decho, A.W., Norman, R.S., Visscher, P.T. (2009) Processes of carbonate precipitation in modern microbial mats. Earth-Science Reviews 96, 141–162. https://doi.org/10.1016/j.earscirev.2008.10.005
Show in context These biomolecules play crucial roles, influencing mineral precipitation, sediment binding and the overall structure of the microbial mats (Dupraz et al., 2009).
View in article
Gérard, E., Ménez, B., Couradeau, E., Moreira, D., Benzerara, K., Tavera, R., López-García, P. (2013) Specific carbonate–microbe interactions in the modern microbialites of Lake Alchichica (Mexico). The ISME Journal 7, 1997–2009. https://doi.org/10.1038/ismej.2013.81
Show in context Furthermore, although CLSM provides high resolution hyperspectral data (Sinclair et al., 2006), it is primarily used for qualitative imaging, with limited analysis of the spectral information it offers (Gérard et al., 2013, 2018; Stigliano et al., 2023).
View in article
Gérard, E., De Goeyse, S., Hugoni, M., Agogué, H., Richard, L., Milesi, V., et al. (2018) Key Role of Alphaproteobacteria and Cyanobacteria in the Formation of Stromatolites of Lake Dziani Dzaha (Mayotte, Western Indian Ocean). Frontiers in Microbiology 9, 796. https://doi.org/10.3389/fmicb.2018.00796
Show in context Furthermore, although CLSM provides high resolution hyperspectral data (Sinclair et al., 2006), it is primarily used for qualitative imaging, with limited analysis of the spectral information it offers (Gérard et al., 2013, 2018; Stigliano et al., 2023).
View in article
By contrast, chlorophyll was unlikely degraded during data collection, since the 2 % laser power employed is a standard setting for capturing pristine spectra of chlorophyll and phycocyanin (e.g., Gerard et al., 2018).
View in article
Gueneli, N., McKenna, A.M., Ohkouchi, N., Boreham, C.J., Beghin, J., Javaux, E.J., Brocks, J.J. (2018) 1.1-billion-year-old porphyrins establish a marine ecosystem dominated by bacterial primary producers. Proceedings of the National Academy of Sciences 115, E6978–E6986. https://doi.org/10.1073/pnas.1803866115
Show in context Such signatures have been detected in rocks as old as 1.1 billion years (Gueneli et al., 2018).
View in article
Hörtensteiner, S. (2006) Chlorophyll Degradation During Senescence. Annual Review of Plant Biology 57, 55–77. https://doi.org/10.1146/annurev.arplant.57.032905.105212
Show in context Chlorophyll degradation in Mari Ermi stromatolites produces a variety of byproducts, with varying fluorescence spectra or no fluorescence at all for the most advanced ones (Hörtensteiner, 2006).
View in article
Johnson, D.B., Beddows, P.A., Flynn, T.M., Osburn, M.R. (2018) Microbial diversity and biomarker analysis of modern freshwater microbialites from Laguna Bacalar, Mexico. Geobiology 16, 319–337. https://doi.org/10.1111/gbi.12283
Show in context For this purpose, EPS (e.g., Benzerara et al., 2006) and lipid biomarkers (e.g., Johnson et al., 2018) have been prime targets searched for in the lithified portion of microbialites.
View in article
Kawaguchi, T., Decho, A.W. (2002) In Situ Microspatial Imaging Using Two-Photon and Confocal Laser Scanning Microscopy of Bacteria and Extracellular Polymeric Secretions (EPS) Within Marine Stromatolites. Marine Biotechnology 4, 127–131. https://doi.org/10.1007/s10126-001-0073-7
Show in context While several studies have used confocal laser scanning microscopy (CLSM) to study luminescence in modern microbial mats and biofilms (e.g., Kawaguchi and Decho, 2002; Zippel and Neu, 2011; Rouillard et al., 2020), its application to the more lithified portions of stromatolites remains limited.
View in article
Lepot, K., Benzerara, K., Brown Jr, G.E., Philippot, P. (2008) Microbially influenced formation of 2,724-million-year-old stromatolites. Nature Geoscience 1, 118–121. https://doi.org/10.1111/gbi.12096
Show in context Luminescence spectroscopy offers a powerful, non-destructive method to probe biological molecules in mineral–microbe assemblages (Lepot et al., 2008).
View in article
Lepot, K., Compère, P., Gérard, E., Namsaraev, Z., Verleyen, E., Tavernier, I., et al. (2014) Organic and mineral imprints in fossil photosynthetic mats of an East Antarctic lake. Geobiology 12, 424–450. https://doi.org/10.1111/gbi.12096
Show in context Lepot et al. (2014) detected chlorophyll fluorescence in 160-year-old sediments but suggested that they may have underestimated preservation because of some pigment loss upon sample preparation.
View in article
Nelson, D.L., Cox, M.M. (2005) Lehninger Principles of Biochemistry. Fourth Edition, W.H. Freeman and Company, New York.
Show in context Consistently, carotenoids are known to be resistant to certain processes of degradation due to their antioxidant properties (Nelson and Cox, 2005).
View in article
Pirtle-Levy, R., Grebmeier, J.M., Cooper, L.W., Larsen, I.L. (2009) Chlorophyll a in Arctic sediments implies long persistence of algal pigments. Deep Sea Research Part II: Topical Studies in Oceanography 56, 1326–1338. https://doi.org/10.1016/j.dsr2.2008.10.022
Show in context Sun et al. (1991) showed that chlorophyll degrades very rapidly in sediments under oxic conditions, with a half-life of a few tens of days, whereas parameters such as anoxia may extend preservation for more than a few decades (Pirtle-Levy et al., 2009).
View in article
Roldán, M., Ascaso, C., Wierzchos, J. (2014) Fluorescent Fingerprints of Endolithic Phototrophic Cyanobacteria Living within Halite Rocks in the Atacama Desert. Applied and Environmental Microbiology 80, 2998–3006. https://doi.org/10.1128/AEM.03428-13
Show in context This process intensifies after cellular death (Schulze et al., 2011) and has been detected for a diversity of microorganisms such as algae, dinoflagellates, diatoms (Tang and Dobbs, 2007) and cyanobacteria (Roldán et al., 2014).
View in article
Rouillard, J., García-Ruiz, J.M., Kah, L., Gérard, E., Barrier, L., Nabhan, S., Gong, J., van Zuilen, M.A. (2020) Identifying microbial life in rocks: Insights from population morphometry. Geobiology 18, 282–305. https://doi.org/10.1111/gbi.12377
Show in context While several studies have used confocal laser scanning microscopy (CLSM) to study luminescence in modern microbial mats and biofilms (e.g., Kawaguchi and Decho, 2002; Zippel and Neu, 2011; Rouillard et al., 2020), its application to the more lithified portions of stromatolites remains limited.
View in article
Saint Martin, J.-P., Saint Martin, S. (2015) Discovery of calcareous microbialites in coastal ponds of western Sardinia (Italy). Geo-Eco-Marina 21, 35–53. https://journal.geoecomar.ro/geo-eco-marina/article/view/03_2015
Show in context These filaments have been interpreted as cyanobacteria entombed by calcite precipitation (Saint Martin and Saint Martin, 2015; Debrie et al., 2022).
View in article
Schulze, K., López, D.A., Tillich, U.M., Frohme, M. (2011) A simple viability analysis for unicellular cyanobacteria using a new autofluorescence assay, automated microscopy, and ImageJ. BMC Biotechnology 11, 118. https://doi.org/10.1186/1472-6750-11-118
Show in context This process intensifies after cellular death (Schulze et al., 2011) and has been detected for a diversity of microorganisms such as algae, dinoflagellates, diatoms (Tang and Dobbs, 2007) and cyanobacteria (Roldán et al., 2014).
View in article
Sinclair, M.B., Haaland, D.M., Timlin, J.A., Jones, H.D.T. (2006) Hyperspectral confocal microscope. Applied Optics 45, 6283–6291. https://doi.org/10.1364/AO.45.006283
Show in context Furthermore, although CLSM provides high resolution hyperspectral data (Sinclair et al., 2006), it is primarily used for qualitative imaging, with limited analysis of the spectral information it offers (Gérard et al., 2013, 2018; Stigliano et al., 2023).
View in article
Stigliano, L., Caumartin, J., Benzerara, K. (2023) Micro-and nanoscale techniques for studying biofilm-mineral interactions. In: Gurtler, V., Patrauchan, M. (Eds.) Biofilms. Academic Press, London, 143–192. https://doi.org/10.1016/bs.mim.2023.04.001
Show in context Furthermore, although CLSM provides high resolution hyperspectral data (Sinclair et al., 2006), it is primarily used for qualitative imaging, with limited analysis of the spectral information it offers (Gérard et al., 2013, 2018; Stigliano et al., 2023).
View in article
Sun, M., Aller, R.C., Lee, C. (1991) Early diagenesis of chlorophyll-a in Long Island Sound sediments: A measure of carbon flux and particle reworking. Journal of Marine Research 49, 379–401. https://doi.org/10.1357/002224091784995927
Show in context Sun et al. (1991) showed that chlorophyll degrades very rapidly in sediments under oxic conditions, with a half-life of a few tens of days, whereas parameters such as anoxia may extend preservation for more than a few decades (Pirtle-Levy et al., 2009).
View in article
Tahoun, M., Gee, C.T., McCoy, V.E., Sander, P.M., Müller, C.E. (2021) Chemistry of porphyrins in fossil plants and animals. RSC Advances 11, 7552–7563. https://doi.org/10.1039/D0RA10688G
Show in context Several studies have shown that chlorophyll-type pigments are frequently preserved with some structural modifications (Tahoun et al., 2021).
View in article
Tang, Y.Z., Dobbs, F.C. (2007) Green Autofluorescence in Dinoflagellates, Diatoms, and Other Microalgae and Its Implications for Vital Staining and Morphological Studies. Applied and Environmental Microbiology 73, 2306–2313. https://doi.org/10.1128/AEM.01741-06
Show in context Spectra were derived from the study by Tang and Dobbs (2007).
View in article
This process intensifies after cellular death (Schulze et al., 2011) and has been detected for a diversity of microorganisms such as algae, dinoflagellates, diatoms (Tang and Dobbs, 2007) and cyanobacteria (Roldán et al., 2014).
View in article
GAF emission spectra measured at different degradation stages show a major peak at a wavelength varying between 530 up and 550 nm together with a peak at 670 nm which becomes smaller in intensity at more advanced degradation (Tang and Dobbs, 2007).
View in article
Uveges, B.T., Teece, M.A., Fulton, J.M., Junium, C.K. (2018) Environmental controls on pigment distributions in the freshwater microbialites of Fayetteville Green Lake. Organic Geochemistry 125, 165–176. https://doi.org/10.1016/j.orggeochem.2018.08.012
Show in context They contain diverse organic molecules as remnants of the microorganisms that formed them, including lipids, proteins, carbohydrates, especially those composing extracellular polymeric substances (EPS), a variety of pigments and nucleic acids (Uveges et al., 2018).
View in article
Vermaas, W.F.J., Timlin, J.A., Jones, H.D.T., Sinclair, M.B., Nieman, L.T., Hamad, S.W., Melgaard, D.K., Haaland, D.M. (2008) In vivo hyperspectral confocal fluorescence imaging to determine pigment localization and distribution in cyanobacterial cells. Proceedings of the National Academy of Sciences 105, 4050–4055. https://doi.org/10.1073/pnas.0708090105
Show in context The broad emission bands with maxima at 530 and 560 nm observed for the two Mari Ermi components bear a striking resemblance with the emission spectra of carotenoid pigments (Fig. S-3) (Vermaas et al., 2008).
View in article
Villanueva, J., Grimalt, J.O., de Wit, R., Keely, B.J., Maxwell, J.R. (1994) Chlorophyll and carotenoid pigments in solar saltern microbial mats. Geochimica et Cosmochimica Acta 58, 4703–4715. https://doi.org/10.1016/0016-7037(94)90202-X
Show in context Other degradation mechanisms include grazing and partial hydrolysis by various enzymes, including chlorophyllases produced by diatoms (Villanueva et al., 1994).
View in article
Zippel, B., Neu, T.R. (2011) Characterization of Glycoconjugates of Extracellular Polymeric Substances in Tufa-Associated Biofilms by Using Fluorescence Lectin-Binding Analysis. Applied and Environmental Microbiology 77, 505–516. https://doi.org/10.1128/AEM.01660-10
Show in context While several studies have used confocal laser scanning microscopy (CLSM) to study luminescence in modern microbial mats and biofilms (e.g., Kawaguchi and Decho, 2002; Zippel and Neu, 2011; Rouillard et al., 2020), its application to the more lithified portions of stromatolites remains limited.
View in article
top
Supplementary Information
The Supplementary Information includes:
- Materials and Methods
- Figures S-1 to S-3
- Table S-1
- Supplementary Information References
Download the Supplementary Information (PDF)
Figures
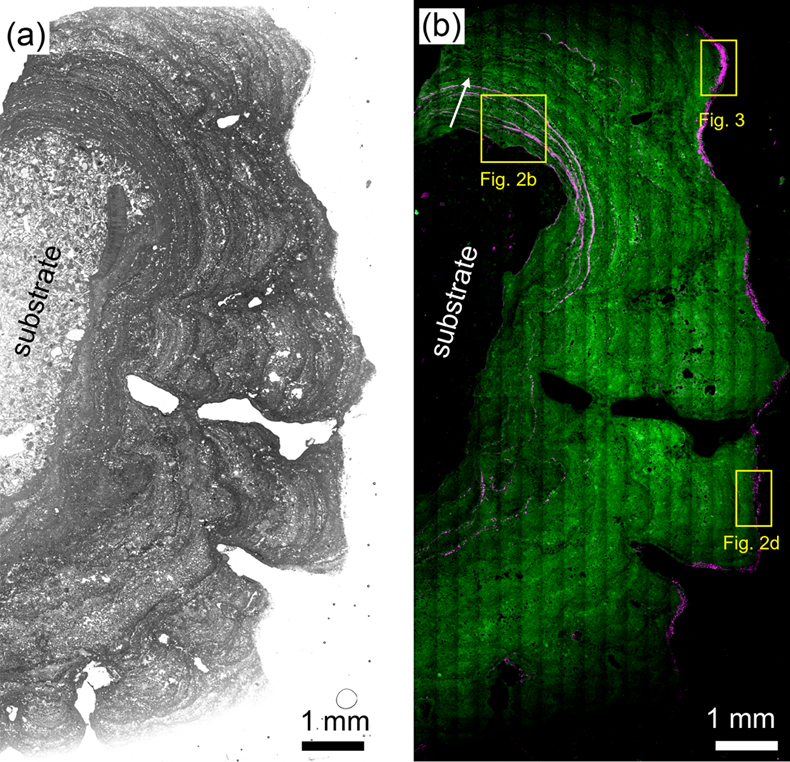
Figure 1 (a) Bright-field optical image showing the carbonate substrate (to the left), over which the stromatolite grows. (b) Composite epifluorescence mosaic of the same area as in (a). The white arrow indicates the stromatolitic growth direction. Holes are filled with resin. The mosaic is an overlay of one image (green fluorescence) obtained with the GFP filter (excitation, 450/50 nm; emission, 510/50 nm) and one image (magenta fluorescence) obtained with the CY5 filter (excitation, 640/30 nm; emission, 690/50 nm).
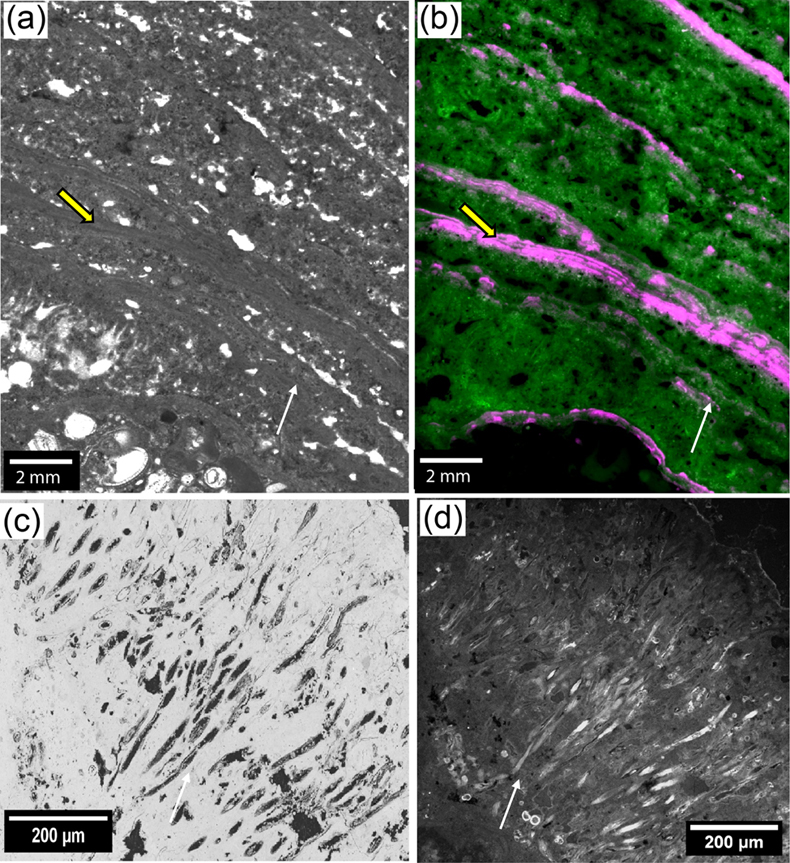
Figure 2 Distribution of the luminescence in a Mari Ermi stromatolite. The white arrows indicate the stromatolitic growth direction. (a) Bright field optical image showing some dark (e.g., yellow arrow) and bright, porous laminae. (b) Composite epifluorescence mosaic of the same area as shown in (a). Several dark laminae show a higher emission in the red compared with bright laminae. (c) Scanning electron microscopy image in the backscattered electron mode of an area located close to the stromatolite’s surface. Numerous filaments appear in black within a calcitic matrix (Debrie et al., 2022
Debrie, J., Prêt, D., Menguy, N., Estève, I., Sans-Jofre, P., Saint Martin, J.-P., Benzerara, K. (2022) Mapping mineralogical heterogeneities at the nm-scale by scanning electron microscopy in modern Sardinian stromatolites: Deciphering the origin of their laminations. Chemical Geology 609, 121059. https://doi.org/10.1016/j.chemgeo.2022.121059
) that appears in white. (d) CLSM image obtained in the same area as in (c), showing high fluorescence in the filaments. A collection of fluorescence images at different emission wavelengths (between 400 and 730 nm, every 10 nm) was obtained with simultaneous excitations at 405, 488 and 633 nm. This collection was transformed to one single image by sum intensity projection, where the emission values at all wavelengths are summed for each pixel. More details are provided in the Supplementary Information.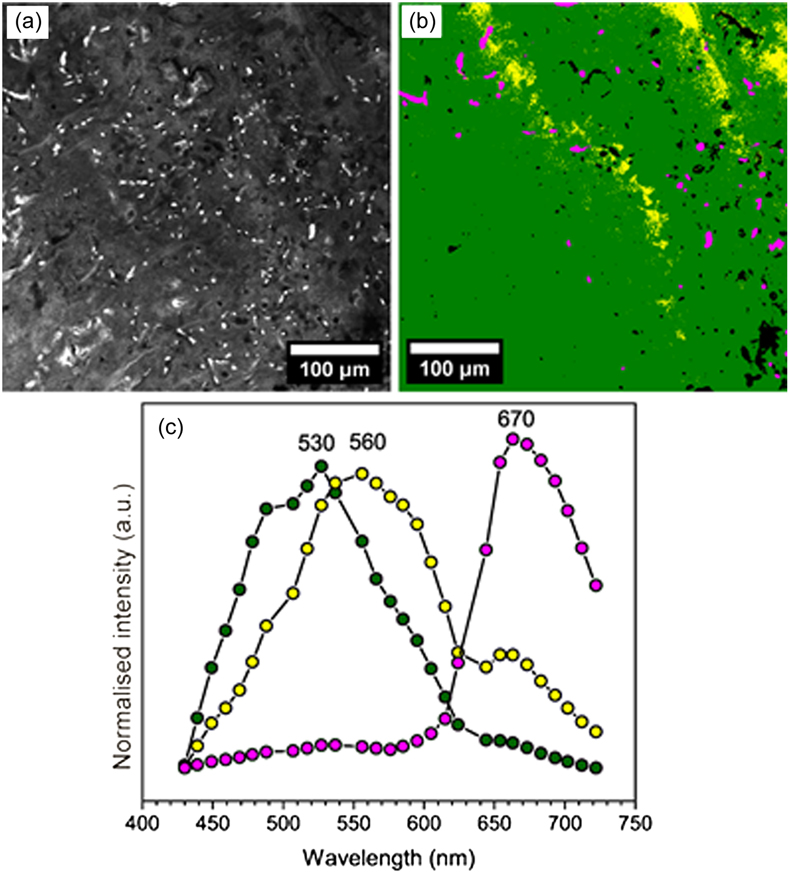
Figure 3 Spectral variations and distribution of the fluorescence. (a) Sum intensity projection of a CLSM stack acquired close to the surface of the stromatolite. (b) Map of the three main spectral components identified by segmentation of the hyperspectral image (Fig. S-1). The green, yellow and magenta areas relate to different spectral components. Black pixels correspond to micro-porosities filled with resin. (c) Average fluorescence emission spectra extracted from the pixels appearing in green, yellow and magenta in (b). The green, yellow and magenta spectra show maxima at 530, 560 and 670 nm, respectively.
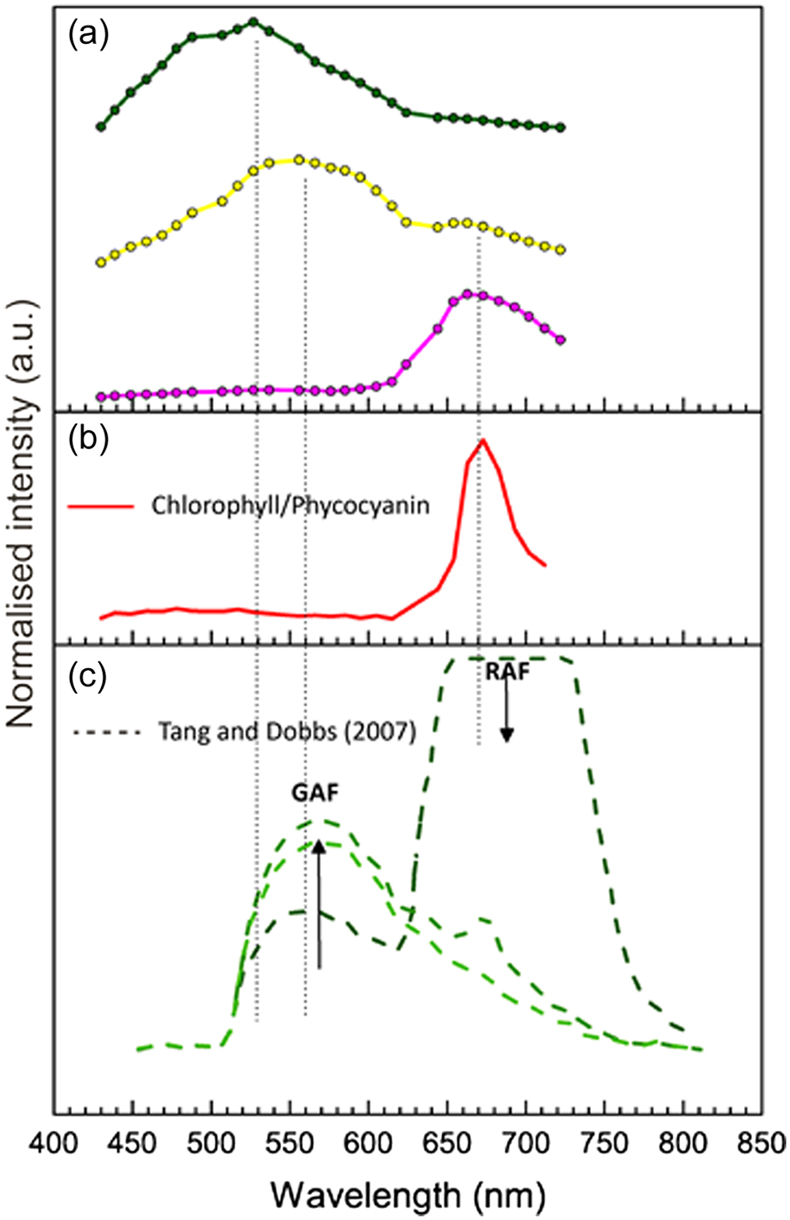
Figure 4 Spectral variations of luminescence in Sardinian stromatolites compared with some reference spectra. (a) Emission spectra of the three components identified in Mari Ermi stromatolites. (b) Fluorescence emission spectrum (405 – 488 – 633 nm laser excitation) of a chlorophyll/phycocyanin containing cell in the microbial mat covering Mari Ermi stromatolites. Fluorescence spectra of Mn in calcite and carotenoids are provided in the Supplementary Information. (c) Fluorescence emission spectra of variably degraded photosynthetic organisms. Spectra were derived from the study by Tang and Dobbs (2007)
Tang, Y.Z., Dobbs, F.C. (2007) Green Autofluorescence in Dinoflagellates, Diatoms, and Other Microalgae and Its Implications for Vital Staining and Morphological Studies. Applied and Environmental Microbiology 73, 2306–2313. https://doi.org/10.1128/AEM.01741-06
. The black arrows show changes in the relative intensity of green autofluorescence (GAF) and chlorophyll-induced red autofluorescence (RAF) with increasing degradation.