



Preservation of biosignatures in opal probed by infrared nanospectroscopy
Affiliations | Corresponding Author | Cite as | Funding information
Published by the European Association of Geochemistry
under Creative Commons License CC BY-NC-ND 4.0
Keywords: opal, organic matter, biosignature, AFM-IR, FTIR, fossilisation


- Share this article


-
Article views:1,806Cumulative count of HTML views and PDF downloads.
- Download Citation
- Rights & Permissions

top
Abstract

Figures
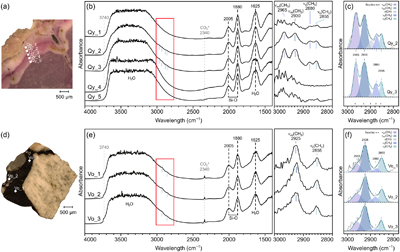 Figure 1 (a, d) Photographs of the samples: (a) Quincy pink opal sample showing a heterogeneous distribution of the pink colour with a vivid pink layer; (d) Volyn black opal sample comprising magmatic clasts cemented by homogeneous black opal. (b, e) FTIR spectra of the selected zones in the sample (left) with a focus on the region of vibrations of aliphatic CH bonds (right), for the pink opal (b) and the black opal (e). (c, f) Spectral decomposition of the OM signals: (c) Qy_2 and Qy_3 (pink opal), and (f) Vo_1, Vo_2 and Vo_3 (black opal). CO2* band is linked to atmospheric contamination. | 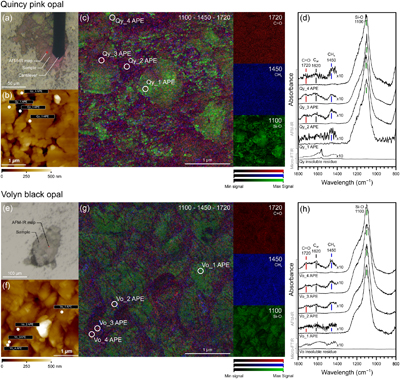 Figure 2 (a, e) Optical microscope photographs of the Quincy pink opal (a) and Volyn black opal (d) samples. The red square represents the studied zone. (b, f) 3 × 3 micron-sized AFM topographic maps of the studied zones in the Quincy pink opal (b) and Volyn Black opal (f). (c, g) 3 × 3 micron-sized AFM-IR maps combined for three wavelengths: 1100 (Si-O, green), 1450 (CHx, blue), and 1720 cm−1 (C=O, red) for the Quincy pink opal (c) and the Volyn black opal (g). The labelled white circles indicate the acquired high resolution spectra areas. (d, h) AFM-IR spectra in the 800–1800 cm−1 range for the Quincy pink opal (d) (Qy) and the Volyn black opal (h) (Vo). |  Figure 3 (a) 3 × 3 micron-sized AFM-IR map combined for two modes of CH2: νs (2860, dark blue), νas (2930, red) of the pink opal sample shown in Figure 2a. (b) 3 × 3 micron topographic map acquired by AFM. (c) AFM-IR spectra acquired in the 2800–3500 cm−1 range. | 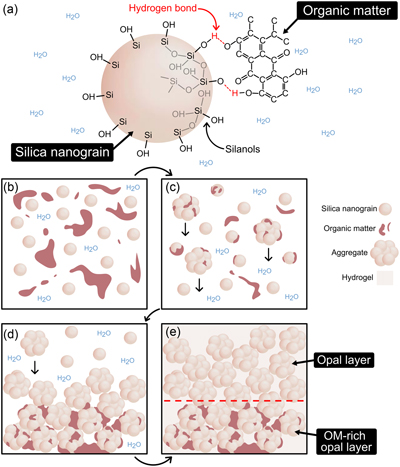 Figure 4 Conceptual model of the interaction between opal and OM during opal precipitation. |
| Figure 1 | Figure 2 | Figure 3 | Figure 4 |
top
Introduction
Opal (SiO2·nH2O) is an amorphous and porous mineral formed by the aqueous alteration of silicate rocks, through weathering and hydrothermal processes. Observations on Earth and Mars, along with fluid–rock alteration experiments, indicate that opal forms in various geological settings (e.g., alluvial fans and deltas, hot springs), at different spatial scales (up to several km large outcrops) and at the expense of silica minerals (Rodgers et al., 2004
Rodgers, K.A., Browne, P.R.L., Buddle, T.F., Cook, K.L., Greatrex, R.A., Hampton, W.A., Herdianita, N.R., Holland, G.R., Lynne, B.Y., Martin, R., Newton, Z., Pastars, D., Sannazarro, K.L., Teece, C.I.A. (2004) Silica phases in sinters and residues from geothermal fields of New Zealand. Earth-Science Reviews 66, 1–61. https://doi.org/10.1016/j.earscirev.2003.10.001
; Chauviré et al., 2017Chauviré, B., Rondeau, B., Mazzero, F., Ayalew, D. (2017) The Precious Opal Deposit At Wegel Tena, Ethiopia: Formation Via Successive Pedogenesis Events. The Canadian Mineralogist 55, 701–723. https://doi.org/10.3749/canmin.1700010
; Lowenstern et al., 2018Lowenstern, J.B., van Hinsberg, V., Berlo, K., Liesegang, M., Iacovino, K., Bindeman, I.N., Wright, H.M. (2018) Opal-A in Glassy Pumice, Acid Alteration, and the 1817 Phreatomagmatic Eruption at Kawah Ijen (Java), Indonesia. Frontiers in Earth Science 6, 11. https://doi.org/10.3389/feart.2018.00011
; Rutledge et al., 2018Rutledge, A.M., Horgan, B.H.N., Havig, J.R., Rampe, E.B., Scudder, N.A., Hamilton, T.L. (2018) Silica Dissolution and Precipitation in Glaciated Volcanic Environments and Implications for Mars. Geophysical Research Letters 45, 7371–7381. https://doi.org/10.1029/2018GL078105
; Jones, 2021Jones, B. (2021) Siliceous sinters in thermal spring systems: Review of their mineralogy, diagenesis, and fabrics. Sedimentary Geology 413, 105820. https://doi.org/10.1016/j.sedgeo.2020.105820
; Pan et al., 2021Pan, L., Carter, J., Quantin-Nataf, C., Pineau, M., Chauviré, B., Mangold, N., Le Deit, L., Rondeau, B., Chevrier, V. (2021) Voluminous Silica Precipitated from Martian Waters during Late-stage Aqueous Alteration. The Planetary Science Journal 2, 65. https://doi.org/10.3847/PSJ/abe541
). The conditions required for opal formation are characterised by low temperatures (0 to 200 °C) and near atmospheric pressure. Hence, opal is a ubiquitous indicator of past fluid–rock interaction at the subsurface of planetary bodies that have experienced liquid water. On Earth, these environments are also those that were favourable to the emergence and development of prebiotic and biotic chemistry leading to life.On Earth’s surface, opal precipitation processes prove to be able to fossilise and entrap numerous biological remnants, e.g., wood, vertebrate skeletons, arthropods, various microfossils as well as organic matter (OM) (Banerjee and Wenzel, 1999
Banerjee, A., Wenzel, T. (1999) Black opal from Honduras. European Journal of Mineralogy 11, 401–408. https://doi.org/10.1127/ejm/11/2/0401
; Bell et al., 2019Bell, P.R., Fanti, F., Hart, L.J., Milan, L.A., Craven, S.J., Birch, S.A., Smith, E. (2019) Revised geology, age, and vertebrate diversity of the dinosaur-bearing Griman Creek Formation (Cenomanian), Lightning Ridge, New South Wales, Australia. Palaeogeography, Palaeoclimatology, Palaeoecology 514, 655–671. https://doi.org/10.1016/j.palaeo.2018.11.020
; Herrmann et al., 2019Herrmann, J.R., Maas, R., Rey, P.F., Best, S.P. (2019) The nature and origin of pigments in black opal from Lightning Ridge, New South Wales, Australia. Australian Journal of Earth Sciences 66, 1027–1039. https://doi.org/10.1080/08120099.2019.1587643
; Chauviré et al., 2020Chauviré, B., Houadria, M., Donini, A., Berger, B.T., Rondeau, B., Kritsky, G., Lhuissier, P. (2020) Arthropod entombment in weathering-formed opal: new horizons for recording life in rocks. Scientific Reports 10, 10575. https://doi.org/10.1038/s41598-020-67412-9
; Mustoe, 2023Mustoe, G.E. (2023) Silicification of Wood: An Overview. Minerals 13, 206. https://doi.org/10.3390/min13020206
). Moreover, opal appears to be able to preserve these biogenic traces with a high level of chemical preservation over geological time scale, as demonstrated by some of the most ancient microfossils found in the 3400–3500 Myr old cherts (originally opal) of the Pilbara Craton in Australia (Djokic et al., 2017Djokic, T., Van Kranendonk, M.J., Campbell, K.A., Walter, M.R., Ward, C.R. (2017) Earliest signs of life on land preserved in ca. 3.5 Ga hot spring deposits. Nature Communications 8, 15263. https://doi.org/10.1038/ncomms15263
; Alleon et al., 2018Alleon, J., Bernard, S., Le Guillou, C., Beyssac, O., Sugitani, K., Robert, F. (2018) Chemical nature of the 3.4 Ga Strelley Pool microfossils. Geochemical Perspectives Letters 7, 37–42. https://doi.org/10.7185/geochemlet.1817
). Furthermore, Alleon et al. (2016)Alleon, J., Bernard, S., Le Guillou, C., Marin-Carbonne, J., Pont, S., Beyssac, O., McKeegan, K.D., Robert, F. (2016) Molecular preservation of 1.88 Ga Gunflint organic microfossils as a function of temperature and mineralogy. Nature Communications 7, 11977. https://doi.org/10.1038/ncomms11977
showed that early entombment of microorganisms in opal significantly limits their molecular degradation during diagenesis. By preserving these traces, opal opens windows onto Earth’s biosphere through the ages, enabling constraints to be placed on various palaeoenvironments and their evolutionary trajectories. However, among all the entrapped remnants, OM seems to be preserved and/or detected only in very rare cases (Alleon et al., 2016Alleon, J., Bernard, S., Le Guillou, C., Marin-Carbonne, J., Pont, S., Beyssac, O., McKeegan, K.D., Robert, F. (2016) Molecular preservation of 1.88 Ga Gunflint organic microfossils as a function of temperature and mineralogy. Nature Communications 7, 11977. https://doi.org/10.1038/ncomms11977
; Sánchez-García et al., 2020Sánchez-García, L., Carrizo, D., Molina, A., Muñoz-Iglesias, V., Lezcano, M.Á., Fernández-Sampedro, M., Parro, V., Prieto-Ballesteros, O. (2020) Fingerprinting molecular and isotopic biosignatures on different hydrothermal scenarios of Iceland, an acidic and sulfur-rich Mars analog. Scientific Reports 10, 21196. https://doi.org/10.1038/s41598-020-78240-2
; Teece et al., 2020Teece, B.L., George, S.C., Djokic, T., Campbell, K.A., Ruff, S.W., Van Kranendonk, M.J. (2020) Biomolecules from Fossilized Hot Spring Sinters: Implications for the Search for Life on Mars. Astrobiology 20, 537–551. https://doi.org/10.1089/ast.2018.2018
; Mustoe, 2023Mustoe, G.E. (2023) Silicification of Wood: An Overview. Minerals 13, 206. https://doi.org/10.3390/min13020206
), and when it is found, its biogenicity is often questioned due to its degraded state (Brasier et al., 2002Brasier, M.D., Green, O.R., Jephcoat, A.P., Kleppe, A.K., Van Kranendonk, M.J., Lindsay, J.F., Steele, A., Grassineau, N.V. (2002) Questioning the evidence for Earth’s oldest fossils. Nature 416, 76–81. https://doi.org/10.1038/416076a
; van Zuilen et al., 2002van Zuilen, M.A., Lepland, A., Arrhenius, G. (2002) Reassessing the evidence for the earliest traces of life. Nature 418, 627–630. https://doi.org/10.1038/nature00934
). Nowadays, the limited understanding of the entrapment and preservation mechanisms of OM by silica in nature therefore prevents a comprehensive interpretation of these potential earliest life signatures.Nanospectroscopy has already been proved to efficiently characterise and map OM inside biominerals (O’Callahan et al., 2023
O’Callahan, B.T., Larsen, A., Leichty, S., Cliff, J., Gagnon, A.C., Raschke, M.B. (2023) Correlative chemical and elemental nano-imaging of morphology and disorder at the nacre-prismatic region interface in Pinctada margaritifera. Scientific Reports 13, 21258. https://doi.org/10.1038/s41598-023-47446-5
). This helps better interpret biosignatures inside ancient OM-containing rocks (Wang et al., 2022Wang, M., Li, M., Li, J.-B., Xu, L., Zhang, J.-X. (2022) The key parameter of shale oil resource evaluation: Oil content. Petroleum Science 19, 1443–1459. https://doi.org/10.1016/j.petsci.2022.03.006
). Here, we utilised Fourier transform infrared spectroscopy (FTIR) and infrared nanospectroscopy (AFM-IR) to conduct spatially resolved investigations of the OM trapped in opal from the macroscale to the submicrometre scale in order to both reveal the localisation of OM in the opal matrix and to gather information about its nature using contamination-free preparation. Moreover, both high resolution and non-destructive techniques are employed, which may prove to be useful for the geochemistry field.To do this, we selected abiotic opals without any clear signs of fossilised organisms, but in which biogenic OM was suspected to be entrapped and proved to be widespread in their close environment: pink opals from Quincy, France, coloured by quinones (found in 35 Myr-old lacustrine sediments); and black opal from Volyn, Ukraine, coloured by carbohydrates (found in 1700 to 550 Myr-old magmatic rocks) (refer to Supplementary Information). These two opal samples found in distinct environments are of strategic importance as: 1) the presence of OM within them indicates a general trend to an interaction between OM and silica regardless of their environmental conditions (e.g., pH, chemistry of the surrounding rocks) and without biotic/microorganism actions; 2) their contrasting ages suggest an entrapment and potential preservation process occurring throughout geological periods, thus offering a valuable opportunity for reconstruction of early palaeoenvironments or the search for traces of life on other planetary bodies, such as Mars.
top
Materials and Methods
For FTIR analysis, we prepared 200 μm doubly polished thick sections of the samples, using only ultrapure water to avoid organic contamination. For μFTIR and AFM-IR, a small amount of the most intensely coloured part of both samples was powdered in an agate mortar. The most coloured grains were then selected and tightly pressed between two diamond windows to reduce surface rugosity. The insoluble residue was then extracted by the HF-HCl method from the remaining powder for analysis of the organic residue using μFTIR.
FTIR analyses were performed using a Thermo-Nicolet FTIR 5700 spectrometer coupled to a Thermo-Nicolet Continuum microscope with a 200 × 200 μm beam at LPG (Nantes, France). μFTIR spectra were collected on a Bruker Vertex 70 coupled with a Hyperion 3000 microscope at IPAG (Grenoble, France). CHNS elemental analyses were carried out using a Thermo Finnigan EA1112 at Spectropole (Marseille, France) on rough, unprepared samples. IR absorption spectra and maps (3 × 3 μm) were collected using a Bruker nanoIR3sTM equipped with two independent laser sources covering different IR ranges: APE (600–2000 cm−1) and FireFly (3800–2700 cm−1) (see Supplementary Information). This instrument includes an AFM for acquiring topographical images at IPAG (Grenoble). As AFM-IR maps are not hyperspectral maps, additional representative spectra were acquired for the entire spectral range of the laser source in the various zones of interest. The most representative FTIR and AFM-IR spectra were decomposed using OriginPro8 to infer the nature of the OM in the samples. Additional information on techniques and decomposition parameters are provided in the Supplementary Information.
top
Results
The CHNS elemental analysis revealed the presence of carbon in both opals. The carbon content of Volyn black opal is 1.6 ± 0.2 wt. %. In Quincy pink opal, the carbon is above the limit of detection (Fig. S-4), but the measured content (0.2 wt. %) is within the instrument’s error (Table S-3).
The FTIR results on opal sections confirmed the presence of OM, evidenced by a weak but significant signal of aliphatic C-H bonds in the 2800–3000 cm−1 range (Fig. 1) as shoulders on the large H2O bands (2800–3700 cm−1), typical for opal. In the Quincy pink opal spectra (Qy), the intensity of the pink colour correlates with the intensity of four distinct peaks around 2855, 2880, 2930 and 2965 cm−1 (Fig. 1, Qy_2 and Qy_3), representing the stretching vibration of νs(CH2), νs(CH3), νas(CH2), and νas(CH3), respectively (Clark et al., 2009
Clark, R.N., Curchin, J.M., Hoefen, T.M., Swayze, G.A. (2009) Reflectance spectroscopy of organic compounds: 1. Alkanes. Journal of Geophysical Research: Planets 114, E03001. https://doi.org/10.1029/2008JE003150
). Conversely, the Volyn black opal spectra (Vo) exhibit mainly two well defined peaks around 2855 and 2925 cm−1, characteristic of νs(CH2) and νas(CH2), respectively (Clark et al., 2009Clark, R.N., Curchin, J.M., Hoefen, T.M., Swayze, G.A. (2009) Reflectance spectroscopy of organic compounds: 1. Alkanes. Journal of Geophysical Research: Planets 114, E03001. https://doi.org/10.1029/2008JE003150
), with CH3 contributions limited to shoulders, as shown by spectral decomposition (Fig. 1f). These signatures are consistently present in all Volyn sample spectra with a similar intensity, indicating a diffuse and homogeneous distribution of OM throughout the sample at the millimetre scale. As the signal-to-noise ratio of all the spectra decreased due to total absorption of water in the 3050–3700 cm−1 region, any further organic peak component (e.g., aromatic C-H band), cannot be identified with certainty. The distinct organic signatures in the two opals, highlighted by the varying band intensities in their spectra, suggest differences in the nature of the OM (Fig. 1) and discard contamination. The CH2/CH3 ratios from the decomposition range from 1.9 to 3 for Volyn black opal and from 0.9 to 1.5 for Quincy pink opal (Table S-1). According to Lin and Ritz’s (1993)Lin, R., Ritz, G.P. (1993) Studying individual macerals using i.r. microspectroscopy, and implications on oil versus gas/condensate proneness and “low-rank” generation. Organic Geochemistry 20, 695–706. https://doi.org/10.1016/0146-6380(93)90055-G
simplified n-alkane model, Quincy opal’s OM corresponds to chain lengths of 5–8 carbons, while the Volyn opal’s OM points to chains longer than 10 carbons (Marshall et al., 2005Marshall, C.P., Javaux, E.J., Knoll, A.H., Walter, M.R. (2005) Combined micro-Fourier transform infrared (FTIR) spectroscopy and micro-Raman spectroscopy of Proterozoic acritarchs: A new approach to Palaeobiology. Precambrian Research 138, 208–224. https://doi.org/10.1016/j.precamres.2005.05.006
). However, the absence of other OM peaks in the spectra (e.g., carbonyl at 1700 cm−1, aromatic carbon at 1600 cm−1 and CH2 bending at 1450 cm−1) indicates the limited sensitivity of FTIR analysis due to the: (1) low quantity of OM in these samples; (2) the impact on these OM bands by the overabundance of silica and water. To overcome this limitation, we undertook AFM-IR analyses.Figure 1 (a, d) Photographs of the samples: (a) Quincy pink opal sample showing a heterogeneous distribution of the pink colour with a vivid pink layer; (d) Volyn black opal sample comprising magmatic clasts cemented by homogeneous black opal. (b, e) FTIR spectra of the selected zones in the sample (left) with a focus on the region of vibrations of aliphatic CH bonds (right), for the pink opal (b) and the black opal (e). (c, f) Spectral decomposition of the OM signals: (c) Qy_2 and Qy_3 (pink opal), and (f) Vo_1, Vo_2 and Vo_3 (black opal). CO2* band is linked to atmospheric contamination.
We produced maps and combined them for three wavenumbers: 1100 (Si-O), 1450 (CHx) and 1720 cm−1 (C=O) (Fig. 2). Both opals exhibit a porous structure comprising micrometre-sized silica grain aggregates. The band at 1100 cm−1 of silica matrix is heterogeneously distributed and spectra one (Qy_1 and Vo_1) refers to the silica matrix dominated phase.
Figure 2 (a, e) Optical microscope photographs of the Quincy pink opal (a) and Volyn black opal (d) samples. The red square represents the studied zone. (b, f) 3 × 3 micron-sized AFM topographic maps of the studied zones in the Quincy pink opal (b) and Volyn Black opal (f). (c, g) 3 × 3 micron-sized AFM-IR maps combined for three wavelengths: 1100 (Si-O, green), 1450 (CHx, blue), and 1720 cm−1 (C=O, red) for the Quincy pink opal (c) and the Volyn black opal (g). The labelled white circles indicate the acquired high resolution spectra areas. (d, h) AFM-IR spectra in the 800–1800 cm−1 range for the Quincy pink opal (d) (Qy) and the Volyn black opal (h) (Vo).
Both opals’ AFM-IR spectra reveal the presence of three weak bands located around 1450, 1620, and 1720 cm−1. These band positions and their relative intensity are found to correlate with OM bonds, identified on mature coal by Phan et al. (2023)
Phan, V.T.H., Rebois, R., Beck, P., Quirico, E., Noguchi, T., Takase, M. (2023) Chemical functional characterization of immature and mature coals at the nanoscale by atomic force microscopy-based infrared spectroscopy (AFM-IR). International Journal of Coal Geology 267, 104196. https://doi.org/10.1016/j.coal.2023.104196
also using AFM-IR, and are present in the insoluble residue spectra of each sample (Fig. 2). Given that H2O constitutes the second main component of opals, the 1620 cm−1 may also arise from it. However, the intensity of these three bands evolves concomitantly and independently from the 1100 cm−1 Si-O band, indicating a decorrelation from the opal structure.Hence, we propose that all three of these bands are ascribable to OM in the two samples. We ascribe them to the bending of CHx (1450 cm−1), the stretching vibration of C=C of aromatics (Car, 1620 cm−1), and the stretching of C=O of carbonyls (CO, 1720 cm−1) (Colthup, 1950
Colthup, N.B. (1950) Spectra-Structure Correlations in the Infra-Red Region. Journal of the Optical Society of America 40, 397–400. https://doi.org/10.1364/JOSA.40.000397
). The distribution of the 1450 and 1720 cm−1 signals in the AFM-IR maps indicates that OM is primarily located between the silica grains in the two opals.The intensity of these three bands is directly proportional to the abundance of functional groups in the OM in the samples (Marshall et al., 2005
Marshall, C.P., Javaux, E.J., Knoll, A.H., Walter, M.R. (2005) Combined micro-Fourier transform infrared (FTIR) spectroscopy and micro-Raman spectroscopy of Proterozoic acritarchs: A new approach to Palaeobiology. Precambrian Research 138, 208–224. https://doi.org/10.1016/j.precamres.2005.05.006
). Therefore, the CO/Car band intensity ratio reflects their relative abundance in OM composition. Spectral decomposition (Fig. S-3) shows a CO/Car ratio of 0.5 for the OM in Quincy opal and 1.2 in Volyn opal, suggesting more CO groups in Volyn opal and more Car groups in Quincy opal (Table S-2).The insoluble residues of the two opals reveal spectral contributions of OM (Fig. 2). However, the extraction may have altered the OM, leading to incomplete information. μFTIR spectra of extracted residues (Fig. 2) differ from untreated samples. Quincy pink opal residue displays a sharp peak at ∼1580 cm−1 with a shoulder at ∼1600 cm−1, along with weak bands near 1420 and 1750 cm−1. The Volyn black opal residue shows broad bands near 1750, 1580, and 1420 cm−1, with shape, position and intensity closely matching those observed with AFM-IR. Hence, AFM-IR on bulk untreated sample appears to be more relevant overall for analysing the signature of OM in opals.
Further AFM-IR analyses were conducted in the organic’s region between 2800 and 3000 cm−1 to supplement the FTIR analysis. This was only carried out on the Quincy opal sample. As Si-O does not produce a signal in this region, we compared the IR maps to an AFM topography image of the investigated area (Fig. 3). The size of the observed objects on both topography and AFM-IR maps (Fig. 3b, c) is similar to those observed in Figure 2 and mapped with the Si-O wavelength (1100 cm−1). Some spectra exhibit two main bands located at approximately 2860 cm−1 with a shoulder at 2880 cm−1, and around 2930 cm−1 with a shoulder at 2960 cm−1 (Fig. 3c). These positions match those observed in FTIR and correspond to vibration of CH2 and CH3 symmetric and asymmetric modes.
Figure 3 (a) 3 × 3 micron-sized AFM-IR map combined for two modes of CH2: νs (2860, dark blue), νas (2930, red) of the pink opal sample shown in Figure 2a. (b) 3 × 3 micron topographic map acquired by AFM. (c) AFM-IR spectra acquired in the 2800–3500 cm−1 range.
Depending on the spectrum’s location, the relative contributions of the bands vary in intensity, but the asymmetrical stretching remains overall more intense than the symmetrical ones. To study the spatial distribution of OM, a map was produced by combining the data from two modes of CH2 (Fig. 3).
The organic signatures for the symmetric νs (2860 cm−1) and asymmetric νas (2930 cm−1) stretching of CH2 are predominantly located within the low to medium height regions on the topographic image, corresponding to pores (Fig. 3b). The map reveals a bimodal distribution with a periphery of νas(CH2), indicated by the red corona (2930 cm−1), and a centre consisting of a mixture of both νs(CH2) and νas(CH2), indicated by the bluish-purple colour (combined 2860 and 2930 cm−1). This effect is attributed to the relative intensity of the signals. When OM is scarce, the νs(CH2) band becomes too weak to detect, while the more intense νas(CH2) band remains visible, leading to a red shift (Fig. S-3). Consequently, these two modes show the differences in the distribution of OM in the pores: asymmetric stretch shows the OM-filled pore edges (thinner OM) and symmetric stretch the interior (thicker OM), suggesting a somewhat OM lenticular morphology. Moreover, this reveals a heterogeneous distribution of OM at the submicrometre scale.
top
Discussion and Conclusions
OM identification. Our results on two opal samples, one magmatic (Volyn black opal) and one sedimentary (Quincy pink opal), confirm the presence of OM in their structure. FTIR analysis revealed organic signatures through several bands between 2800 and 3000 cm−1 characteristics of symmetric and asymmetric stretching vibrations of CH2 and CH3. The precise AFM-IR analysis of the sample surface at the submicrometre scale provides access to the potential signature of OM in the region where, in classic FTIR, the spectra are dominated by the contribution of the opal matrix (Si-O, H2O). The spectra show three discreet bands located around 1450 cm−1 of the bending vibration of CHx (overlapping with H2O bending vibration), 1620 cm−1 of the stretching vibration of Car, and 1720 cm−1 of the stretching of CO. Based on spectral decomposition, the OM in Volyn opal shows more CO groups (CO/Car of 0.9), longer, less branched aliphatic structures, and larger n-alkane chains (>10 carbons) compared to the OM in Quincy opal. These findings support the hypothesis of Franz et al. (2022)
Franz, G., Lyckberg, P., Khomenko, V., Chournousenko, V., Schulz, H.-M., Mahlstedt, N., Wirth, R., Glodny, J., Gernert, U., Nissen, J. (2022) Fossilization of Precambrian microfossils in the Volyn pegmatite, Ukraine. Biogeosciences 19, 1795–1811. https://doi.org/10.5194/bg-19-1795-2022
regarding carbohydrate-type molecules in Volyn opal. In Quincy opal, the n-alkane chains (5–8 carbons), the CH2/CH3 ratio, and abundant Car bonds corroborate the polycyclic, branched molecules (peri-xanthenoxanthene), thought to cause its pink colour (Prowse et al., 1991Prowse, W.G., Arnot, K.I., Recka, J.A., Thomson, R.H., Maxwell, J.R. (1991) The quincyte pigments: Fossil quinones in an eocene clay mineral. Tetrahedron 47, 1095–1108. https://doi.org/10.1016/S0040-4020(01)80947-9
).OM entrapment. The maps in both samples (Figs. 2 and 3) show that OM is preferentially located in the micro- to nano-closed porosity. This spatial distribution suggests that OM was trapped during the formation and deposition of the opal, rather than during a later event. This implies a strong geochemical affinity between OM and silica in solution, which is consistent with the strong ability of polysilicic acids to bond with OM through their hydroxyl groups in solution (Iler, 1978
Iler, R.K. (1978) Hydrogen-Bonded Complexes of Silica with Organic Compounds. In: Bendz, G., Lindqvist, I., Runnström-Reio, V. (Eds.) Biochemistry of Silicon and Related Problems. Springer, Boston, 53–76. https://doi.org/10.1007/978-1-4613-4018-8_2
). These labile bonds are formed both by the SiOH groups of the polysilicic acid in solution and with those on the surface of silica particles (nanograins and aggregated structures) (Iler, 1979Iler, R.K. (1979) The Chemistry of Silica: Solubility, Polymerization, Colloid and Surface Properties and Biochemistry of Silica. Wiley, New York.
). Moreover, these types of bonds are considered a preliminary step in the petrifaction process of wood (e.g., templating) (Leo and Barghoorn, 1976Leo, R.F., Barghoorn, E.S. (1976) Silicification of Wood. Botanical Museum Leaflets, Harvard University 25, 1–47. https://doi.org/10.5962/p.295209
; Mustoe, 2023Mustoe, G.E. (2023) Silicification of Wood: An Overview. Minerals 13, 206. https://doi.org/10.3390/min13020206
). The organic molecules composing the cell walls (e.g., lignin, cellulose) are rich in OH-functional groups that are capable of binding with silicic acid. Additionally, long-term preservation of OM-silica bonds is more probable in the amorphous structure of opal, where nanoporosity is often large and Si-OH terminations are abundant, than in cryptocrystalline quartz (chalcedony), where Si-O-Si bonds dominate the structure.The infrared signatures of the OM acquired in situ in the black Volyn opal and in the insoluble residue are quite similar. This may suggest either that the organic molecules trapped in Volyn opal were dominated by insoluble molecules, which have been preserved over time, or that the long residence time of this opal did not protect against soluble OM alteration by geologic fluids. By contrast, the infrared signatures of the OM acquired in situ in the Quincy pink opal and in the insoluble residue differ significantly. This indicates that the OM at Quincy is mainly soluble and has been protected by the silica matrix over the 35 Ma.
These results and interpretations, although based on a limited amount of pioneer data and hence possibly somehow conjectural, lead us to propose a mechanism of OM incorporation during opal formation feasibly involving two combining steps (Fig. 4): 1) The precipitation of silica into opal may act as a segregator of OM in fluids by hydrogen bonding, the surface of dispersed silica nanograins in fluids providing an abundant source of -OH to which OM can bond; 2) The mechanical deposition of these nanograins covered by OM may act as a local accumulator of OM.
Figure 4 Conceptual model of the interaction between opal and OM during opal precipitation.
Finally, the ability of opal to preserve OM over a long period of time on Earth, as shown by the estimated age of the Volyn black opal (550 to 1700 Myr), makes it a promising mineral phase for the search for ancient biosignatures on other rocky bodies, such as Mars.
top
Acknowledgements
We extend our warmest thanks to the anonymous reviewers and editor Satish Myneni, who particularly helped to consolidate this paper. Moreover, we thank Laurent Lenta (Laboratoire de Planétologie et Géosciences, Nantes) for his help in sample preparation as well as Maxime Pineau (Laboratoire de géologie de Lyon: Terre, planètes, environnement, Lyon) and Elisabeth Lapp (Institut de Chimie de la Matière Condensée de Bordeaux, Bordeaux) for their general support of the project.
Editor: Satish Myneni
top
References
Alleon, J., Bernard, S., Le Guillou, C., Marin-Carbonne, J., Pont, S., Beyssac, O., McKeegan, K.D., Robert, F. (2016) Molecular preservation of 1.88 Ga Gunflint organic microfossils as a function of temperature and mineralogy. Nature Communications 7, 11977. https://doi.org/10.1038/ncomms11977
 Show in context
 Furthermore, Alleon et al. (2016) showed that early entombment of microorganisms in opal significantly limits their molecular degradation during diagenesis.
View in article
However, among all the entrapped remnants, OM seems to be preserved and/or detected only in very rare cases (Alleon et al., 2016; Sánchez-García et al., 2020; Teece et al., 2020; Mustoe, 2023), and when it is found, its biogenicity is often questioned due to its degraded state (Brasier et al., 2002; van Zuilen et al., 2002).
View in article
Alleon, J., Bernard, S., Le Guillou, C., Beyssac, O., Sugitani, K., Robert, F. (2018) Chemical nature of the 3.4 Ga Strelley Pool microfossils. Geochemical Perspectives Letters 7, 37–42. https://doi.org/10.7185/geochemlet.1817
Show in context Moreover, opal appears to be able to preserve these biogenic traces with a high level of chemical preservation over geological time scale, as demonstrated by some of the most ancient microfossils found in the 3400–3500 Myr old cherts (originally opal) of the Pilbara Craton in Australia (Djokic et al., 2017; Alleon et al., 2018).
View in article
Banerjee, A., Wenzel, T. (1999) Black opal from Honduras. European Journal of Mineralogy 11, 401–408. https://doi.org/10.1127/ejm/11/2/0401
Show in context On Earth’s surface, opal precipitation processes prove to be able to fossilise and entrap numerous biological remnants, e.g., wood, vertebrate skeletons, arthropods, various microfossils as well as organic matter (OM) (Banerjee and Wenzel, 1999; Bell et al., 2019; Herrmann et al., 2019; Chauviré et al., 2020; Mustoe, 2023).
View in article
Bell, P.R., Fanti, F., Hart, L.J., Milan, L.A., Craven, S.J., Birch, S.A., Smith, E. (2019) Revised geology, age, and vertebrate diversity of the dinosaur-bearing Griman Creek Formation (Cenomanian), Lightning Ridge, New South Wales, Australia. Palaeogeography, Palaeoclimatology, Palaeoecology 514, 655–671. https://doi.org/10.1016/j.palaeo.2018.11.020
Show in context On Earth’s surface, opal precipitation processes prove to be able to fossilise and entrap numerous biological remnants, e.g., wood, vertebrate skeletons, arthropods, various microfossils as well as organic matter (OM) (Banerjee and Wenzel, 1999; Bell et al., 2019; Herrmann et al., 2019; Chauviré et al., 2020; Mustoe, 2023).
View in article
Brasier, M.D., Green, O.R., Jephcoat, A.P., Kleppe, A.K., Van Kranendonk, M.J., Lindsay, J.F., Steele, A., Grassineau, N.V. (2002) Questioning the evidence for Earth’s oldest fossils. Nature 416, 76–81. https://doi.org/10.1038/416076a
Show in context However, among all the entrapped remnants, OM seems to be preserved and/or detected only in very rare cases (Alleon et al., 2016; Sánchez-García et al., 2020; Teece et al., 2020; Mustoe, 2023), and when it is found, its biogenicity is often questioned due to its degraded state (Brasier et al., 2002; van Zuilen et al., 2002).
View in article
Chauviré, B., Rondeau, B., Mazzero, F., Ayalew, D. (2017) The Precious Opal Deposit At Wegel Tena, Ethiopia: Formation Via Successive Pedogenesis Events. The Canadian Mineralogist 55, 701–723. https://doi.org/10.3749/canmin.1700010
Show in context Observations on Earth and Mars, along with fluid–rock alteration experiments, indicate that opal forms in various geological settings (e.g., alluvial fans and deltas, hot springs), at different spatial scales (up to several km large outcrops) and at the expense of silica minerals (Rodgers et al., 2004; Chauviré et al., 2017; Lowenstern et al., 2018; Rutledge et al., 2018; Jones, 2021; Pan et al., 2021).
View in article
Chauviré, B., Houadria, M., Donini, A., Berger, B.T., Rondeau, B., Kritsky, G., Lhuissier, P. (2020) Arthropod entombment in weathering-formed opal: new horizons for recording life in rocks. Scientific Reports 10, 10575. https://doi.org/10.1038/s41598-020-67412-9
Show in context On Earth’s surface, opal precipitation processes prove to be able to fossilise and entrap numerous biological remnants, e.g., wood, vertebrate skeletons, arthropods, various microfossils as well as organic matter (OM) (Banerjee and Wenzel, 1999; Bell et al., 2019; Herrmann et al., 2019; Chauviré et al., 2020; Mustoe, 2023).
View in article
Clark, R.N., Curchin, J.M., Hoefen, T.M., Swayze, G.A. (2009) Reflectance spectroscopy of organic compounds: 1. Alkanes. Journal of Geophysical Research: Planets 114, E03001. https://doi.org/10.1029/2008JE003150
Show in context In the Quincy pink opal spectra (Qy), the intensity of the pink colour correlates with the intensity of four distinct peaks around 2855, 2880, 2930 and 2965 cm−1 (Fig. 1, Qy_2 and Qy_3), representing the stretching vibration of νs(CH2), νs(CH3), νas(CH2), and νas(CH3), respectively (Clark et al., 2009).
View in article
Conversely, the Volyn black opal spectra (Vo) exhibit mainly two well defined peaks around 2855 and 2925 cm−1, characteristic of νs(CH2) and νas(CH2), respectively (Clark et al., 2009), with CH3 contributions limited to shoulders, as shown by spectral decomposition (Fig. 1f).
View in article
Colthup, N.B. (1950) Spectra-Structure Correlations in the Infra-Red Region. Journal of the Optical Society of America 40, 397–400. https://doi.org/10.1364/JOSA.40.000397
Show in context We ascribe them to the bending of CH x (1450 cm−1), the stretching vibration of C=C of aromatics (Car, 1620 cm−1), and the stretching of C=O of carbonyls (CO, 1720 cm−1) (Colthup, 1950).
View in article
Djokic, T., Van Kranendonk, M.J., Campbell, K.A., Walter, M.R., Ward, C.R. (2017) Earliest signs of life on land preserved in ca. 3.5 Ga hot spring deposits. Nature Communications 8, 15263. https://doi.org/10.1038/ncomms15263
Show in context Moreover, opal appears to be able to preserve these biogenic traces with a high level of chemical preservation over geological time scale, as demonstrated by some of the most ancient microfossils found in the 3400–3500 Myr old cherts (originally opal) of the Pilbara Craton in Australia (Djokic et al., 2017; Alleon et al., 2018).
View in article
Franz, G., Lyckberg, P., Khomenko, V., Chournousenko, V., Schulz, H.-M., Mahlstedt, N., Wirth, R., Glodny, J., Gernert, U., Nissen, J. (2022) Fossilization of Precambrian microfossils in the Volyn pegmatite, Ukraine. Biogeosciences 19, 1795–1811. https://doi.org/10.5194/bg-19-1795-2022
Show in context These findings support the hypothesis of Franz et al. (2022) regarding carbohydrate-type molecules in Volyn opal.
View in article
Herrmann, J.R., Maas, R., Rey, P.F., Best, S.P. (2019) The nature and origin of pigments in black opal from Lightning Ridge, New South Wales, Australia. Australian Journal of Earth Sciences 66, 1027–1039. https://doi.org/10.1080/08120099.2019.1587643
Show in context On Earth’s surface, opal precipitation processes prove to be able to fossilise and entrap numerous biological remnants, e.g., wood, vertebrate skeletons, arthropods, various microfossils as well as organic matter (OM) (Banerjee and Wenzel, 1999; Bell et al., 2019; Herrmann et al., 2019; Chauviré et al., 2020; Mustoe, 2023).
View in article
Iler, R.K. (1978) Hydrogen-Bonded Complexes of Silica with Organic Compounds. In: Bendz, G., Lindqvist, I., Runnström-Reio, V. (Eds.) Biochemistry of Silicon and Related Problems. Springer, Boston, 53–76. https://doi.org/10.1007/978-1-4613-4018-8_2
Show in context This implies a strong geochemical affinity between OM and silica in solution, which is consistent with the strong ability of polysilicic acids to bond with OM through their hydroxyl groups in solution (Iler, 1978).
View in article
Iler, R.K. (1979) The Chemistry of Silica: Solubility, Polymerization, Colloid and Surface Properties and Biochemistry of Silica. Wiley, New York.
Show in context These labile bonds are formed both by the SiOH groups of the polysilicic acid in solution and with those on the surface of silica particles (nanograins and aggregated structures) (Iler, 1979).
View in article
Jones, B. (2021) Siliceous sinters in thermal spring systems: Review of their mineralogy, diagenesis, and fabrics. Sedimentary Geology 413, 105820. https://doi.org/10.1016/j.sedgeo.2020.105820
Show in context Observations on Earth and Mars, along with fluid–rock alteration experiments, indicate that opal forms in various geological settings (e.g., alluvial fans and deltas, hot springs), at different spatial scales (up to several km large outcrops) and at the expense of silica minerals (Rodgers et al., 2004; Chauviré et al., 2017; Lowenstern et al., 2018; Rutledge et al., 2018; Jones, 2021; Pan et al., 2021).
View in article
Leo, R.F., Barghoorn, E.S. (1976) Silicification of Wood. Botanical Museum Leaflets, Harvard University 25, 1–47. https://doi.org/10.5962/p.295209
Show in context Moreover, these types of bonds are considered a preliminary step in the petrifaction process of wood (e.g., templating) (Leo and Barghoorn, 1976; Mustoe, 2023).
View in article
Lin, R., Ritz, G.P. (1993) Studying individual macerals using i.r. microspectroscopy, and implications on oil versus gas/condensate proneness and “low-rank” generation. Organic Geochemistry 20, 695–706. https://doi.org/10.1016/0146-6380(93)90055-G
Show in context According to Lin and Ritz’s (1993) simplified n-alkane model, Quincy opal’s OM corresponds to chain lengths of 5–8 carbons, while the Volyn opal’s OM points to chains longer than 10 carbons (Marshall et al., 2005).
View in article
Lowenstern, J.B., van Hinsberg, V., Berlo, K., Liesegang, M., Iacovino, K., Bindeman, I.N., Wright, H.M. (2018) Opal-A in Glassy Pumice, Acid Alteration, and the 1817 Phreatomagmatic Eruption at Kawah Ijen (Java), Indonesia. Frontiers in Earth Science 6, 11. https://doi.org/10.3389/feart.2018.00011
Show in context Observations on Earth and Mars, along with fluid–rock alteration experiments, indicate that opal forms in various geological settings (e.g., alluvial fans and deltas, hot springs), at different spatial scales (up to several km large outcrops) and at the expense of silica minerals (Rodgers et al., 2004; Chauviré et al., 2017; Lowenstern et al., 2018; Rutledge et al., 2018; Jones, 2021; Pan et al., 2021).
View in article
Marshall, C.P., Javaux, E.J., Knoll, A.H., Walter, M.R. (2005) Combined micro-Fourier transform infrared (FTIR) spectroscopy and micro-Raman spectroscopy of Proterozoic acritarchs: A new approach to Palaeobiology. Precambrian Research 138, 208–224. https://doi.org/10.1016/j.precamres.2005.05.006
Show in context The intensity of these three bands is directly proportional to the abundance of functional groups in the OM in the samples (Marshall et al., 2005).
View in article
Mustoe, G.E. (2023) Silicification of Wood: An Overview. Minerals 13, 206. https://doi.org/10.3390/min13020206
Show in context On Earth’s surface, opal precipitation processes prove to be able to fossilise and entrap numerous biological remnants, e.g., wood, vertebrate skeletons, arthropods, various microfossils as well as organic matter (OM) (Banerjee and Wenzel, 1999; Bell et al., 2019; Herrmann et al., 2019; Chauviré et al., 2020; Mustoe, 2023).
View in article
However, among all the entrapped remnants, OM seems to be preserved and/or detected only in very rare cases (Alleon et al., 2016; Sánchez-García et al., 2020; Teece et al., 2020; Mustoe, 2023), and when it is found, its biogenicity is often questioned due to its degraded state (Brasier et al., 2002; van Zuilen et al., 2002).
View in article
Moreover, these types of bonds are considered a preliminary step in the petrifaction process of wood (e.g., templating) (Leo and Barghoorn, 1976; Mustoe, 2023).
View in article
O’Callahan, B.T., Larsen, A., Leichty, S., Cliff, J., Gagnon, A.C., Raschke, M.B. (2023) Correlative chemical and elemental nano-imaging of morphology and disorder at the nacre-prismatic region interface in Pinctada margaritifera. Scientific Reports 13, 21258. https://doi.org/10.1038/s41598-023-47446-5
Show in context Nanospectroscopy has already been proved to efficiently characterise and map OM inside biominerals (O’Callahan et al., 2023).
View in article
Pan, L., Carter, J., Quantin-Nataf, C., Pineau, M., Chauviré, B., Mangold, N., Le Deit, L., Rondeau, B., Chevrier, V. (2021) Voluminous Silica Precipitated from Martian Waters during Late-stage Aqueous Alteration. The Planetary Science Journal 2, 65. https://doi.org/10.3847/PSJ/abe541
Show in context Observations on Earth and Mars, along with fluid–rock alteration experiments, indicate that opal forms in various geological settings (e.g., alluvial fans and deltas, hot springs), at different spatial scales (up to several km large outcrops) and at the expense of silica minerals (Rodgers et al., 2004; Chauviré et al., 2017; Lowenstern et al., 2018; Rutledge et al., 2018; Jones, 2021; Pan et al., 2021).
View in article
Phan, V.T.H., Rebois, R., Beck, P., Quirico, E., Noguchi, T., Takase, M. (2023) Chemical functional characterization of immature and mature coals at the nanoscale by atomic force microscopy-based infrared spectroscopy (AFM-IR). International Journal of Coal Geology 267, 104196. https://doi.org/10.1016/j.coal.2023.104196
Show in context These band positions and their relative intensity are found to correlate with OM bonds, identified on mature coal by Phan et al. (2023) also using AFM-IR, and are present in the insoluble residue spectra of each sample (Fig. 2).
View in article
Prowse, W.G., Arnot, K.I., Recka, J.A., Thomson, R.H., Maxwell, J.R. (1991) The quincyte pigments: Fossil quinones in an eocene clay mineral. Tetrahedron 47, 1095–1108. https://doi.org/10.1016/S0040-4020(01)80947-9
Show in context In Quincy opal, the n-alkane chains (5–8 carbons), the CH2/CH3 ratio, and abundant Car bonds corroborate the polycyclic, branched molecules (peri-xanthenoxanthene), thought to cause its pink colour (Prowse et al., 1991).
View in article
Rodgers, K.A., Browne, P.R.L., Buddle, T.F., Cook, K.L., Greatrex, R.A., Hampton, W.A., Herdianita, N.R., Holland, G.R., Lynne, B.Y., Martin, R., Newton, Z., Pastars, D., Sannazarro, K.L., Teece, C.I.A. (2004) Silica phases in sinters and residues from geothermal fields of New Zealand. Earth-Science Reviews 66, 1–61. https://doi.org/10.1016/j.earscirev.2003.10.001
Show in context Observations on Earth and Mars, along with fluid–rock alteration experiments, indicate that opal forms in various geological settings (e.g., alluvial fans and deltas, hot springs), at different spatial scales (up to several km large outcrops) and at the expense of silica minerals (Rodgers et al., 2004; Chauviré et al., 2017; Lowenstern et al., 2018; Rutledge et al., 2018; Jones, 2021; Pan et al., 2021).
View in article
Rutledge, A.M., Horgan, B.H.N., Havig, J.R., Rampe, E.B., Scudder, N.A., Hamilton, T.L. (2018) Silica Dissolution and Precipitation in Glaciated Volcanic Environments and Implications for Mars. Geophysical Research Letters 45, 7371–7381. https://doi.org/10.1029/2018GL078105
Show in context Observations on Earth and Mars, along with fluid–rock alteration experiments, indicate that opal forms in various geological settings (e.g., alluvial fans and deltas, hot springs), at different spatial scales (up to several km large outcrops) and at the expense of silica minerals (Rodgers et al., 2004; Chauviré et al., 2017; Lowenstern et al., 2018; Rutledge et al., 2018; Jones, 2021; Pan et al., 2021).
View in article
Sánchez-García, L., Carrizo, D., Molina, A., Muñoz-Iglesias, V., Lezcano, M.Á., Fernández-Sampedro, M., Parro, V., Prieto-Ballesteros, O. (2020) Fingerprinting molecular and isotopic biosignatures on different hydrothermal scenarios of Iceland, an acidic and sulfur-rich Mars analog. Scientific Reports 10, 21196. https://doi.org/10.1038/s41598-020-78240-2
Show in context However, among all the entrapped remnants, OM seems to be preserved and/or detected only in very rare cases (Alleon et al., 2016; Sánchez-García et al., 2020; Teece et al., 2020; Mustoe, 2023), and when it is found, its biogenicity is often questioned due to its degraded state (Brasier et al., 2002; van Zuilen et al., 2002).
View in article
Teece, B.L., George, S.C., Djokic, T., Campbell, K.A., Ruff, S.W., Van Kranendonk, M.J. (2020) Biomolecules from Fossilized Hot Spring Sinters: Implications for the Search for Life on Mars. Astrobiology 20, 537–551. https://doi.org/10.1089/ast.2018.2018
Show in context However, among all the entrapped remnants, OM seems to be preserved and/or detected only in very rare cases (Alleon et al., 2016; Sánchez-García et al., 2020; Teece et al., 2020; Mustoe, 2023), and when it is found, its biogenicity is often questioned due to its degraded state (Brasier et al., 2002; van Zuilen et al., 2002).
View in article
van Zuilen, M.A., Lepland, A., Arrhenius, G. (2002) Reassessing the evidence for the earliest traces of life. Nature 418, 627–630. https://doi.org/10.1038/nature00934
Show in context However, among all the entrapped remnants, OM seems to be preserved and/or detected only in very rare cases (Alleon et al., 2016; Sánchez-García et al., 2020; Teece et al., 2020; Mustoe, 2023), and when it is found, its biogenicity is often questioned due to its degraded state (Brasier et al., 2002; van Zuilen et al., 2002).
View in article
Wang, M., Li, M., Li, J.-B., Xu, L., Zhang, J.-X. (2022) The key parameter of shale oil resource evaluation: Oil content. Petroleum Science 19, 1443–1459. https://doi.org/10.1016/j.petsci.2022.03.006
Show in context This helps better interpret biosignatures inside ancient OM-containing rocks (Wang et al., 2022).
View in article
top
Supplementary Information
The Supplementary Information includes:
- Information on Samples and Deposits
- Details of the Analytical Conditions and both FTIR and AFM-IR Spectral Decomposition
- CHNS Elemental Analysis
- Tables S-1 to S-3
- Figures S-1 to S-4
- Supplementary Information References
Download the Supplementary Information (PDF)
Figures

Figure 1 (a, d) Photographs of the samples: (a) Quincy pink opal sample showing a heterogeneous distribution of the pink colour with a vivid pink layer; (d) Volyn black opal sample comprising magmatic clasts cemented by homogeneous black opal. (b, e) FTIR spectra of the selected zones in the sample (left) with a focus on the region of vibrations of aliphatic CH bonds (right), for the pink opal (b) and the black opal (e). (c, f) Spectral decomposition of the OM signals: (c) Qy_2 and Qy_3 (pink opal), and (f) Vo_1, Vo_2 and Vo_3 (black opal). CO2* band is linked to atmospheric contamination.

Figure 2 (a, e) Optical microscope photographs of the Quincy pink opal (a) and Volyn black opal (d) samples. The red square represents the studied zone. (b, f) 3 × 3 micron-sized AFM topographic maps of the studied zones in the Quincy pink opal (b) and Volyn Black opal (f). (c, g) 3 × 3 micron-sized AFM-IR maps combined for three wavelengths: 1100 (Si-O, green), 1450 (CHx, blue), and 1720 cm−1 (C=O, red) for the Quincy pink opal (c) and the Volyn black opal (g). The labelled white circles indicate the acquired high resolution spectra areas. (d, h) AFM-IR spectra in the 800–1800 cm−1 range for the Quincy pink opal (d) (Qy) and the Volyn black opal (h) (Vo).
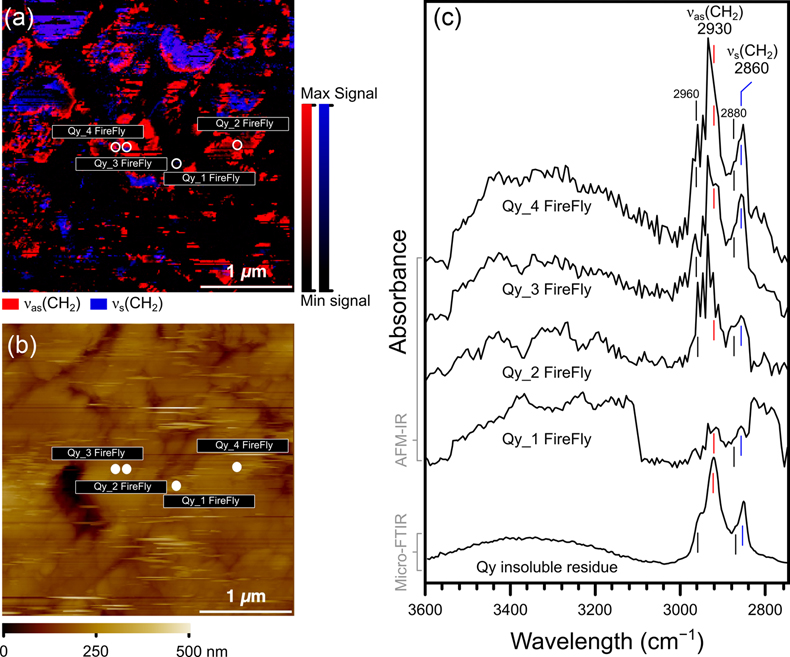
Figure 3 (a) 3 × 3 micron-sized AFM-IR map combined for two modes of CH2: νs (2860, dark blue), νas (2930, red) of the pink opal sample shown in Figure 2a. (b) 3 × 3 micron topographic map acquired by AFM. (c) AFM-IR spectra acquired in the 2800–3500 cm−1 range.

Figure 4 Conceptual model of the interaction between opal and OM during opal precipitation.