



Rare earth elements and U uptake by fish remains in seawater: how fast?
Affiliations | Corresponding Author | Cite as | Funding information
Published by the European Association of Geochemistry
under Creative Commons License CC BY-NC-ND 4.0
Keywords: trace elements, rare earth elements (REE), uranium, diagenesis, apatite


- Share this article


-
Article views:1,317Cumulative count of HTML views and PDF downloads.
- Download Citation
- Rights & Permissions

top
Abstract
Figures and Tables
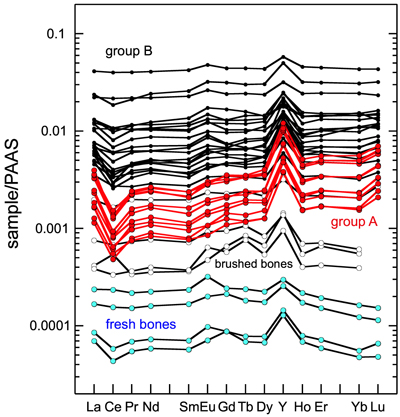 Figure 1 REE + Y patterns normalised to Post-Archean Australian Shale (PAAS; Pourmand et al., 2012; Barrat et al., 2020) for fish bones from Saint Pierre. | 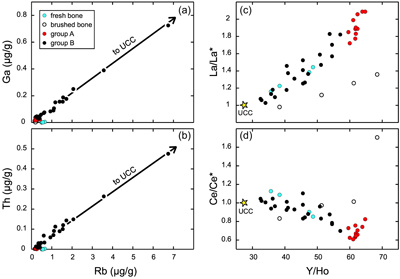 Figure 2 (a) Ga, (b) Th, vs. Rb, and (c) La/La*, (d) Ce/Ce* vs. Y/Ho plots for fish bones from Saint Pierre. The Upper Crust Composition (UCC) is shown for comparison (Rudnick and Gao, 2014). | 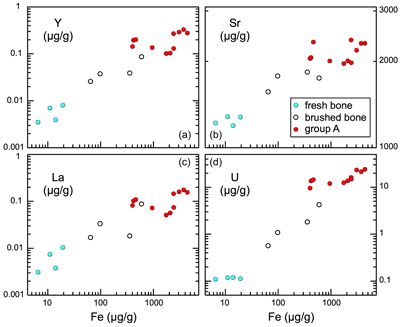 Figure 3 (a) Y, (b) Sr, (c) La, and (d) U vs. Fe plots for fish bones from Saint Pierre. | 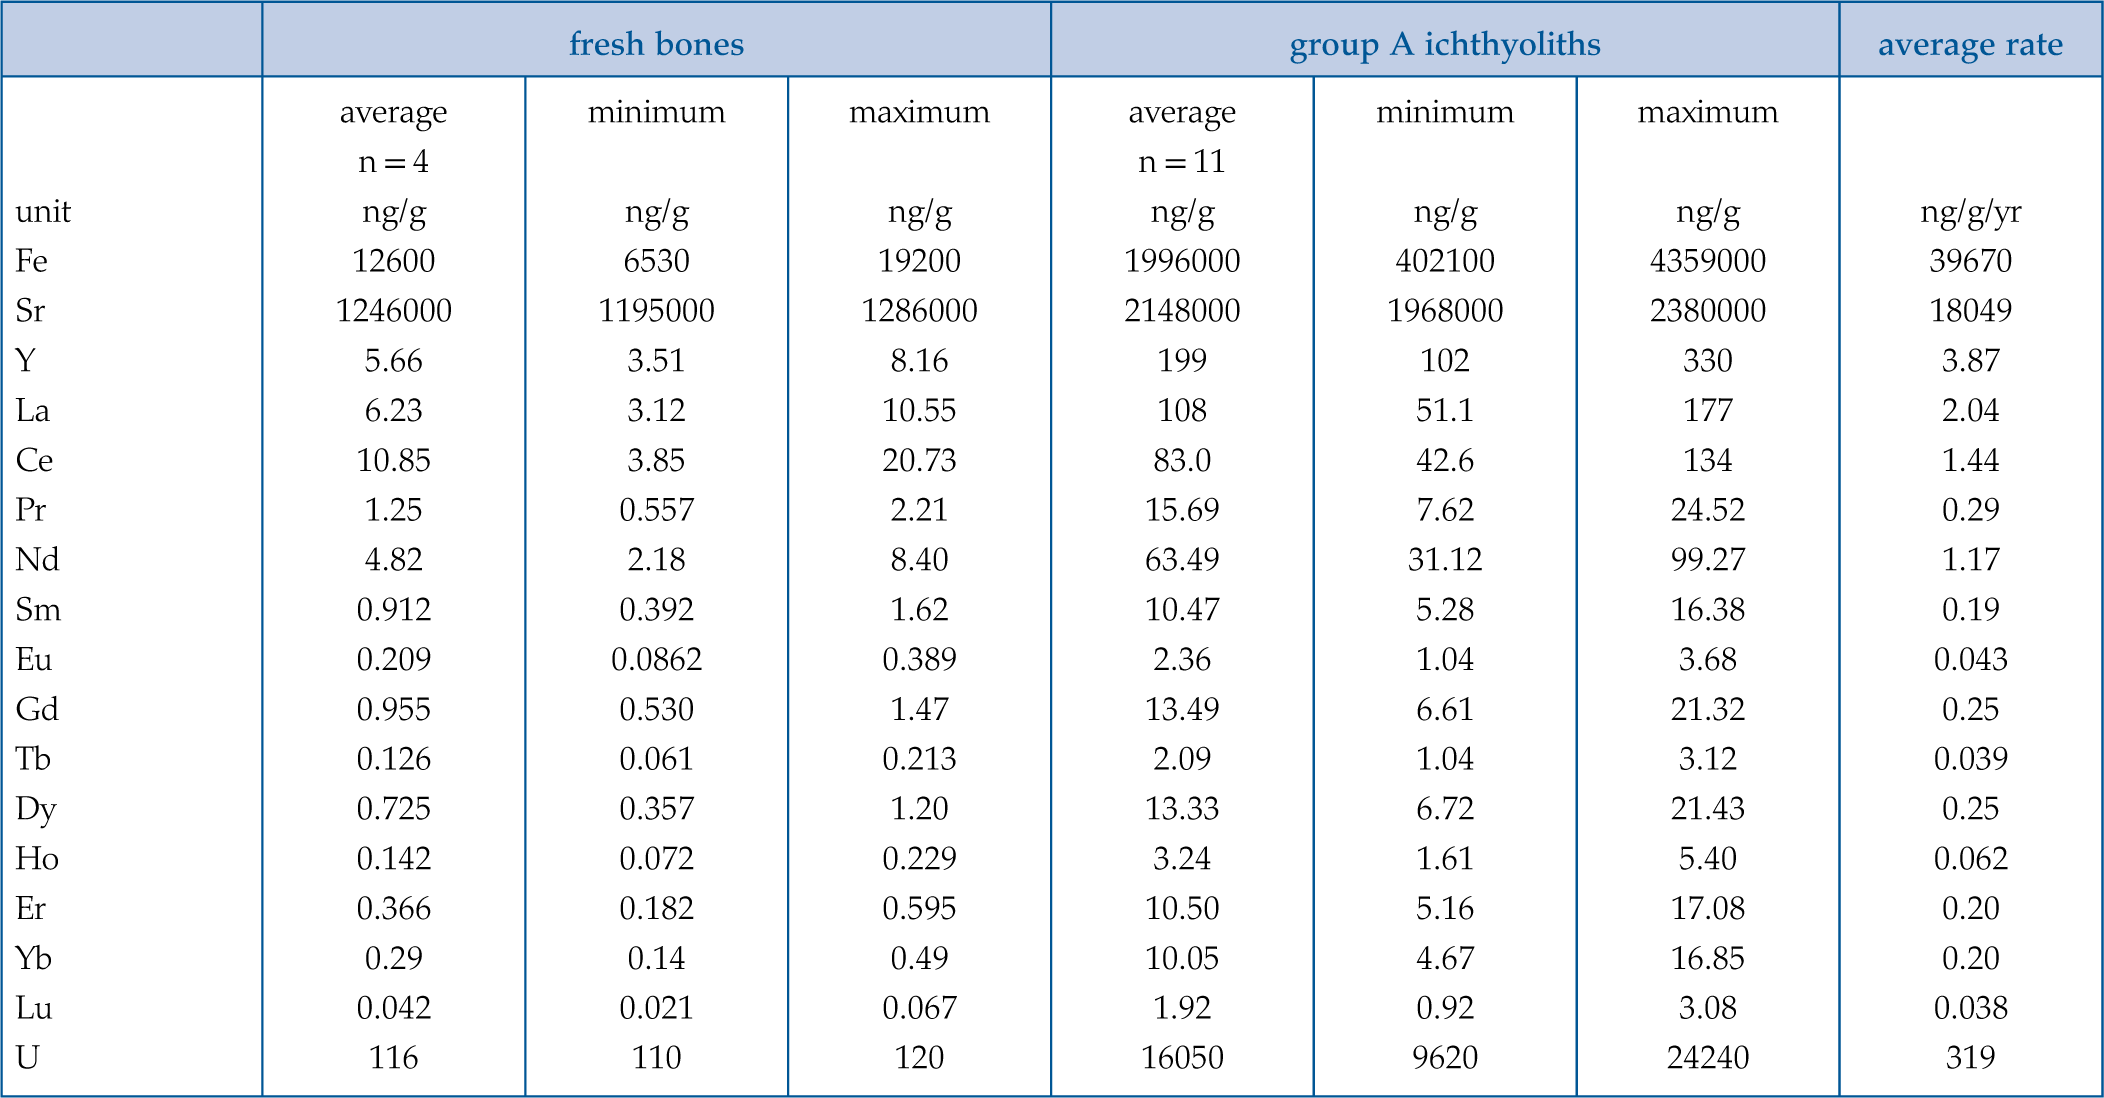 Table 1 Selected trace element abundances for fish bones from Saint Pierre, and calculated average accumulation rates. |
| Figure 1 | Figure 2 | Figure 3 | Table 1 |
top
Introduction
Vertebrate fossils, teeth and bones, composed of apatite (Ca10(PO4)6(OH,F,Cl)2), have been common in many sedimentary formations since the Devonian period. The chemistry of these fossils is an active field of research since their elemental and isotopic compositions provide access to a wealth of information, including dating, palaeoceanography, reconstruction of the palaeoenvironment, as well as taphonomy, provenance and even diet of the animals (e.g., Staudigel et al., 1985
Staudigel, H., Doyle, P., Zindler, A. (1985) Sr and Nd isotope systematics in fish teeth. Earth Planetary Science Letters 76, 45–56. https://doi.org/10.1016/0012-821X(85)90147-5
; Tütken et al., 2011Tütken, T., Vennemann, T.W., Pfretzschner, H.U. (2011) Nd and Sr isotope compositions in modern and fossil bones – Proxies for vertebrate provenance and taphonomy. Geochimica Cosmochimica Acta, 75, 5951–5970. https://doi.org/10.1016/j.gca.2011.07.024
; Reynard and Balter, 2014Reynard, B., Balter, V. (2014) Trace elements and their isotopes in bones and teeth: Diet, environments, diagenesis, and dating of archeological and paleontological samples. Palaeogeography, Palaeoclimatology, Palaeoecology 416, 4–16. https://doi.org/10.1016/j.palaeo.2014.07.038
, among many others). These fossils often have high concentrations of uranium and rare earth element (REEs), whereas the teeth or bones of living animals are practically devoid of them (e.g., Arrhenius et al., 1957Arrhenius, G., Bramlette, M.N., Picciotto, E. (1957) Localization of radioactive and stable heavy nuclides in ocean sediments. Nature 180, 85–86. https://doi.org/10.1038/180085a0
; Elderfield and Pagett, 1986Elderfield, H., Pagett, R. (1986) Rare earth elements in ichthyoliths: variations with redox conditions and depositional environment. Science of the Total Environment 49, 175–197. https://doi.org/10.1016/0048-9697(86)90239-1
; Li et al., 2024Li, H., Kipp, M.A., Kim, S.L., Kast, E.R., Eberle, J.J., Tissot, F.L.H. (2024) Exploring uranium isotopes in shark teeth as a paleo-redox proxy. Geochimica Cosmochimica Acta 365, 158–173. https://doi.org/10.1016/j.gca.2023.11.034
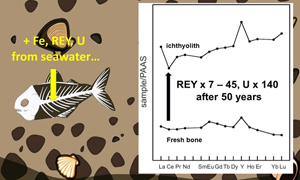
). It is generally assumed that this post-mortem enrichment takes place quickly when the bones and teeth are at the water/sediment interface and/or during burial. However, the rate of accumulation/absorption of trace elements in biogenic phosphates has never been directly constrained. This can be determined experimentally, but the limited duration of experiments that can reasonably be conducted in a laboratory limits the feasibility of the approach. Alternatively, enrichment rates can be deduced from vertebrate remains left in a constrained environment for a known period of time. Such samples are rare. Here, we report on the chemical compositions of cod remains (Gadus morhua) that have been in contact with seawater for precisely half a century and deduce the uptake rates of U and REEs for these materials.top
Historical Setting and Sampling
From the 16th century onwards, the coasts of Newfoundland were an extremely important fishing area, and the source of a large proportion of the cod consumed in Europe. In this context, the main activity of Saint Pierre and Miquelon (a French archipelago located south of Newfoundland, Figure S-1) was, throughout this period, the preparation of a colossal quantity of cod for France. This led to overfishing, particularly in the second half of the 20th century. To prevent the disappearance of cod around Newfoundland, the Canadian government imposed a fishing moratorium in 1992, resulting in a suspension of production from that date. The economic activity of Saint Pierre and Miquelon before the moratorium was based on the preparation of cod, with the installation of refrigeration facilities by the Société de Pêche et de Congélation (SPEC) in the port of Saint Pierre. From 1920 until the liquidation of SPEC in 1974, the waste from cod preparation was thrown directly into the port at the foot of the buildings on the quays. The accumulation of cod bones produced a layer of ichthyoliths at 15 m water depth near the SPEC facilities, the thickness of which is unknown (Figure S-2). No other waste from cod was deposited at this site after SPEC ceased operations. In June 2024, samples were taken from the surface of the ichthyolith layer by a scuba diver (Laurent Chauvaud), in the area where the last waste was thrown (46° 47’ 37” N, 56° 09’ 31” W). The selected samples were never buried and remained in contact with seawater with a salinity of 32 ‰ for 50 years, at a temperature varying from 0 to 16 °C depending on the season (on average 6 °C). Furthermore, a codfish was caught off the coast of Saint Pierre in July 2024, and its bones were collected for comparison with the ichthyoliths.
Finally, live thalli of coralline algae (Lithothamnion sp., probably L. tophiforme), which are excellent proxies for REEs and Y (REY) chemistry of seawater (Barrat et al., 2024
Barrat, J.A., Chauvaud, L., Amice, E., Grall, J., Rouget, M.-L., Bayon, G., Germain, Y. (2024) Trace elements in coralline algae as a new proxy for seawater chemistry and metal pollution. Chemical Geology 652, 122026. https://doi.org/10.1016/j.chemgeo.2024.122026
), were also collected from 15 m water depth in June 2024, north east of Saint Pierre (46° 47’ 54” N, 56° 08’ 54” W), about 1 km from the ichthyoliths.top
Analytical Procedures
The fresh codfish bones, ichthyoliths and coralline algae were dried overnight in an oven at 60 °C. The ichthyoliths were examined under a binocular magnifier and the cleanest were gently brushed with a soft toothbrush to remove any traces of mud. Compared to fresh bones, the surface of ichthyoliths, as well as the interior of the vertebrae, is slightly orange-yellowish due to traces of iron oxides. This coloration decreases toward the interior of the bones. The surfaces of four thick bones were cleaned with a Dremel™ rotary tool equipped with a steel brush, to expose the internal part of the samples. All the brushed samples were then rinsed with deionised water and dried.
The (uncrushed) samples (50–380 mg) were then spiked with Tm (Barrat et al., 1996
Barrat, J.A., Keller, F., Amossé, J., Taylor, R.N., Nesbitt, R.W., Hirata, T. (1996) Determination of rare earth elements in sixteen silicate reference samples by ICP-MS after Tm addition and ion exchange separation. Geostandards Newsletter 20, 1, 133–140. https://doi.org/10.1111/j.1751-908X.1996.tb00177.x
), and directly dissolved in hot HNO3 (14 N, 100 °C) for the phosphates or in HCl (2.5 N at room temperature) for the coralline algae (“mother solution”). An aliquot of the mother solution containing the equivalent of 4 mg of sample was evaporated to dryness and taken up with 5 ml HNO3 (0.4 N) with traces of HF prior to analysis. Elemental abundances were determined by Inductively Coupled Plasma Mass Spectrometry (ICP-MS), with a Thermo Scientific ELEMENT XR™ spectrometer at Pôle Spectrométrie Océan (IUEM, Plouzané), using the same procedure as Barrat et al. (2024)Barrat, J.A., Chauvaud, L., Amice, E., Grall, J., Rouget, M.-L., Bayon, G., Germain, Y. (2024) Trace elements in coralline algae as a new proxy for seawater chemistry and metal pollution. Chemical Geology 652, 122026. https://doi.org/10.1016/j.chemgeo.2024.122026
. As fresh codfish bones have relatively low concentrations of REEs, we used the remaining mother solution and separated the REEs using ion exchange columns filled with DGA resin (Barrat et al., 2020Barrat, J.A., Bayon, G., Wang, X., Le Goff, S., Rouget, M.L., Gueguen, B., Ben Salem, D. (2020) A new chemical separation procedure for the determination of rare earth elements and yttrium abundances in carbonates by ICP-MS. Talanta 219, 121244. https://doi.org/10.1016/j.talanta.2020.121244
).Based on duplicates and various reference materials, the inferred reproducibility (RSD) for concentrations and elemental ratios is generally better than 3 % (e.g., Barrat et al., 2012
Barrat, J.A., Zanda, B., Moynier, F., Bollinger, C., Liorzou, C., Bayon, G. (2012) Geochemistry of CI chondrites: Major and trace elements, and Cu and Zn isotopes. Geochimica Cosmochimica Acta 83, 79–92. https://doi.org/10.1016/j.gca.2011.12.011
, 2016Barrat, J.A., Dauphas, N., Gillet, P., Bollinger, C., Etoubleau, J., Bischoff, A., Yamaguchi, A. (2016) Evidence from Tm anomalies for non-CI refractory lithophile element proportions in terrestrial planets and achondrites. Geochimica Cosmochimica Acta 176, 1–17. https://doi.org/10.1016/j.gca.2015.12.004
, 2020Barrat, J.A., Bayon, G., Wang, X., Le Goff, S., Rouget, M.L., Gueguen, B., Ben Salem, D. (2020) A new chemical separation procedure for the determination of rare earth elements and yttrium abundances in carbonates by ICP-MS. Talanta 219, 121244. https://doi.org/10.1016/j.talanta.2020.121244
, 2024Barrat, J.A., Chauvaud, L., Amice, E., Grall, J., Rouget, M.-L., Bayon, G., Germain, Y. (2024) Trace elements in coralline algae as a new proxy for seawater chemistry and metal pollution. Chemical Geology 652, 122026. https://doi.org/10.1016/j.chemgeo.2024.122026
and references therein). The La and Ce anomalies are calculated using the La/La*, Ce/Ce* ratios, where X* is the extrapolated concentrations for a smooth PAAS-normalised REE pattern and Xsn is the concentration of element X normalised to PAAS: Lasn* = Prsn3/Ndsn2, Cesn* = Prsn2/Ndsn (Barrat et al., 2023Barrat, J.A., Bayon, G., Lalonde, S. (2023) Calculation of cerium and lanthanum anomalies in geological and environmental samples. Chemical Geology 615, 121202. https://doi.org/10.1016/j.chemgeo.2022.121202
).top
Results and Discussion
Four vertebrae of a fresh codfish and thirty-six ichthyoliths (mainly vertebrae) were analysed (Table S-1). The compositions obtained from the fresh samples vary little for most of the measured elements. Apart from some of them, such as Sr, V, Mn, Fe and Ba, which exceed a few μg/g, the others have low concentrations well below 1 μg/g. For the four samples, the U concentrations are almost constant and vary only between 110 and 120 ng/g. The REY concentrations are quite low, ranging from 2 × 10⁻⁵ to 4 × 10⁻⁴ × PAAS. However, the patterns are quite variable (Figure 1): two of them show negative Ce anomalies, while the other two do not (Ce/Ce* = 0.84–1.11). These significant variations within a single fish are quite unexpected and are not yet explained. It seems more likely that REY distributions acquired in vivo in the bones would reflect the nutrients absorbed by the fish rather than the characteristics of the seawater.
Figure 1 REE + Y patterns normalised to Post-Archean Australian Shale (PAAS; Pourmand et al., 2012
Pourmand, A., Dauphas, N., Ireland, T.J. (2012) A novel extraction chromatography and MC-ICP-MS technique for rapid analysis of REE, Sc and Y: Revising CI-chondrite and Post-Archean Australian Shale (PAAS) abundances. Chemical Geology 291, 38–54. https://doi.org/10.1016/j.chemgeo.2011.08.011
; Barrat et al., 2020Barrat, J.A., Bayon, G., Wang, X., Le Goff, S., Rouget, M.L., Gueguen, B., Ben Salem, D. (2020) A new chemical separation procedure for the determination of rare earth elements and yttrium abundances in carbonates by ICP-MS. Talanta 219, 121244. https://doi.org/10.1016/j.talanta.2020.121244
) for fish bones from Saint Pierre.Ichthyoliths show much higher and more variable concentrations as illustrated by U (8.8–24.2 μg/g, average 15.7 μg/g) and REEs (e.g., La = 0.05–1.83 μg/g). The PAAS-normalised REY patterns are also highly variable, and two types of samples can be identified (Figure 1). The samples with the lowest REY levels (Group A) show patterns with the characteristics of seawater, i.e. positive anomalies in Y (Y/Ho = 59–65), in La (La/La* = 1.72–2.09), and negative anomalies in Ce (Ce/Ce* = 0.61–0.81). For the other samples with higher REY levels (Group B), these anomalies fade with increasing concentrations (Y/Ho = 32–54, La/La* = 1.03–1.83, Ce/Ce* = 0.77–1.09). They are also correlated and suggest a binary mixture between the Group A samples and a second end member (Figure 2). The variations in the abundances of the other elements (for example, Th, Ga vs. Rb, Figure 2) confirm this interpretation: these trends connect the Group A samples to crustal compositions. Traces of detrital or clayey material trapped in the asperities and cavities of the samples, account for the ranges shown by the Group B ichthyoliths. Thus, the chemical heterogeneity recorded by this group should not be ascribed to putative enrichments or fractionations of elements absorbed from seawater nor porewater. The amounts of sedimentary material needed to explain the variations are very small. For the sake of exercise, we use the composition of the upper continental crust given by Rudnick and Gao (2014)
Rudnick, R.L., Gao, S. (2014) Composition of the continental crust. In: Holland, H.D., Turekian, K.K. (Eds.) Treatise on Geochemistry, 2nd edition volume 4. Elsevier, Amsterdam, 1–51. https://doi.org/10.1016/B978-0-08-095975-7.00301-6
, and we calculate that the addition of less than 5 wt. % of sedimentary materials is enough to account for the spread of Group B samples. Because detrital particles or clays contain less U than Group A ichthyoliths, the addition of such low amount of these materials has no impact on the concentrations for this element. Unfortunately, this is not the case for REY and most of the other elements, such as alkali elements, Mn, Nb, Th, among others. For this reason, we will limit our discussion to Group A ichthyoliths, and the four samples cleaned with the steel brush.Figure 2 (a) Ga, (b) Th, vs. Rb, and (c) La/La*, (d) Ce/Ce* vs. Y/Ho plots for fish bones from Saint Pierre. The Upper Crust Composition (UCC) is shown for comparison (Rudnick and Gao, 2014
Rudnick, R.L., Gao, S. (2014) Composition of the continental crust. In: Holland, H.D., Turekian, K.K. (Eds.) Treatise on Geochemistry, 2nd edition volume 4. Elsevier, Amsterdam, 1–51. https://doi.org/10.1016/B978-0-08-095975-7.00301-6
).Group A ichthyoliths are significantly poorer in alkali elements (Rb and Cs) than fresh fish bones (fresh bones contain about 0.5 μg/g Rb and about 0.02 μg/g Cs and Group A samples always less (e.g., Rb = 0.16–0.41 μg/g, Table S-1). These differences could be attributed to organic matter still present in fresh bones or, more likely, could also be a consequence of apatite diagenesis. More significant are the notable enrichments in Fe in the ichthyoliths, which are correlated with the enrichments in U, Sr and REY (Figure 3). These variations are related to the development of authigenic phases during diagenesis, in particular Fe oxides (Kohn, 2008
Kohn, M.J. (2008) Models of diffusion-limited uptake of trace elements in fossils and rates of fossilization. Geochimica Cosmochimica Acta 72, 3758–3770. https://doi.org/10.1016/j.gca.2008.05.045
; Decrée et al., 2018Decrée, S., Herwartz, D., Mercadier, J., Mijàn, I., de Buffrénil, V., Leduc, T., Lambert, O. (2018) The post-mortem history of a bone revealed by its trace element signature: the case of a fossil whale rostrum. Chemical Geology 477, 137–150. https://doi.org/10.1016/j.chemgeo.2017.12.021
). The four strongly brushed samples show trace element abundances transitional between fresh bone and Group A ichthyoliths. Thus, the effects of diagenesis, although detectable in these samples, are more limited in the centre of the larger ichthyoliths.Figure 3 (a) Y, (b) Sr, (c) La, and (d) U vs. Fe plots for fish bones from Saint Pierre.
To date, REY have not been determined in the coastal waters of the Saint Pierre and Miquelon Archipelago or Newfoundland. In the absence of such data, we analysed live coralline algae thalli, which concentrate these elements and whose REY patterns have the same shape as seawater (Barrat et al., 2024
Barrat, J.A., Chauvaud, L., Amice, E., Grall, J., Rouget, M.-L., Bayon, G., Germain, Y. (2024) Trace elements in coralline algae as a new proxy for seawater chemistry and metal pollution. Chemical Geology 652, 122026. https://doi.org/10.1016/j.chemgeo.2024.122026
). The REY patterns of Group A ichthyoliths and these algae are similar (Figure S-4). This match strongly suggests that REY uptake by ichthyoliths is largely dominated by quantitative incorporation without fractionation. An adsorption mechanism controlled by surface crystal-chemical properties, or a substitution mechanism controlled by bulk crystal-chemical properties, would have generated patterns very different to those of seawater (Koeppenkastrop and De Carlo, 1992Koeppenkastrop, D., De Carlo, E.H. (1992) Sorption of rare earth elements from seawater onto synthetic mineral particles: an experimental approach. Chemical Geology 95, 251–263. https://doi.org/10.1016/0009-2541(92)90015-W
; Reynard et al., 1999Reynard, B., Lécuyer, C., Grandjean, P. (1999) Crystal – chemical controls on rare-earth element concentrations in fossil biogenic apatites and implications for paleoenvironmental reconstructions. Chemical Geology 155, 233–241. https://doi.org/10.1016/S0009-2541(98)00169-7
). The minor differences observed between the patterns of the ichthyoliths and algae should not be overemphasised. The light deviations for Ce or Y anomalies could be explained by either local variations of seawater composition at the interface with sediments, or differences in the incorporation processes of these two types of materials (carbonates and phosphates).The uptake rates of U and REY in cod bones can be easily deduced from the average compositions of Group A ichthyoliths and of the bones of freshly caught cod (Table 1). Assuming these rates have remained constant over the last 50 years, it can be calculated that the concentrations of U and Nd are increasing on average by 319 ng · g-1 · yr-1 and 1.2 ng · g-1 · yr-1, respectively. These accumulation rates are indicative and representative of the fish bones on the North Atlantic seabed. For other cases, they must be considered as orders of magnitude, because they are certainly dependent on the structure (e.g., crystallinity, porosity) of biogenic phosphates: for example, the dentin and enamel of the same fossil shark tooth display very different REE concentrations even though they fossilised under the same conditions and with the same fluids (e.g., Picard et al., 2002
Picard, S., Lécuyer, C., Barrat, J.A., Garcia, J.P., Dromart, G., Sheppard, S.M.F. (2002) Rare Earth Element chemistry of Jurassic seawater inferred from fish and reptile apatite. Chemical Geology 186, 1–16. https://doi.org/10.1016/S0009-2541(01)00424-7
). These rates also depend greatly on the surface exposed to seawater, and therefore on the shape and size of the ichthyoliths. Furthermore, they cannot be applied to biogenic phosphates whose REY patterns indicate different U or REY uptake processes than the present ichthyoliths (e.g., with bell-shape patterns like many Paleozoic phosphatic fossils), or different sources of REYs (e.g., seawater and porewaters).Table 1 Selected trace element abundances for fish bones from Saint Pierre, and calculated average accumulation rates.
| fresh bones | group A ichthyoliths | average rate | |||||
| average | minimum | maximum | average | minimum | maximum | ||
| n = 4 | n = 11 | ||||||
| unit | ng/g | ng/g | ng/g | ng/g | ng/g | ng/g | ng/g/yr |
| Fe | 12600 | 6530 | 19200 | 1996000 | 402100 | 4359000 | 39670 |
| Sr | 1246000 | 1195000 | 1286000 | 2148000 | 1968000 | 2380000 | 18049 |
| Y | 5.66 | 3.51 | 8.16 | 199 | 102 | 330 | 3.87 |
| La | 6.23 | 3.12 | 10.55 | 108 | 51.1 | 177 | 2.04 |
| Ce | 10.85 | 3.85 | 20.73 | 83.0 | 42.6 | 134 | 1.44 |
| Pr | 1.25 | 0.557 | 2.21 | 15.69 | 7.62 | 24.52 | 0.29 |
| Nd | 4.82 | 2.18 | 8.40 | 63.49 | 31.12 | 99.27 | 1.17 |
| Sm | 0.912 | 0.392 | 1.62 | 10.47 | 5.28 | 16.38 | 0.19 |
| Eu | 0.209 | 0.0862 | 0.389 | 2.36 | 1.04 | 3.68 | 0.043 |
| Gd | 0.955 | 0.530 | 1.47 | 13.49 | 6.61 | 21.32 | 0.25 |
| Tb | 0.126 | 0.061 | 0.213 | 2.09 | 1.04 | 3.12 | 0.039 |
| Dy | 0.725 | 0.357 | 1.20 | 13.33 | 6.72 | 21.43 | 0.25 |
| Ho | 0.142 | 0.072 | 0.229 | 3.24 | 1.61 | 5.40 | 0.062 |
| Er | 0.366 | 0.182 | 0.595 | 10.50 | 5.16 | 17.08 | 0.20 |
| Yb | 0.29 | 0.14 | 0.49 | 10.05 | 4.67 | 16.85 | 0.20 |
| Lu | 0.042 | 0.021 | 0.067 | 1.92 | 0.92 | 3.08 | 0.038 |
| U | 116 | 110 | 120 | 16050 | 9620 | 24240 | 319 |
The results obtained here have important implications for the use of biogenic phosphates as palaeoceanographic proxies for the composition of past seawater. First, our observations confirm that fish remains rapidly accumulate REY and U on the seafloor surface before being buried in sediments. Within a few decades, their biological signatures are erased by those of seawater, and their REY patterns become virtually parallel to that of seawater, with the same anomalies in La, Ce and Y. However, a few decades spent on the surface of sediments cannot account for the high abundances observed in certain fossils. For example, some ichthyoliths found in Moroccan phosphates can have very high concentrations of REEs and U (with more than 80 ppm Nd, 900 ppm U and seawater-like REE patterns, e.g., Balter et al., 2011
Balter, V., Lecuyer, C., Barrat, J.A. (2011) Reconstructing seawater Sr/Ca during the last 70 My using fossil fish tooth enamel. Palaeogeography, Palaeoclimatology, Palaeoecology 310, 133–138. https://doi.org/10.1016/j.palaeo.2011.02.024.
). Several thousand years at the water/sediment interface would be required to achieve such concentrations, which would only be possible with extremely low sedimentation rates. Alternatively, this could suggest that REY and U enrichments would be much greater after burial than at the water/sediment interface, making the preservation of the original marine signature illusory (e.g., Toyoda and Tokonami, 1990Toyoda, K., Tokonami, M. (1990) Diffusion of rare-earth elements in fish teeth from deep-sea sediments. Nature 345, 607–609. https://doi.org/10.1038/345607a0
).top
Acknowledgements
We thank Gavin Foster for the editorial handling, and both anonymous reviewers for their very constructive comments. Warm thanks to Jean-Marc Derouet (DTAM - Saint-Pierre et Miquelon) for codfish sampling, and to Erwan Amice for the superb pictures of the ichthyoliths bed.
Editor: Gavin Foster
top
References
Arrhenius, G., Bramlette, M.N., Picciotto, E. (1957) Localization of radioactive and stable heavy nuclides in ocean sediments. Nature 180, 85–86. https://doi.org/10.1038/180085a0
 Show in context
 These fossils often have high concentrations of uranium and rare earth element (REEs), whereas the teeth or bones of living animals are practically devoid of them (e.g., Arrhenius et al., 1957; Elderfield and Pagett, 1986; Li et al., 2024).
View in article
Balter, V., Lecuyer, C., Barrat, J.A. (2011) Reconstructing seawater Sr/Ca during the last 70 My using fossil fish tooth enamel. Palaeogeography, Palaeoclimatology, Palaeoecology 310, 133–138. https://doi.org/10.1016/j.palaeo.2011.02.024.
Show in context However, a few decades spent on the surface of sediments cannot account for the high abundances observed in certain fossils. For example, some ichthyoliths found in Moroccan phosphates can have very high concentrations of REEs and U (with more than 80 ppm Nd, 900 ppm U and seawater-like REE patterns, e.g., Balter et al., 2011).
View in article
Barrat, J.A., Keller, F., Amossé, J., Taylor, R.N., Nesbitt, R.W., Hirata, T. (1996) Determination of rare earth elements in sixteen silicate reference samples by ICP-MS after Tm addition and ion exchange separation. Geostandards Newsletter 20, 1, 133–140. https://doi.org/10.1111/j.1751-908X.1996.tb00177.x
Show in context The (uncrushed) samples (50–380 mg) were then spiked with Tm (Barrat et al., 1996), and directly dissolved in hot HNO3 (14 N, 100 °C) for the phosphates or in HCl (2.5 N at room temperature) for the coralline algae (“mother solution”).
View in article
Barrat, J.A., Zanda, B., Moynier, F., Bollinger, C., Liorzou, C., Bayon, G. (2012) Geochemistry of CI chondrites: Major and trace elements, and Cu and Zn isotopes. Geochimica Cosmochimica Acta 83, 79–92. https://doi.org/10.1016/j.gca.2011.12.011
Show in context Based on duplicates and various reference materials, the inferred reproducibility (RSD) for concentrations and elemental ratios is generally better than 3 % (e.g., Barrat et al., 2012, 2016, 2020, 2024 and references therein).
View in article
Barrat, J.A., Dauphas, N., Gillet, P., Bollinger, C., Etoubleau, J., Bischoff, A., Yamaguchi, A. (2016) Evidence from Tm anomalies for non-CI refractory lithophile element proportions in terrestrial planets and achondrites. Geochimica Cosmochimica Acta 176, 1–17. https://doi.org/10.1016/j.gca.2015.12.004
Show in context Based on duplicates and various reference materials, the inferred reproducibility (RSD) for concentrations and elemental ratios is generally better than 3 % (e.g., Barrat et al., 2012, 2016, 2020, 2024 and references therein).
View in article
Barrat, J.A., Bayon, G., Wang, X., Le Goff, S., Rouget, M.L., Gueguen, B., Ben Salem, D. (2020) A new chemical separation procedure for the determination of rare earth elements and yttrium abundances in carbonates by ICP-MS. Talanta 219, 121244. https://doi.org/10.1016/j.talanta.2020.121244
Show in context As fresh codfish bones have relatively low concentrations of REEs, we used the remaining mother solution and separated the REEs using ion exchange columns filled with DGA resin (Barrat et al., 2020).
View in article
Based on duplicates and various reference materials, the inferred reproducibility (RSD) for concentrations and elemental ratios is generally better than 3 % (e.g., Barrat et al., 2012, 2016, 2020, 2024 and references therein).
View in article
REE + Y patterns normalised to Post-Archean Australian Shale (PAAS; Pourmand et al., 2012; Barrat et al., 2020) for fish bones from Saint Pierre.
View in article
Barrat, J.A., Bayon, G., Lalonde, S. (2023) Calculation of cerium and lanthanum anomalies in geological and environmental samples. Chemical Geology 615, 121202. https://doi.org/10.1016/j.chemgeo.2022.121202
Show in context The La and Ce anomalies are calculated using the La/La*, Ce/Ce* ratios, where X* is the extrapolated concentrations for a smooth PAAS-normalised REE pattern and Xsn is the concentration of element X normalised to PAAS: Lasn* = Prsn 3/Ndsn 2, Cesn* = Prsn 2/Ndsn (Barrat et al., 2023).
View in article
Barrat, J.A., Chauvaud, L., Amice, E., Grall, J., Rouget, M.-L., Bayon, G., Germain, Y. (2024) Trace elements in coralline algae as a new proxy for seawater chemistry and metal pollution. Chemical Geology 652, 122026. https://doi.org/10.1016/j.chemgeo.2024.122026
Show in context Finally, live thalli of coralline algae (Lithothamnion sp., probably L. tophiforme), which are excellent proxies for REEs and Y (REY) chemistry of seawater (Barrat et al., 2024), were also collected from 15 m water depth in June 2024, north east of Saint Pierre (46° 47’ 54” N, 56° 08’ 54” W), about 1 km from the ichthyoliths.
View in article
Elemental abundances were determined by Inductively Coupled Plasma Mass Spectrometry (ICP-MS), with a Thermo Scientific ELEMENT XR™ spectrometer at Pôle Spectrométrie Océan (IUEM, Plouzané), using the same procedure as Barrat et al. (2024).
View in article
Based on duplicates and various reference materials, the inferred reproducibility (RSD) for concentrations and elemental ratios is generally better than 3 % (e.g., Barrat et al., 2012, 2016, 2020, 2024 and references therein).
View in article
In the absence of such data, we analysed live coralline algae thalli, which concentrate these elements and whose REY patterns have the same shape as seawater (Barrat et al., 2024).
View in article
Decrée, S., Herwartz, D., Mercadier, J., Mijàn, I., de Buffrénil, V., Leduc, T., Lambert, O. (2018) The post-mortem history of a bone revealed by its trace element signature: the case of a fossil whale rostrum. Chemical Geology 477, 137–150. https://doi.org/10.1016/j.chemgeo.2017.12.021
Show in context These variations are related to the development of authigenic phases during diagenesis, in particular Fe oxides (Kohn, 2008; Decrée et al., 2018).
View in article
Elderfield, H., Pagett, R. (1986) Rare earth elements in ichthyoliths: variations with redox conditions and depositional environment. Science of the Total Environment 49, 175–197. https://doi.org/10.1016/0048-9697(86)90239-1
Show in context These fossils often have high concentrations of uranium and rare earth element (REEs), whereas the teeth or bones of living animals are practically devoid of them (e.g., Arrhenius et al., 1957; Elderfield and Pagett, 1986; Li et al., 2024).
View in article
Koeppenkastrop, D., De Carlo, E.H. (1992) Sorption of rare earth elements from seawater onto synthetic mineral particles: an experimental approach. Chemical Geology 95, 251–263. https://doi.org/10.1016/0009-2541(92)90015-W
Show in context An adsorption mechanism controlled by surface crystal-chemical properties, or a substitution mechanism controlled by bulk crystal-chemical properties, would have generated patterns very different to those of seawater (Koeppenkastrop and De Carlo, 1992; Reynard et al., 1999).
View in article
Kohn, M.J. (2008) Models of diffusion-limited uptake of trace elements in fossils and rates of fossilization. Geochimica Cosmochimica Acta 72, 3758–3770. https://doi.org/10.1016/j.gca.2008.05.045
Show in context These variations are related to the development of authigenic phases during diagenesis, in particular Fe oxides (Kohn, 2008; Decrée et al., 2018).
View in article
Li, H., Kipp, M.A., Kim, S.L., Kast, E.R., Eberle, J.J., Tissot, F.L.H. (2024) Exploring uranium isotopes in shark teeth as a paleo-redox proxy. Geochimica Cosmochimica Acta 365, 158–173. https://doi.org/10.1016/j.gca.2023.11.034
Show in context These fossils often have high concentrations of uranium and rare earth element (REEs), whereas the teeth or bones of living animals are practically devoid of them (e.g., Arrhenius et al., 1957; Elderfield and Pagett, 1986; Li et al., 2024).
View in article
Picard, S., Lécuyer, C., Barrat, J.A., Garcia, J.P., Dromart, G., Sheppard, S.M.F. (2002) Rare Earth Element chemistry of Jurassic seawater inferred from fish and reptile apatite. Chemical Geology 186, 1–16. https://doi.org/10.1016/S0009-2541(01)00424-7
Show in context For other cases, they must be considered as orders of magnitude, because they are certainly dependent on the structure (e.g., crystallinity, porosity) of biogenic phosphates: for example, the dentin and enamel of the same fossil shark tooth display very different REE concentrations even though they fossilised under the same conditions and with the same fluids (e.g., Picard et al., 2002).
View in article
Pourmand, A., Dauphas, N., Ireland, T.J. (2012) A novel extraction chromatography and MC-ICP-MS technique for rapid analysis of REE, Sc and Y: Revising CI-chondrite and Post-Archean Australian Shale (PAAS) abundances. Chemical Geology 291, 38–54. https://doi.org/10.1016/j.chemgeo.2011.08.011
Show in context REE + Y patterns normalised to Post-Archean Australian Shale (PAAS; Pourmand et al., 2012; Barrat et al., 2020) for fish bones from Saint Pierre.
View in article
Reynard, B., Balter, V. (2014) Trace elements and their isotopes in bones and teeth: Diet, environments, diagenesis, and dating of archeological and paleontological samples. Palaeogeography, Palaeoclimatology, Palaeoecology 416, 4–16. https://doi.org/10.1016/j.palaeo.2014.07.038
Show in context The chemistry of these fossils is an active field of research since their elemental and isotopic compositions provide access to a wealth of information, including dating, palaeoceanography, reconstruction of the palaeoenvironment, as well as taphonomy, provenance and even diet of the animals (e.g., Staudigel et al., 1985; Tütken et al., 2011; Reynard and Balter, 2014, among many others).
View in article
Reynard, B., Lécuyer, C., Grandjean, P. (1999) Crystal – chemical controls on rare-earth element concentrations in fossil biogenic apatites and implications for paleoenvironmental reconstructions. Chemical Geology 155, 233–241. https://doi.org/10.1016/S0009-2541(98)00169-7
Show in context An adsorption mechanism controlled by surface crystal-chemical properties, or a substitution mechanism controlled by bulk crystal-chemical properties, would have generated patterns very different to those of seawater (Koeppenkastrop and De Carlo, 1992; Reynard et al., 1999).
View in article
Rudnick, R.L., Gao, S. (2014) Composition of the continental crust. In: Holland, H.D., Turekian, K.K. (Eds.) Treatise on Geochemistry, 2nd edition volume 4. Elsevier, Amsterdam, 1–51. https://doi.org/10.1016/B978-0-08-095975-7.00301-6
Show in context The amounts of sedimentary material needed to explain the variations are very small. For the sake of exercise, we use the composition of the upper continental crust given by Rudnick and Gao (2014), and we calculate that the addition of less than 5 wt. % of sedimentary materials is enough to account for the spread of Group B samples.
View in article
The Upper Crust Composition (UCC) is shown for comparison (Rudnick and Gao, 2014).
View in article
Staudigel, H., Doyle, P., Zindler, A. (1985) Sr and Nd isotope systematics in fish teeth. Earth Planetary Science Letters 76, 45–56. https://doi.org/10.1016/0012-821X(85)90147-5
Show in context The chemistry of these fossils is an active field of research since their elemental and isotopic compositions provide access to a wealth of information, including dating, palaeoceanography, reconstruction of the palaeoenvironment, as well as taphonomy, provenance and even diet of the animals (e.g., Staudigel et al., 1985; Tütken et al., 2011; Reynard and Balter, 2014, among many others).
View in article
Toyoda, K., Tokonami, M. (1990) Diffusion of rare-earth elements in fish teeth from deep-sea sediments. Nature 345, 607–609. https://doi.org/10.1038/345607a0
Show in context Alternatively, this could suggest that REY and U enrichments would be much greater after burial than at the water/sediment interface, making the preservation of the original marine signature illusory (e.g., Toyoda and Tokonami, 1990).
View in article
Tütken, T., Vennemann, T.W., Pfretzschner, H.U. (2011) Nd and Sr isotope compositions in modern and fossil bones – Proxies for vertebrate provenance and taphonomy. Geochimica Cosmochimica Acta, 75, 5951–5970. https://doi.org/10.1016/j.gca.2011.07.024
Show in context The chemistry of these fossils is an active field of research since their elemental and isotopic compositions provide access to a wealth of information, including dating, palaeoceanography, reconstruction of the palaeoenvironment, as well as taphonomy, provenance and even diet of the animals (e.g., Staudigel et al., 1985; Tütken et al., 2011; Reynard and Balter, 2014, among many others).
View in article
top
Supplementary Information
The Supplementary Information includes:
- Figures S-1 to S-3
- Table S-1
Download the Supplementary Information (PDF)
Download Table S-1(.xlsx)
Figures
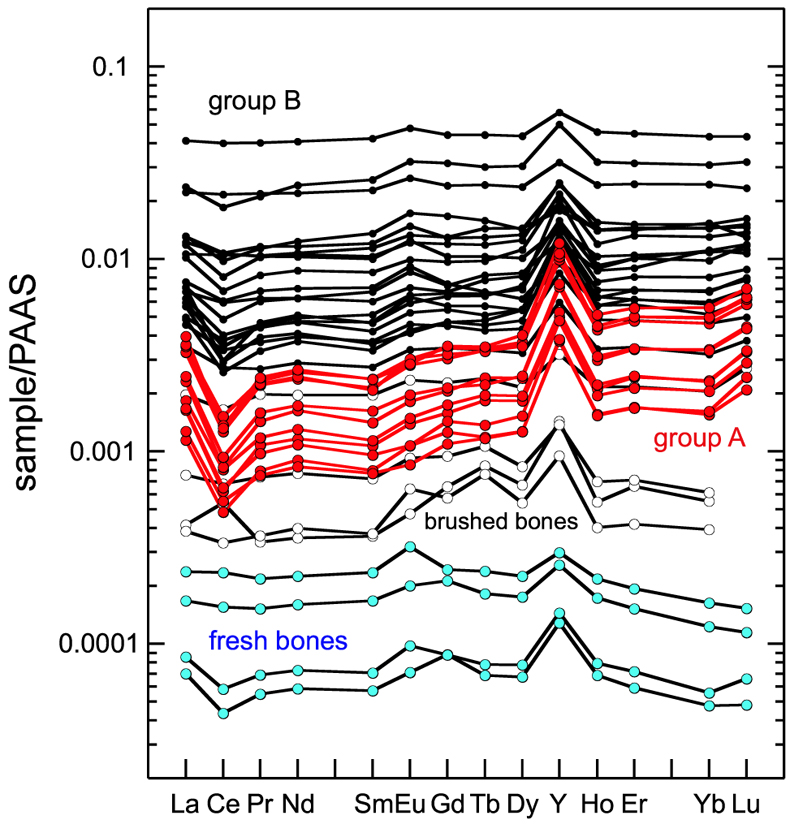
Figure 1 REE + Y patterns normalised to Post-Archean Australian Shale (PAAS; Pourmand et al., 2012
Pourmand, A., Dauphas, N., Ireland, T.J. (2012) A novel extraction chromatography and MC-ICP-MS technique for rapid analysis of REE, Sc and Y: Revising CI-chondrite and Post-Archean Australian Shale (PAAS) abundances. Chemical Geology 291, 38–54. https://doi.org/10.1016/j.chemgeo.2011.08.011
; Barrat et al., 2020Barrat, J.A., Bayon, G., Wang, X., Le Goff, S., Rouget, M.L., Gueguen, B., Ben Salem, D. (2020) A new chemical separation procedure for the determination of rare earth elements and yttrium abundances in carbonates by ICP-MS. Talanta 219, 121244. https://doi.org/10.1016/j.talanta.2020.121244
) for fish bones from Saint Pierre.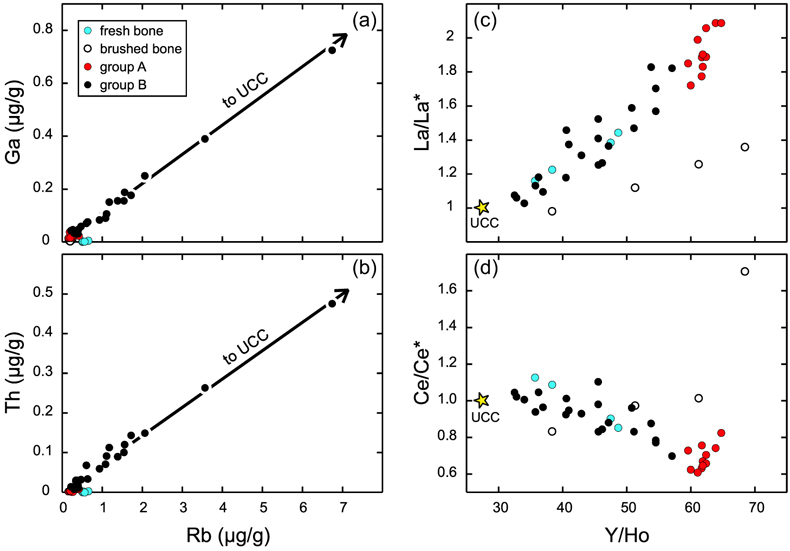
Figure 2 (a) Ga, (b) Th, vs. Rb, and (c) La/La*, (d) Ce/Ce* vs. Y/Ho plots for fish bones from Saint Pierre. The Upper Crust Composition (UCC) is shown for comparison (Rudnick and Gao, 2014
Rudnick, R.L., Gao, S. (2014) Composition of the continental crust. In: Holland, H.D., Turekian, K.K. (Eds.) Treatise on Geochemistry, 2nd edition volume 4. Elsevier, Amsterdam, 1–51. https://doi.org/10.1016/B978-0-08-095975-7.00301-6
).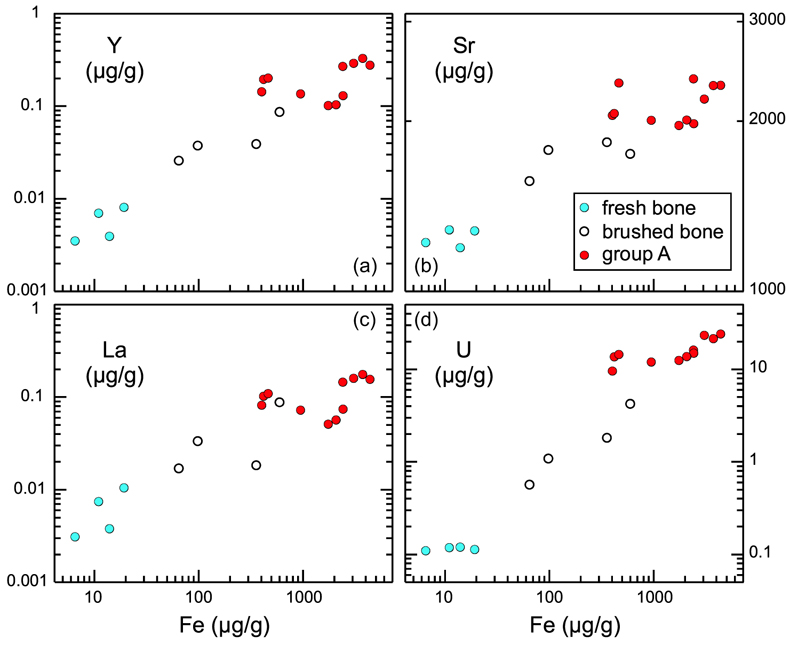
Figure 3 (a) Y, (b) Sr, (c) La, and (d) U vs. Fe plots for fish bones from Saint Pierre.