


Fe-H melting curve below 3 GPa: implications for hydrogen in the lunar core
Affiliations | Corresponding Author | Cite as | Funding information
Published by the European Association of Geochemistry
under Creative Commons License CC BY 4.0
Keywords: iron-hydrogen alloy, melting curve, high-pressure experiments, diamond-anvil cell, lunar core, lunar magma ocean


- Share this article


-
Article views:182Cumulative count of HTML views and PDF downloads.
- Download Citation
- Rights & Permissions

top
Abstract
Figures
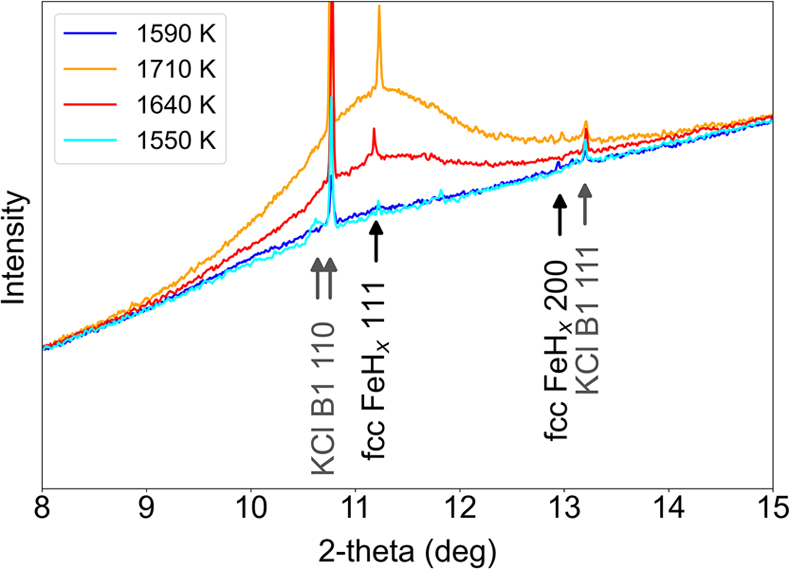
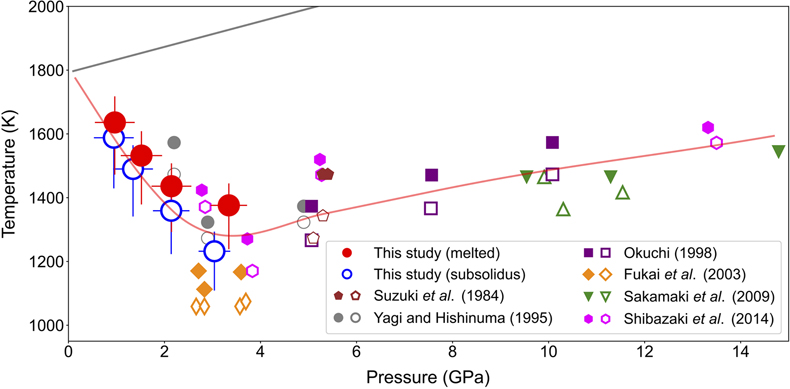
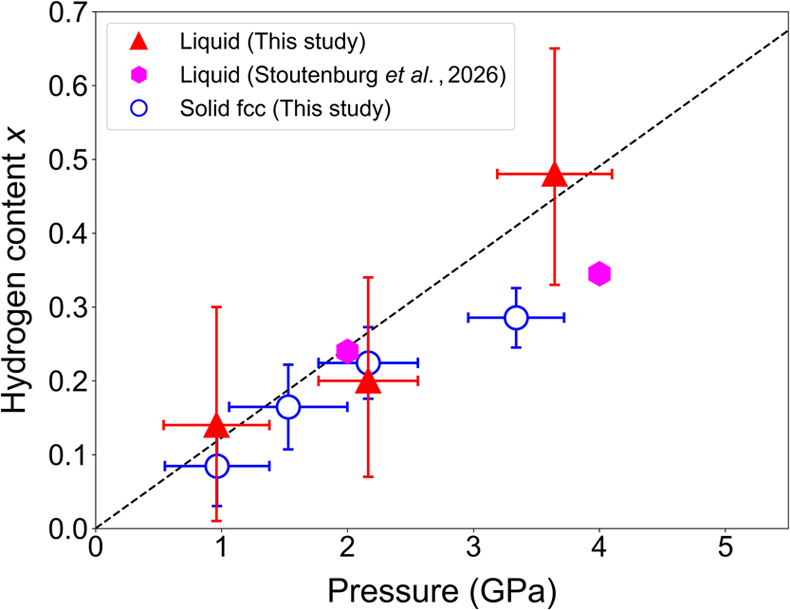
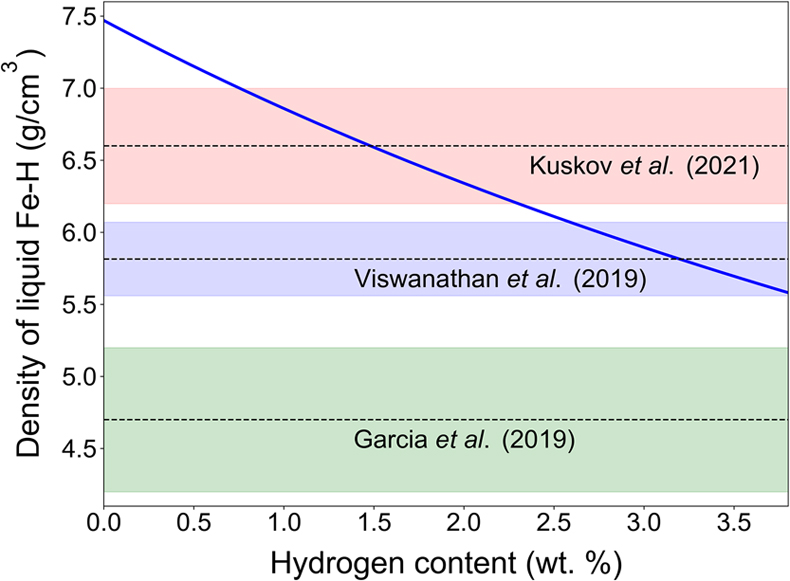
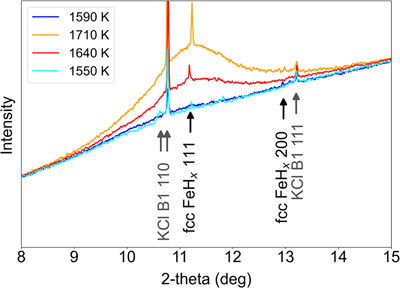 Figure 1 XRD patterns obtained from run #1 (spot #1-2) at 1.0 GPa (textured Fe peaks were masked to show diffuse scattering from molten Fe-H). The diffuse scattering signals indicative of melting appeared when sample temperature was increased from 1590 K (blue) to 1710 K (orange) and were still present when temperature was reduced to 1640 K (red). Then they disappeared upon cooling to 1550 K (cyan). | 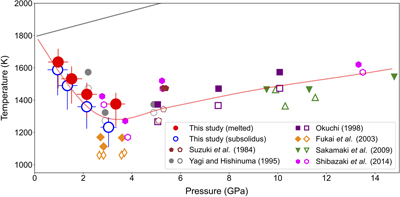 Figure 2 Melting curve of FeHx (0 < x < 1) (red line). The grey line represents the melting curve of pure Fe (Strong et al., 1973). | 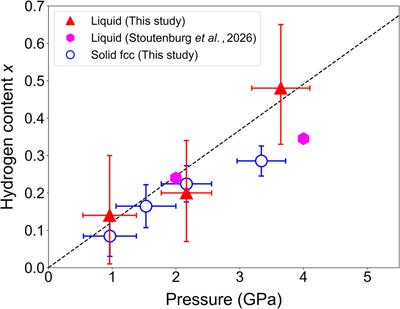 Figure 3 The hydrogen contents of fcc FeHx immediately above the solidus and of liquid FeHx at higher temperatures in this study. The theoretical predictions of those in liquid by Stoutenburg et al. (2026) at 1500 K are also shown. Considering a minimal solubility at 1 bar, the hydrogen solubility into liquid Fe is approximately linearly enhanced with pressure (broken line). | 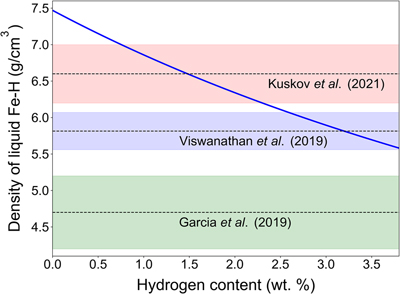 Figure 4 Density of liquid FeHx as a function of hydrogen concentration at 5 GPa and 1700 K. The density of liquid pure Fe is from Kuwayama et al. (2020), and density reduction with increasing hydrogen content is calculated with ΔVH = 2.22 Å3. The solubility limit of hydrogen into liquid iron is estimated to be 0.6–1.1 wt. % at the base of the LMO and at the core-mantle boundary. Metal-silicate partitioning suggests 0.3–1.8 wt. % H in the core. These amounts of hydrogen account for the lunar core density estimated by Kuskov et al. (2021), while other light elements such as sulfur and carbon are required for earlier estimates by Garcia et al. (2019) and Viswanathan et al. (2019). |
| Figure 1 | Figure 2 | Figure 3 | Figure 4 |
top
Introduction
Geophysical constraints on the lunar interior indicate that the density of its core is a few percent up to ∼40 % lower than that of pure iron (e.g., Garcia et al., 2019
Garcia, R.F., Khan, A., Drilleau, M., Margerin, L., Kawamura, T., Sun, D., Wieczorek, M.A., Rivoldini, A., Nunn, C., Weber, R.C., Marusiak, A.G., Lognonné, P., Nakamura, Y., Zhu, P. (2019) Lunar seismology: an update on interior structure models. Space Science Reviews 215, 50. https://doi.org/10.1007/s11214-019-0613-y
; Viswanathan et al., 2019Viswanathan, V., Rambaux, N., Fienga, A., Laskar, J., Gastineau, M. (2019) Observational constraint on the radius and oblateness of the lunar core-mantle boundary. Geophysical Research Letters 46, 7295–7303. https://doi.org/10.1029/2019GL082677
; Kuskov et al., 2021Kuskov, O.L., Kronrod, E.V., Matsumoto, K., Kronrod, V.A. (2021) Physical properties and internal structure of the central region of the Moon. Geochemistry International 59, 1018–1037. https://doi.org/10.1134/S0016702921110069
; Zhao et al., 2023Zhao, B., Morard, G., Boulard, E., Boccato, S., Siersch, N.C., Rivoldini, A., Guignot, N., Henry, L., King, A., Zurkowski, C., Fei, Y., Antonangeli, D. (2023) Local structure and density of liquid Fe-C-S alloys at Moon’s core conditions. Journal of Geophysical Research: Planets 128, e2022JE007577. https://doi.org/10.1029/2022JE007577
). Such density deficit requires the presence of substantial amounts of light elements in the metallic core, and sulfur and carbon have often been regarded as possible light alloy elements (e.g., Jing et al., 2014Jing, Z., Wang, Y., Kono, Y., Yu, T., Sakamaki, T., Park, C., Rivers, M.L., Sutton, S.R., Shen, G. (2014) Sound velocity of Fe–S liquids at high pressure: implications for the Moon’s molten outer core. Earth and Planetary Science Letters 396, 78–87. https://doi.org/10.1016/j.epsl.2014.04.015
; Steenstra et al., 2017Steenstra, E.S., Lin, Y., Rai, N., Jansen, M., van Westrenen, W. (2017) Carbon as the dominant light element in the lunar core. American Mineralogist 102, 92–97. https://doi.org/10.2138/am-2017-5727
). In contrast, hydrogen has received comparatively less attention since stoichiometric FeH is formed from Fe and H2 only above 3.5 GPa at room temperature (Badding et al., 1991Badding, J.V., Hemley, R.J., Mao, H.K. (1991) High-pressure chemistry of hydrogen in metals: in situ study of iron hydride. Science 253, 421–424. https://doi.org/10.1126/science.253.5018.421
). Indeed, hydrogen was assumed to be poorly soluble into iron below ∼3 GPa in recent core formation modelling (Tagawa et al., 2021Tagawa, S., Sakamoto, N., Hirose, K., Yokoo, S., Hernlund, J., Ohishi, Y., Yurimoto, H. (2021) Experimental evidence for hydrogen incorporation into Earth’s core. Nature Communications 12, 2588. https://doi.org/10.1038/s41467-021-22035-0
; Tsutsumi et al., 2025Tsutsumi, Y., Sakamoto, N., Hirose, K., Mita, S., Yokoo, S., Hsu, H., Yurimoto, H. (2025) Origin of Earth’s hydrogen and carbon constrained by their core-mantle partitioning and bulk Earth abundance. Nature Communications 16, 10038. https://doi.org/10.1038/s41467-025-65729-5
).Only a limited number of high pressure and temperature (P-T) experiments were previously reported on the Fe-H system below 3 GPa. All neutron diffraction measurements on Fe-H alloys have been carried out at pressures of ∼3 GPa, and at temperatures far below the onset of melting (e.g., Iizuka-Oku et al., 2017
Iizuka-Oku, R., Yagi, T., Gotou, H., Okuchi, T., Hattori, T., Sano-Furukawa, A. (2017) Hydrogenation of iron in the early stage of Earth’s evolution. Nature Communications 8, 14096. https://doi.org/10.1038/ncomms14096
; Machida et al., 2019Machida, A., Saitoh, H., Hattori, T., Sano-Furukawa, A., Funakoshi, K.-i., Sato, T., Orimo, S.-i., Aoki, K. (2019) Hexagonal close-packed iron hydride behind the conventional phase diagram. Scientific Reports 9, 12290. https://doi.org/10.1038/s41598-019-48817-7
; Ikuta et al., 2019Ikuta, D., Ohtani, E., Sano-Furukawa, A., Shibazaki, Y., Terasaki, H., Yuan, L., Hattori, T. (2019) Interstitial hydrogen atoms in face-centered cubic iron in the Earth’s core. Scientific Reports 9, 7108. https://doi.org/10.1038/s41598-019-43601-z
). Yagi and Hishinuma (1995)Yagi, T., Hishinuma, T. (1995) Iron hydride formed by the reaction of iron, silicate, and water: implications for the light element of the Earth’s core. Geophysical Research Letters 22, 1933–1936. https://doi.org/10.1029/95GL01792
performed XRD measurements on Fe-H and determined melting temperatures at pressures down to 2.2 GPa, demonstrating a large reduction from the melting curve of Fe. Other experimental studies reported the Fe(-Ni)-H melting temperatures only above 2.7 GPa (Suzuki et al., 1984Suzuki, T., Akimoto, S.-i., Fukai, Y. (1984) The system iron-enstatite-water at high pressures and temperatures—formation of iron hydride and some geophysical implications. Physics of the Earth and Planetary Interiors 36, 135–144. https://doi.org/10.1016/0031-9201(84)90014-1
; Okuchi, 1998Okuchi, T. (1998) The melting temperature of iron hydride at high pressures and its implications for the temperature of the Earth’s core. Journal of Physics: Condensed Matter 10, 11595–11598. https://doi.org/10.1088/0953-8984/10/49/052
; Fukai et al., 2003Fukai, Y., Mori, K., Shinomiya, H. (2003) The phase diagram and superabundant vacancy formation in Fe–H alloys under high hydrogen pressures. Journal of Alloys and Compounds 348, 105–109. https://doi.org/10.1016/S0925-8388(02)00806-X
; Sakamaki et al., 2009Sakamaki, K., Takahashi, E., Nakajima, Y., Nishihara, Y., Funakoshi, K., Suzuki, T., Fukai, Y. (2009) Melting phase relation of FeHx up to 20 GPa: implication for the temperature of the Earth’s core. Physics of the Earth and Planetary Interiors 174, 192–201. https://doi.org/10.1016/j.pepi.2008.05.017
; Shibazaki et al., 2014Shibazaki, Y., Terasaki, H., Ohtani, E., Tateyama, R., Nishida, K., Funakoshi, K.-i., Higo, Y. (2014) High-pressure and high-temperature phase diagram for Fe0.9Ni0.1–H alloy. Physics of the Earth and Planetary Interiors 228, 192–201. https://doi.org/10.1016/j.pepi.2013.12.013
; Mita et al., 2025Mita, S., Tagawa, S., Hirose, K., Ikuta, N. (2025) Fe-FeH eutectic melting curve and the estimates of Earth’s core temperature and composition. Journal of Geophysical Research: Solid Earth 130, e2024JB029283. https://doi.org/10.1029/2024JB029283
).In this study, we focus on Fe-H melting experiments below ∼3 GPa to explore the enhancement of hydrogen solubility in iron with increasing pressure. The results show the clear melting temperature depression even at 1.0 GPa and higher hydrogen concentrations in liquid and solid iron at higher pressures, suggesting that hydrogen could be an important light element in metallic iron cores of small terrestrial bodies. We discuss the possible hydrogen abundance in the lunar core based on seismological constraints on its density.
top
Results
We conducted melting experiments on the Fe + H2 sample at four different P-T conditions (laser heating was performed at two separate portions of a sample in each of two independent runs) (Table S-1). In run #1, after compression under 300 K to 1.1 GPa, we first heated the sample at spot #1-1 and observed a diffuse scattering signal indicative of melting, along with the XRD peaks from face centred cubic (fcc) FeH0.16, when temperature was increased from 1490 K at 1.3 GPa to 1530 K at 1.5 GPa (Fig. 1). After quenching to 300 K, we decompressed the sample to 0.6 GPa and then heated a fresh sample portion (spot #1-2) being exposed to X-ray and laser beams. XRD data exhibited a diffuse scattering signal from liquid upon increasing temperature from 1590 K to 1710 K at 1.0 GPa. While the diffuse signal persisted, coexisting with fcc FeH0.08 upon decrease in temperature to 1640 K, it disappeared when we decreased the sample temperature to 1550 K (Fig. 1). The XRD data collected at 1710 K provided a strong diffuse scattering signal sufficient to determine the liquid density.
Figure 1 XRD patterns obtained from run #1 (spot #1-2) at 1.0 GPa (textured Fe peaks were masked to show diffuse scattering from molten Fe-H). The diffuse scattering signals indicative of melting appeared when sample temperature was increased from 1590 K (blue) to 1710 K (orange) and were still present when temperature was reduced to 1640 K (red). Then they disappeared upon cooling to 1550 K (cyan).
Similarly in run #2, we initially compressed the sample to 1.8 GPa and observed diffuse scattering upon increasing temperature from 1360 K at 2.1 GPa to 1440 K at 2.2 GPa, coexisting with fcc FeH0.22 (spot #2-1). The diffuse scattering signals disappeared when decreasing temperature from 1440 K to 1310 K. We then increased temperature to 1530 K and collected XRD data providing a strong diffuse scattering signal. Subsequently the sample was further compressed to 2.7 GPa, and a fresh sample area was heated. The diffuse scattering signals appeared when increasing temperature from 1230 K at 3.0 GPa to 1380 K at 3.3 GPa (spot #2-2), coexisting with fcc FeH0.29. We also collected an XRD pattern from this spot at 1670 K at 3.6 GPa for the analysis of liquid density.
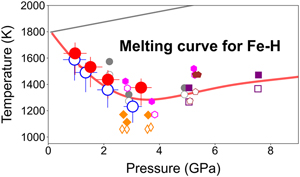
These results locate the melting (solidus) curve of Fe-H in a pressure range from 1.0 to 3.3 GPa, showing that its melting temperature decreases monotonically from ambient pressure to ∼3 GPa (Fig. 2), rather than a sudden reduction above ∼2 GPa (Yagi and Hishinuma, 1995
Yagi, T., Hishinuma, T. (1995) Iron hydride formed by the reaction of iron, silicate, and water: implications for the light element of the Earth’s core. Geophysical Research Letters 22, 1933–1936. https://doi.org/10.1029/95GL01792
; Fukai et al., 2003Fukai, Y., Mori, K., Shinomiya, H. (2003) The phase diagram and superabundant vacancy formation in Fe–H alloys under high hydrogen pressures. Journal of Alloys and Compounds 348, 105–109. https://doi.org/10.1016/S0925-8388(02)00806-X
). Earlier studies attributed such melting temperature drop to a change in the subsolidus phase from body centred cubic (bcc) to fcc at ∼2 GPa (Fukai et al., 2003Fukai, Y., Mori, K., Shinomiya, H. (2003) The phase diagram and superabundant vacancy formation in Fe–H alloys under high hydrogen pressures. Journal of Alloys and Compounds 348, 105–109. https://doi.org/10.1016/S0925-8388(02)00806-X
; Shibazaki et al., 2014Shibazaki, Y., Terasaki, H., Ohtani, E., Tateyama, R., Nishida, K., Funakoshi, K.-i., Higo, Y. (2014) High-pressure and high-temperature phase diagram for Fe0.9Ni0.1–H alloy. Physics of the Earth and Planetary Interiors 228, 192–201. https://doi.org/10.1016/j.pepi.2013.12.013
), but the present experiments demonstrate that liquid Fe-H coexists with fcc and the melting temperature is depressed already at 1.0 GPa.Figure 2 Melting curve of FeHx (0 < x < 1) (red line). The grey line represents the melting curve of pure Fe (Strong et al., 1973
Strong, H.M., Tuft, R.E., Hanneman, R.E. (1973) The iron fusion curve and γ-δ-l triple point. Metallurgical Transactions 4, 2657–2661. https://doi.org/10.1007/BF02644272
).We obtained hydrogen concentrations x in solid fcc FeHx from XRD data collected at temperatures above the melting (solidus) curve and estimated liquid compositions at higher temperatures, where diffuse scattering signals were sufficiently intense for reliable density analysis (Fig. 3, Table S-1). The estimate of hydrogen abundance in the solids was based on the observed volume expansion of FeHx with respect to Fe (see Experimental Methods in Supplementary Information). For the liquids, we first estimated the density of liquid FeHx from diffuse scattering signals (Kuwayama et al., 2020
Kuwayama, Y., Morard, G., Nakajima, Y., Hirose, K., Baron, A.Q.R., Kawaguchi, S.I., Tsuchiya, T., Ishikawa, D., Hirao, N., Ohishi, Y. (2020) Equation of state of liquid iron under extreme conditions. Physical Review Letters 124, 165701. https://doi.org/10.1103/PhysRevLett.124.165701
; Fu et al., 2025Fu, S., Hirose, K., Yokoo, S., Sakai, F., Oka, K. (2025) Hydrogen in the Earth’s outer core from density measurements of liquid Fe-H up to 102 GPa and 4,100 K. Journal of Geophysical Research: Solid Earth 130, e2025JB031934. https://doi.org/10.1029/2025JB031934
). Subsequently the volume of liquid pure Fe at an identical P-T condition was calculated using its thermal equation of state (Kuwayama et al., 2020Kuwayama, Y., Morard, G., Nakajima, Y., Hirose, K., Baron, A.Q.R., Kawaguchi, S.I., Tsuchiya, T., Ishikawa, D., Hirao, N., Ohishi, Y. (2020) Equation of state of liquid iron under extreme conditions. Physical Review Letters 124, 165701. https://doi.org/10.1103/PhysRevLett.124.165701
). The volume expansion of liquid Fe-H relative to liquid pure Fe is attributed to hydrogen incorporation and converted to the hydrogen content. Hydrogen concentration in liquid FeHx increased from x = 0.14 at 1.0 GPa to 0.48 at 3.6 GPa. The increase in the hydrogen abundance in liquid with increasing pressure is supported by the shift of the first peak position in structure factor S(Q) (Fig. S-1). The first peak position decreased with increasing hydrogen concentration upon pressure increase. Since experiments were performed under H2 saturated conditions, the resulting values correspond to the hydrogen solubility limit in liquid iron at each pressure.Figure 3 The hydrogen contents of fcc FeHx immediately above the solidus and of liquid FeHx at higher temperatures in this study. The theoretical predictions of those in liquid by Stoutenburg et al. (2026)
Stoutenburg, E.R., Caracas, R., Campbell, A.J. (2026) Immiscibility between hydrogen and molten iron in planetary cores. Earth and Planetary Science Letters 678, 119851. https://doi.org/10.1016/j.epsl.2026.119851
at 1500 K are also shown. Considering a minimal solubility at 1 bar, the hydrogen solubility into liquid Fe is approximately linearly enhanced with pressure (broken line).top
Discussion
Melting phase diagram of Fe-H at low pressures. The present experiments demonstrate that the melting temperature in the Fe-H system decreases with increasing pressure from <1 GPa to ∼3 GPa (Fig. 2). The magnitude of depression from the Fe melting curve is enhanced almost linearly with increasing pressure; ∼240 K at 1 GPa, ∼450 K at 2 GPa, and ∼580 K at 3 GPa. This is explained by an increase in the solubility of hydrogen primarily into liquid iron with increasing pressure to ∼3 GPa as evidenced by the XRD measurements (Fig. 3). Note that while the solubility of hydrogen into iron is enhanced with increasing pressure and temperature (Fukai and Suzuki, 1986
Fukai, Y., Suzuki, T. (1986) Iron-water reaction under high pressure and its implication in the evolution of the Earth. Journal of Geophysical Research: Solid Earth 91, 9222–9230. https://doi.org/10.1029/JB091iB09p09222
), the pressure effect is much more significant in a limited temperature range relevant to this study.The pressure evolution of the Fe-H melting phase diagram is illustrated in Figure S-2, in which we consider that the hydrogen solubility into liquid iron (excess hydrogen is present as liquid H2) increases approximately linearly with pressure to ∼3 GPa, and accordingly the depression of eutectic temperature (above which metallic liquid is formed) from the Fe melting curve is also linearly enhanced with pressure. Earlier experiments reported that the Fe-H melting temperature conversely rises above ∼3.5 GPa (Yagi and Hishinuma, 1995
Yagi, T., Hishinuma, T. (1995) Iron hydride formed by the reaction of iron, silicate, and water: implications for the light element of the Earth’s core. Geophysical Research Letters 22, 1933–1936. https://doi.org/10.1029/95GL01792
; Okuchi, 1998Okuchi, T. (1998) The melting temperature of iron hydride at high pressures and its implications for the temperature of the Earth’s core. Journal of Physics: Condensed Matter 10, 11595–11598. https://doi.org/10.1088/0953-8984/10/49/052
) (Fig. 2). It could be a consequence of a rapid increase in the hydrogen solubility into fcc Fe (Fig. S-2), which is inferred from the formation of stoichiometric FeH above that pressure at 300 K (Badding et al., 1991Badding, J.V., Hemley, R.J., Mao, H.K. (1991) High-pressure chemistry of hydrogen in metals: in situ study of iron hydride. Science 253, 421–424. https://doi.org/10.1126/science.253.5018.421
).Possible hydrogen abundance in the lunar core. The present experiments demonstrate the depression of melting temperature of iron by ∼240 K even at 1.0 GPa in the presence of excess H2, suggesting that liquid iron can incorporate hydrogen not at ambient pressure but certainly under lower pressures than previously thought. While recent planetary accretion and core formation modelling assumed that hydrogen is not soluble into core forming metals below 3 GPa (Tagawa et al., 2021
Tagawa, S., Sakamoto, N., Hirose, K., Yokoo, S., Hernlund, J., Ohishi, Y., Yurimoto, H. (2021) Experimental evidence for hydrogen incorporation into Earth’s core. Nature Communications 12, 2588. https://doi.org/10.1038/s41467-021-22035-0
; Tsutsumi et al., 2025Tsutsumi, Y., Sakamoto, N., Hirose, K., Mita, S., Yokoo, S., Hsu, H., Yurimoto, H. (2025) Origin of Earth’s hydrogen and carbon constrained by their core-mantle partitioning and bulk Earth abundance. Nature Communications 16, 10038. https://doi.org/10.1038/s41467-025-65729-5
), it is possible that metallic cores of small rocky bodies such as our moon also include some hydrogen. Indeed, the moon should have been covered with the protolunar disk gas, and therefore a lunar magma ocean (LMO) likely included a certain amount of water, most of which could have been later incorporated as hydrogen into core forming iron metals.The depth of the LMO has been estimated to be 600 km, which explains the crustal thickness when all plagioclase crystallising from the LMO formed the crust (Charlier et al., 2018
Charlier, B., Grove, T.L., Namur, O., Holtz, F. (2018) Crystallization of the lunar magma ocean and the primordial mantle–crust differentiation of the Moon. Geochimica et Cosmochimica Acta 234, 50–69. https://doi.org/10.1016/j.gca.2018.05.006
). It is possible that the lunar core formation (in other words, core metal segregation from silicate) took place at its bottom under 2.8 GPa. On the other hand, Rai and van Westrenen (2014)Rai, N., van Westrenen, W. (2014) Lunar core formation: new constraints from metal–silicate partitioning of siderophile elements. Earth and Planetary Science Letters 388, 343–352. https://doi.org/10.1016/j.epsl.2013.12.001
found that core metal may have reached chemical equilibrium with silicate at 4.5 ± 0.5 GPa and 2163 K, which most likely matches the pressure at the core-mantle boundary. Furthermore, a more recent study suggested a much higher temperature of ∼3200 K for the lunar core formation at 5 GPa in the case of an Fe-Ni core (Steenstra et al., 2020Steenstra, E.S., Berndt, J., Klemme, S., Fei, Y., van Westrenen, W. (2020) A possible high-temperature origin of the Moon and its geochemical consequences. Earth and Planetary Science Letters 538, 116222. https://doi.org/10.1016/j.epsl.2020.116222
). Here we consider the representative lunar core pressure to be 5 GPa. The present day core temperature may be about 1700 K (Garcia et al., 2019Garcia, R.F., Khan, A., Drilleau, M., Margerin, L., Kawamura, T., Sun, D., Wieczorek, M.A., Rivoldini, A., Nunn, C., Weber, R.C., Marusiak, A.G., Lognonné, P., Nakamura, Y., Zhu, P. (2019) Lunar seismology: an update on interior structure models. Space Science Reviews 215, 50. https://doi.org/10.1007/s11214-019-0613-y
; Kuskov et al., 2021Kuskov, O.L., Kronrod, E.V., Matsumoto, K., Kronrod, V.A. (2021) Physical properties and internal structure of the central region of the Moon. Geochemistry International 59, 1018–1037. https://doi.org/10.1134/S0016702921110069
), which is well above the solidus temperature of the Fe-H system at 5 GPa (Fig. 2).The solubility of hydrogen in liquid iron at 2.8 GPa or 5 GPa may limit its concentration in the lunar core. Considering that the reduction in Fe-H melting temperature with increasing pressure to ∼3 GPa is primarily caused by the pressure induced enhancement of hydrogen solubility into liquid iron (see above), the hydrogen content in liquid iron at the melting (solidus) temperature will correspond to the solubility limit. Our results (Fig. 3) suggest that the hydrogen solubility limit in liquid iron may be x = 0.34 and 0.61 in FeHx (0.6 and 1.1 wt. % H) at 2.8 and 5 GPa, respectively.
As an independent estimate, we can also calculate the possible hydrogen content in the lunar core based on its metal-silicate partitioning under core formation conditions. Water concentration in the bulk silicate moon (BSM) has been estimated from the analyses of lunar volcanic glasses. Hauri et al. (2015)
Hauri, E.H., Saal, A.E., Rutherford, M.J., Van Orman, J.A. (2015) Water in the Moon’s interior: truth and consequences. Earth and Planetary Science Letters 409, 252–264. https://doi.org/10.1016/j.epsl.2014.10.053
found that the BSM is similar in highly volatile element composition to the depleted MORB source mantle of the Earth, giving 133–292 μg/g H2O in the BSM. The magma ocean models by Elkins-Tanton and Grove (2011)Elkins-Tanton, L.T., Grove, T.L. (2011) Water (hydrogen) in the lunar mantle: results from petrology and magma ocean modeling. Earth and Planetary Science Letters 307, 173–179. https://doi.org/10.1016/j.epsl.2011.04.027
demonstrated that the LMO should have contained 100 to >1000 μg/g water when the later melting source region for such volcanic glasses includes 10 to 200 μg/g water. Also, Lin et al. (2020)Lin, Y., Hui, H., Xia, X., Shang, S., van Westrenen, W. (2020) Experimental constraints on the solidification of a hydrous lunar magma ocean. Meteoritics & Planetary Science 55, 207–230. https://doi.org/10.1111/maps.13425
argued that the lunar crustal thickness (the amount of plagioclase) is controlled by water abundance in the LMO, which may be ∼300 μg/g H2O if the LMO was 700 km deep. Hydrogen incorporation from silicate melt into core forming metals has been investigated under high pressures (Clesi et al., 2018Clesi, V., Bouhifd, M.A., Bolfan-Casanova, N., Manthilake, G., Schiavi, F., Raepsaet, C., Bureau, H., Khodja, H., Andrault, D. (2018) Low hydrogen contents in the cores of terrestrial planets. Science Advances 4, e1701876. https://doi.org/10.1126/sciadv.1701876
; Malavergne et al., 2019Malavergne, V., Bureau, H., Raepsaet, C., Gaillard, F., Poncet, M., Surblé, S., Sifré, D., Shcheka, S., Fourdrin, C., Deldicque, D., Khodja, H. (2019) Experimental constraints on the fate of H and C during planetary core-mantle differentiation. Implications for the Earth. Icarus 321, 473–485. https://doi.org/10.1016/j.icarus.2018.11.027
; Tagawa et al., 2021Tagawa, S., Sakamoto, N., Hirose, K., Yokoo, S., Hernlund, J., Ohishi, Y., Yurimoto, H. (2021) Experimental evidence for hydrogen incorporation into Earth’s core. Nature Communications 12, 2588. https://doi.org/10.1038/s41467-021-22035-0
; Tsutsumi et al., 2025Tsutsumi, Y., Sakamoto, N., Hirose, K., Mita, S., Yokoo, S., Hsu, H., Yurimoto, H. (2025) Origin of Earth’s hydrogen and carbon constrained by their core-mantle partitioning and bulk Earth abundance. Nature Communications 16, 10038. https://doi.org/10.1038/s41467-025-65729-5
). Under plausible conditions of the lunar core formation of 2.8 GPa, 2163 K, and oxygen fugacity relative to the iron-wüstite buffer ΔIW = −2 (Rai and van Westrenen, 2014Rai, N., van Westrenen, W. (2014) Lunar core formation: new constraints from metal–silicate partitioning of siderophile elements. Earth and Planetary Science Letters 388, 343–352. https://doi.org/10.1016/j.epsl.2013.12.001
), the partition coefficient of hydrogen DHmetal/silicate is 1.11 × 10² (molar basis) according to Tsutsumi et al. (2025)Tsutsumi, Y., Sakamoto, N., Hirose, K., Mita, S., Yokoo, S., Hsu, H., Yurimoto, H. (2025) Origin of Earth’s hydrogen and carbon constrained by their core-mantle partitioning and bulk Earth abundance. Nature Communications 16, 10038. https://doi.org/10.1038/s41467-025-65729-5
(Fig. S-3). We also obtained DHmetal/silicate = 1.05 × 10² at 5 GPa and 2200 K (based on the liquidus temperature estimate by Rai and van Westrenen, 2014Rai, N., van Westrenen, W. (2014) Lunar core formation: new constraints from metal–silicate partitioning of siderophile elements. Earth and Planetary Science Letters 388, 343–352. https://doi.org/10.1016/j.epsl.2013.12.001
) and 1.85 × 10² at 3200 K (from the high temperature core formation model by Steenstra et al., 2020Steenstra, E.S., Berndt, J., Klemme, S., Fei, Y., van Westrenen, W. (2020) A possible high-temperature origin of the Moon and its geochemical consequences. Earth and Planetary Science Letters 538, 116222. https://doi.org/10.1016/j.epsl.2020.116222
). Even with 300 μg/g H2O (34 μg/g H) in the LMO (Lin et al., 2020Lin, Y., Hui, H., Xia, X., Shang, S., van Westrenen, W. (2020) Experimental constraints on the solidification of a hydrous lunar magma ocean. Meteoritics & Planetary Science 55, 207–230. https://doi.org/10.1111/maps.13425
), the metal-silicate partitioning predicts ∼0.3 wt. % H in the lunar core when it occurred at both 2.8 GPa/2163 K and 5 GPa/2200 K and ∼0.6 wt. % H at 5 GPa/3200 K. If instead the LMO included 1000 μg/g H2O (111 μg/g H) at the time of the core formation, core hydrogen concentration could be as high as ∼1.1 wt. % and ∼1.8 wt. % H at respective core formation conditions (see Table S-2, and Calculations of Metal-Silicate Partitioning of Hydrogen in Supplementary Information).Is hydrogen a major light element in the lunar core? The density of the lunar core has been modelled to be 4200–5200 kg/m3 by Garcia et al. (2019)
Garcia, R.F., Khan, A., Drilleau, M., Margerin, L., Kawamura, T., Sun, D., Wieczorek, M.A., Rivoldini, A., Nunn, C., Weber, R.C., Marusiak, A.G., Lognonné, P., Nakamura, Y., Zhu, P. (2019) Lunar seismology: an update on interior structure models. Space Science Reviews 215, 50. https://doi.org/10.1007/s11214-019-0613-y
and 5560–6070 kg/m3 by Viswanathan et al. (2019)Viswanathan, V., Rambaux, N., Fienga, A., Laskar, J., Gastineau, M. (2019) Observational constraint on the radius and oblateness of the lunar core-mantle boundary. Geophysical Research Letters 46, 7295–7303. https://doi.org/10.1029/2019GL082677
assuming homogeneous liquid core. The more recent work by Kuskov et al. (2021)Kuskov, O.L., Kronrod, E.V., Matsumoto, K., Kronrod, V.A. (2021) Physical properties and internal structure of the central region of the Moon. Geochemistry International 59, 1018–1037. https://doi.org/10.1134/S0016702921110069
proposed a higher density range of 6200–7000 kg/m3 for the liquid core, considering the outer liquid and inner solid cores (Fig. 4).Figure 4 Density of liquid FeHx as a function of hydrogen concentration at 5 GPa and 1700 K. The density of liquid pure Fe is from Kuwayama et al. (2020)
Kuwayama, Y., Morard, G., Nakajima, Y., Hirose, K., Baron, A.Q.R., Kawaguchi, S.I., Tsuchiya, T., Ishikawa, D., Hirao, N., Ohishi, Y. (2020) Equation of state of liquid iron under extreme conditions. Physical Review Letters 124, 165701. https://doi.org/10.1103/PhysRevLett.124.165701
, and density reduction with increasing hydrogen content is calculated with ΔVH = 2.22 Å3. The solubility limit of hydrogen into liquid iron is estimated to be 0.6–1.1 wt. % at the base of the LMO and at the core-mantle boundary. Metal-silicate partitioning suggests 0.3–1.8 wt. % H in the core. These amounts of hydrogen account for the lunar core density estimated by Kuskov et al. (2021)Kuskov, O.L., Kronrod, E.V., Matsumoto, K., Kronrod, V.A. (2021) Physical properties and internal structure of the central region of the Moon. Geochemistry International 59, 1018–1037. https://doi.org/10.1134/S0016702921110069
, while other light elements such as sulfur and carbon are required for earlier estimates by Garcia et al. (2019)Garcia, R.F., Khan, A., Drilleau, M., Margerin, L., Kawamura, T., Sun, D., Wieczorek, M.A., Rivoldini, A., Nunn, C., Weber, R.C., Marusiak, A.G., Lognonné, P., Nakamura, Y., Zhu, P. (2019) Lunar seismology: an update on interior structure models. Space Science Reviews 215, 50. https://doi.org/10.1007/s11214-019-0613-y
and Viswanathan et al. (2019)Viswanathan, V., Rambaux, N., Fienga, A., Laskar, J., Gastineau, M. (2019) Observational constraint on the radius and oblateness of the lunar core-mantle boundary. Geophysical Research Letters 46, 7295–7303. https://doi.org/10.1029/2019GL082677
.We calculated the density of liquid Fe-H by considering the volume expansion due to the incorporation of hydrogen atoms into iron (Fig. 4). The maximum 0.6–1.1 wt. % H in the lunar core based on the hydrogen solubility limit reconciles within uncertainty the lunar liquid core density deficit estimated by Kuskov et al. (2021)
Kuskov, O.L., Kronrod, E.V., Matsumoto, K., Kronrod, V.A. (2021) Physical properties and internal structure of the central region of the Moon. Geochemistry International 59, 1018–1037. https://doi.org/10.1134/S0016702921110069
with hydrogen alone, although it is not enough for the lower densities proposed earlier by Garcia et al. (2019)Garcia, R.F., Khan, A., Drilleau, M., Margerin, L., Kawamura, T., Sun, D., Wieczorek, M.A., Rivoldini, A., Nunn, C., Weber, R.C., Marusiak, A.G., Lognonné, P., Nakamura, Y., Zhu, P. (2019) Lunar seismology: an update on interior structure models. Space Science Reviews 215, 50. https://doi.org/10.1007/s11214-019-0613-y
and Viswanathan et al. (2019)Viswanathan, V., Rambaux, N., Fienga, A., Laskar, J., Gastineau, M. (2019) Observational constraint on the radius and oblateness of the lunar core-mantle boundary. Geophysical Research Letters 46, 7295–7303. https://doi.org/10.1029/2019GL082677
. Furthermore, if the metal-silicate chemical equilibrium was attained at the bottom of the LMO, our estimate of 0.3–1.8 wt. % H in the core can explain the observed density within its large uncertainty (Kuskov et al., 2021Kuskov, O.L., Kronrod, E.V., Matsumoto, K., Kronrod, V.A. (2021) Physical properties and internal structure of the central region of the Moon. Geochemistry International 59, 1018–1037. https://doi.org/10.1134/S0016702921110069
). It is noted, however, that these estimates do not exclude the possible coexistence of other light elements such as carbon and sulfur in the lunar core.Not only density but also sound velocity provides an important constraint on the lunar core composition. Fu et al. (2025)
Fu, S., Hirose, K., Yokoo, S., Sakai, F., Oka, K. (2025) Hydrogen in the Earth’s outer core from density measurements of liquid Fe-H up to 102 GPa and 4,100 K. Journal of Geophysical Research: Solid Earth 130, e2025JB031934. https://doi.org/10.1029/2025JB031934
based on experiments above 27 GPa showed that hydrogen incorporation increases the velocity of liquid Fe. In contrast, Nishida et al. (2020)Nishida, K., Shibazaki, Y., Terasaki, H., Higo, Y., Suzuki, A., Funamori, N., Hirose, K. (2020) Effect of sulfur on sound velocity of liquid iron under Martian core conditions. Nature Communications 11, 1954. https://doi.org/10.1038/s41467-020-15755-2
suggested that sulfur strongly reduces the velocity of liquid iron under lunar core conditions. Thus, the relatively low compressional wave velocity (VP) inferred for the lunar core (Weber et al., 2011Weber, R.C., Lin, P.-Y., Garnero, E.J., Williams, Q., Lognonné, P. (2011) Seismic detection of the lunar core. Science 331, 309–312. https://doi.org/10.1126/science.1199375
) may require light elements such as sulfur. We note, however, that the sound velocity of Fe-H liquids remains poorly known at the lunar core pressure. Recent theoretical calculations found non-ideal mixing behaviour of Fe-H liquids under the lunar core pressures (Stoutenburg et al., 2026Stoutenburg, E.R., Caracas, R., Campbell, A.J. (2026) Immiscibility between hydrogen and molten iron in planetary cores. Earth and Planetary Science Letters 678, 119851. https://doi.org/10.1016/j.epsl.2026.119851
), possibly lowering their sound velocity. Indeed, the calculations by van Driel et al. (2025)van Driel, J., Vočadlo, L., Brodholt, J. (2025) Thermodynamics of Fe-S-O-C-H liquids: implications for the Martian core. Earth and Planetary Science Letters 668, 119540. https://doi.org/10.1016/j.epsl.2025.119540
showed that VP is faster for liquid Fe-H than for pure Fe above 20 GPa but the difference is smaller at lower pressures, suggesting a possibility that hydrogen reduces the sound velocity of liquid Fe at 5 GPa.These results suggest that hydrogen could be, at least, a major light element in the lunar core. Sulfur and carbon have previously been proposed to be important lunar core light elements, but we note that their solubilities into solid iron coexisting with liquid alloy are limited only to <0.5 wt. % S and 1.5 wt. % C at 5 GPa (Li et al., 2001
Li, J., Fei, Y., Mao, H.K., Hirose, K., Shieh, S.R. (2001) Sulfur in the Earth’s inner core. Earth and Planetary Science Letters 193, 509–514. https://doi.org/10.1016/S0012-821X(01)00521-0
; Fei and Brosh, 2014Fei, Y., Brosh, E. (2014) Experimental study and thermodynamic calculations of phase relations in the Fe–C system at high pressure. Earth and Planetary Science Letters 408, 155–162. https://doi.org/10.1016/j.epsl.2014.09.044
). This indicates that if the lunar solid inner core also exhibits a definite density deficit with respect to iron beyond the solubilities of sulfur and carbon, hydrogen is certainly an important lunar core light element.top
Acknowledgements
We thank two anonymous reviewers whose comments were valuable to improve the manuscript. H. Kadobayashi and N. Hirao are acknowledged for their assistance in the synchrotron experiments and high-pressure gas loading at SPring-8 (proposals no. 2023B0306, 2025A1133 and 2025B1212). Discussion with S. Yokoo was helpful. This work was supported by the JSPS grant 21H04968 and 26H02080 to K. Hirose.
Editor: Raul O.C. Fonseca
top
References
Badding, J.V., Hemley, R.J., Mao, H.K. (1991) High-pressure chemistry of hydrogen in metals: in situ study of iron hydride. Science 253, 421–424. https://doi.org/10.1126/science.253.5018.421
 Show in context
 In contrast, hydrogen has received comparatively less attention since stoichiometric FeH is formed from Fe and H2 only above 3.5 GPa at room temperature (Badding et al., 1991).
View in article
It could be a consequence of a rapid increase in the hydrogen solubility into fcc Fe (
View in article
Charlier, B., Grove, T.L., Namur, O., Holtz, F. (2018) Crystallization of the lunar magma ocean and the primordial mantle–crust differentiation of the Moon. Geochimica et Cosmochimica Acta 234, 50–69. https://doi.org/10.1016/j.gca.2018.05.006
Show in context The depth of the LMO has been estimated to be 600 km, which explains the crustal thickness when all plagioclase crystallising from the LMO formed the crust (Charlier et al., 2018).
View in article
Clesi, V., Bouhifd, M.A., Bolfan-Casanova, N., Manthilake, G., Schiavi, F., Raepsaet, C., Bureau, H., Khodja, H., Andrault, D. (2018) Low hydrogen contents in the cores of terrestrial planets. Science Advances 4, e1701876. https://doi.org/10.1126/sciadv.1701876
Show in context Hydrogen incorporation from silicate melt into core forming metals has been investigated under high pressures (Clesi et al., 2018; Malavergne et al., 2019; Tagawa et al., 2021; Tsutsumi et al., 2025).
View in article
Elkins-Tanton, L.T., Grove, T.L. (2011) Water (hydrogen) in the lunar mantle: results from petrology and magma ocean modeling. Earth and Planetary Science Letters 307, 173–179. https://doi.org/10.1016/j.epsl.2011.04.027
Show in context The magma ocean models by Elkins-Tanton and Grove (2011) demonstrated that the LMO should have contained 100 to >1000 μg/g water when the later melting source region for such volcanic glasses includes 10 to 200 μg/g water.
View in article
Fei, Y., Brosh, E. (2014) Experimental study and thermodynamic calculations of phase relations in the Fe–C system at high pressure. Earth and Planetary Science Letters 408, 155–162. https://doi.org/10.1016/j.epsl.2014.09.044
Show in context Sulfur and carbon have previously been proposed to be important lunar core light elements, but we note that their solubilities into solid iron coexisting with liquid alloy are limited only to <0.5 wt. % S and 1.5 wt. % C at 5 GPa (Li et al., 2001; Fei and Brosh, 2014).
View in article
Fu, S., Hirose, K., Yokoo, S., Sakai, F., Oka, K. (2025) Hydrogen in the Earth’s outer core from density measurements of liquid Fe-H up to 102 GPa and 4,100 K. Journal of Geophysical Research: Solid Earth 130, e2025JB031934. https://doi.org/10.1029/2025JB031934
Show in context For the liquids, we first estimated the density of liquid FeHx from diffuse scattering signals (Kuwayama et al., 2020; Fu et al., 2025).
View in article
Fu et al. (2025) based on experiments above 27 GPa showed that hydrogen incorporation increases the velocity of liquid Fe.
View in article
Fukai, Y., Suzuki, T. (1986) Iron-water reaction under high pressure and its implication in the evolution of the Earth. Journal of Geophysical Research: Solid Earth 91, 9222–9230. https://doi.org/10.1029/JB091iB09p09222
Show in context Note that while the solubility of hydrogen into iron is enhanced with increasing pressure and temperature (Fukai and Suzuki, 1986), the pressure effect is much more significant in a limited temperature range relevant to this study.
View in article
Fukai, Y., Mori, K., Shinomiya, H. (2003) The phase diagram and superabundant vacancy formation in Fe–H alloys under high hydrogen pressures. Journal of Alloys and Compounds 348, 105–109. https://doi.org/10.1016/S0925-8388(02)00806-X
Show in context Other experimental studies reported the Fe(-Ni)-H melting temperatures only above 2.7 GPa (Suzuki et al., 1984; Okuchi, 1998; Fukai et al., 2003; Sakamaki et al., 2009; Shibazaki et al., 2014; Mita et al., 2025).
View in article
These results locate the melting (solidus) curve of Fe-H in a pressure range from 1.0 to 3.3 GPa, showing that its melting temperature decreases monotonically from ambient pressure to ∼3 GPa (Fig. 2), rather than a sudden reduction above ∼2 GPa (Yagi and Hishinuma, 1995; Fukai et al., 2003).
View in article
Earlier studies attributed such melting temperature drop to a change in the subsolidus phase from body centred cubic (bcc) to fcc at ∼2 GPa (Fukai et al., 2003; Shibazaki et al., 2014), but the present experiments demonstrate that liquid Fe-H coexists with fcc and the melting temperature is depressed already at 1.0 GPa.
View in article
Garcia, R.F., Khan, A., Drilleau, M., Margerin, L., Kawamura, T., Sun, D., Wieczorek, M.A., Rivoldini, A., Nunn, C., Weber, R.C., Marusiak, A.G., Lognonné, P., Nakamura, Y., Zhu, P. (2019) Lunar seismology: an update on interior structure models. Space Science Reviews 215, 50. https://doi.org/10.1007/s11214-019-0613-y
Show in context Geophysical constraints on the lunar interior indicate that the density of its core is a few percent up to ∼40 % lower than that of pure iron (e.g., Garcia et al., 2019; Viswanathan et al., 2019; Kuskov et al., 2021; Zhao et al., 2023).
View in article
Here we consider the representative lunar core pressure to be 5 GPa. The present day core temperature may be about 1700 K (Garcia et al., 2019; Kuskov et al., 2021), which is well above the solidus temperature of the Fe-H system at 5 GPa (Fig. 2).
View in article
The density of the lunar core has been modelled to be 4200–5200 kg/m3 by Garcia et al. (2019) and 5560–6070 kg/m3 by Viswanathan et al. (2019) assuming homogeneous liquid core.
View in article
These amounts of hydrogen account for the lunar core density estimated by Kuskov et al. (2021), while other light elements such as sulfur and carbon are required for earlier estimates by Garcia et al. (2019) and Viswanathan et al. (2019).
View in article
The maximum 0.6–1.1 wt. % H in the lunar core based on the hydrogen solubility limit reconciles within uncertainty the lunar liquid core density deficit estimated by Kuskov et al. (2021) with hydrogen alone, although it is not enough for the lower densities proposed earlier by Garcia et al. (2019) and Viswanathan et al. (2019).
View in article
Hauri, E.H., Saal, A.E., Rutherford, M.J., Van Orman, J.A. (2015) Water in the Moon’s interior: truth and consequences. Earth and Planetary Science Letters 409, 252–264. https://doi.org/10.1016/j.epsl.2014.10.053
Show in context Hauri et al. (2015) found that the BSM is similar in highly volatile element composition to the depleted MORB source mantle of the Earth, giving 133–292 μg/g H2O in the BSM.
View in article
Iizuka-Oku, R., Yagi, T., Gotou, H., Okuchi, T., Hattori, T., Sano-Furukawa, A. (2017) Hydrogenation of iron in the early stage of Earth’s evolution. Nature Communications 8, 14096. https://doi.org/10.1038/ncomms14096
Show in context All neutron diffraction measurements on Fe-H alloys have been carried out at pressures of ∼3 GPa, and at temperatures far below the onset of melting (e.g., Iizuka-Oku et al., 2017; Machida et al., 2019; Ikuta et al., 2019).
View in article
Ikuta, D., Ohtani, E., Sano-Furukawa, A., Shibazaki, Y., Terasaki, H., Yuan, L., Hattori, T. (2019) Interstitial hydrogen atoms in face-centered cubic iron in the Earth’s core. Scientific Reports 9, 7108. https://doi.org/10.1038/s41598-019-43601-z
Show in context All neutron diffraction measurements on Fe-H alloys have been carried out at pressures of ∼3 GPa, and at temperatures far below the onset of melting (e.g., Iizuka-Oku et al., 2017; Machida et al., 2019; Ikuta et al., 2019).
View in article
Jing, Z., Wang, Y., Kono, Y., Yu, T., Sakamaki, T., Park, C., Rivers, M.L., Sutton, S.R., Shen, G. (2014) Sound velocity of Fe–S liquids at high pressure: implications for the Moon’s molten outer core. Earth and Planetary Science Letters 396, 78–87. https://doi.org/10.1016/j.epsl.2014.04.015
Show in context Such density deficit requires the presence of substantial amounts of light elements in the metallic core, and sulfur and carbon have often been regarded as possible light alloy elements (e.g., Jing et al., 2014; Steenstra et al., 2017).
View in article
Kuskov, O.L., Kronrod, E.V., Matsumoto, K., Kronrod, V.A. (2021) Physical properties and internal structure of the central region of the Moon. Geochemistry International 59, 1018–1037. https://doi.org/10.1134/S0016702921110069
Show in context Geophysical constraints on the lunar interior indicate that the density of its core is a few percent up to ∼40 % lower than that of pure iron (e.g., Garcia et al., 2019; Viswanathan et al., 2019; Kuskov et al., 2021; Zhao et al., 2023).
View in article
Here we consider the representative lunar core pressure to be 5 GPa. The present day core temperature may be about 1700 K (Garcia et al., 2019; Kuskov et al., 2021), which is well above the solidus temperature of the Fe-H system at 5 GPa (Fig. 2).
View in article
The more recent work by Kuskov et al. (2021) proposed a higher density range of 6200–7000 kg/m3 for the liquid core, considering the outer liquid and inner solid cores (Fig. 4).
View in article
These amounts of hydrogen account for the lunar core density estimated by Kuskov et al. (2021), while other light elements such as sulfur and carbon are required for earlier estimates by Garcia et al. (2019) and Viswanathan et al. (2019).
View in article
The maximum 0.6–1.1 wt. % H in the lunar core based on the hydrogen solubility limit reconciles within uncertainty the lunar liquid core density deficit estimated by Kuskov et al. (2021) with hydrogen alone, although it is not enough for the lower densities proposed earlier by Garcia et al. (2019) and Viswanathan et al. (2019).
View in article
Furthermore, if the metal-silicate chemical equilibrium was attained at the bottom of the LMO, our estimate of 0.3–1.8 wt. % H in the core can explain the observed density within its large uncertainty (Kuskov et al., 2021).
View in article
Kuwayama, Y., Morard, G., Nakajima, Y., Hirose, K., Baron, A.Q.R., Kawaguchi, S.I., Tsuchiya, T., Ishikawa, D., Hirao, N., Ohishi, Y. (2020) Equation of state of liquid iron under extreme conditions. Physical Review Letters 124, 165701. https://doi.org/10.1103/PhysRevLett.124.165701
Show in context For the liquids, we first estimated the density of liquid FeHx from diffuse scattering signals (Kuwayama et al., 2020; Fu et al., 2025).
View in article
Subsequently the volume of liquid pure Fe at an identical P-T condition was calculated using its thermal equation of state (Kuwayama et al., 2020).
View in article
The density of liquid pure Fe is from Kuwayama et al. (2020), and density reduction with increasing hydrogen content is calculated with ΔVH = 2.22 Å3.
View in article
Li, J., Fei, Y., Mao, H.K., Hirose, K., Shieh, S.R. (2001) Sulfur in the Earth’s inner core. Earth and Planetary Science Letters 193, 509–514. https://doi.org/10.1016/S0012-821X(01)00521-0
Show in context Sulfur and carbon have previously been proposed to be important lunar core light elements, but we note that their solubilities into solid iron coexisting with liquid alloy are limited only to <0.5 wt. % S and 1.5 wt. % C at 5 GPa (Li et al., 2001; Fei and Brosh, 2014).
View in article
Lin, Y., Hui, H., Xia, X., Shang, S., van Westrenen, W. (2020) Experimental constraints on the solidification of a hydrous lunar magma ocean. Meteoritics & Planetary Science 55, 207–230. https://doi.org/10.1111/maps.13425
Show in context Also, Lin et al. (2020) argued that the lunar crustal thickness (the amount of plagioclase) is controlled by water abundance in the LMO, which may be ∼300 μg/g H2O if the LMO was 700 km deep.
View in article
Even with 300 μg/g H2O (34 μg/g H) in the LMO (Lin et al., 2020), the metal-silicate partitioning predicts ∼0.3 wt. % H in the lunar core when it occurred at both 2.8 GPa/2163 K and 5 GPa/2200 K and ∼0.6 wt. % H at 5 GPa/3200 K.
View in article
Machida, A., Saitoh, H., Hattori, T., Sano-Furukawa, A., Funakoshi, K.-i., Sato, T., Orimo, S.-i., Aoki, K. (2019) Hexagonal close-packed iron hydride behind the conventional phase diagram. Scientific Reports 9, 12290. https://doi.org/10.1038/s41598-019-48817-7
Show in context All neutron diffraction measurements on Fe-H alloys have been carried out at pressures of ∼3 GPa, and at temperatures far below the onset of melting (e.g., Iizuka-Oku et al., 2017; Machida et al., 2019; Ikuta et al., 2019).
View in article
Malavergne, V., Bureau, H., Raepsaet, C., Gaillard, F., Poncet, M., Surblé, S., Sifré, D., Shcheka, S., Fourdrin, C., Deldicque, D., Khodja, H. (2019) Experimental constraints on the fate of H and C during planetary core-mantle differentiation. Implications for the Earth. Icarus 321, 473–485. https://doi.org/10.1016/j.icarus.2018.11.027
Show in context Hydrogen incorporation from silicate melt into core forming metals has been investigated under high pressures (Clesi et al., 2018; Malavergne et al., 2019; Tagawa et al., 2021; Tsutsumi et al., 2025).
View in article
Mita, S., Tagawa, S., Hirose, K., Ikuta, N. (2025) Fe-FeH eutectic melting curve and the estimates of Earth’s core temperature and composition. Journal of Geophysical Research: Solid Earth 130, e2024JB029283. https://doi.org/10.1029/2024JB029283
Show in context Other experimental studies reported the Fe(-Ni)-H melting temperatures only above 2.7 GPa (Suzuki et al., 1984; Okuchi, 1998; Fukai et al., 2003; Sakamaki et al., 2009; Shibazaki et al., 2014; Mita et al., 2025).
View in article
Nishida, K., Shibazaki, Y., Terasaki, H., Higo, Y., Suzuki, A., Funamori, N., Hirose, K. (2020) Effect of sulfur on sound velocity of liquid iron under Martian core conditions. Nature Communications 11, 1954. https://doi.org/10.1038/s41467-020-15755-2
Show in context In contrast, Nishida et al. (2020) suggested that sulfur strongly reduces the velocity of liquid iron under lunar core conditions.
View in article
Okuchi, T. (1998) The melting temperature of iron hydride at high pressures and its implications for the temperature of the Earth’s core. Journal of Physics: Condensed Matter 10, 11595–11598. https://doi.org/10.1088/0953-8984/10/49/052
Show in context Other experimental studies reported the Fe(-Ni)-H melting temperatures only above 2.7 GPa (Suzuki et al., 1984; Okuchi, 1998; Fukai et al., 2003; Sakamaki et al., 2009; Shibazaki et al., 2014; Mita et al., 2025).
View in article
Earlier experiments reported that the Fe-H melting temperature conversely rises above ∼3.5 GPa (Yagi and Hishinuma, 1995; Okuchi, 1998) (Fig. 2).
View in article
Rai, N., van Westrenen, W. (2014) Lunar core formation: new constraints from metal–silicate partitioning of siderophile elements. Earth and Planetary Science Letters 388, 343–352. https://doi.org/10.1016/j.epsl.2013.12.001
Show in context It is possible that the lunar core formation (in other words, core metal segregation from silicate) took place at its bottom under 2.8 GPa. On the other hand, Rai and van Westrenen (2014) found that core metal may have reached chemical equilibrium with silicate at 4.5 ± 0.5 GPa and 2163 K, which most likely matches the pressure at the core-mantle boundary.
View in article
Under plausible conditions of the lunar core formation of 2.8 GPa, 2163 K, and oxygen fugacity relative to the iron-wüstite buffer ΔIW = −2 (Rai and van Westrenen, 2014), the partition coefficient of hydrogen DHmetal/silicate is 1.11 × 10² (molar basis) according to Tsutsumi et al. (2025) (Fig. S-3).
View in article
We also obtained DHmetal/silicate = 1.05 × 10² at 5 GPa and 2200 K (based on the liquidus temperature estimate by Rai and van Westrenen, 2014) and 1.85 × 10² at 3200 K (from the high temperature core formation model by Steenstra et al., 2020).
View in article
Sakamaki, K., Takahashi, E., Nakajima, Y., Nishihara, Y., Funakoshi, K., Suzuki, T., Fukai, Y. (2009) Melting phase relation of FeHx up to 20 GPa: implication for the temperature of the Earth’s core. Physics of the Earth and Planetary Interiors 174, 192–201. https://doi.org/10.1016/j.pepi.2008.05.017
Show in context Other experimental studies reported the Fe(-Ni)-H melting temperatures only above 2.7 GPa (Suzuki et al., 1984; Okuchi, 1998; Fukai et al., 2003; Sakamaki et al., 2009; Shibazaki et al., 2014; Mita et al., 2025).
View in article
Shibazaki, Y., Terasaki, H., Ohtani, E., Tateyama, R., Nishida, K., Funakoshi, K.-i., Higo, Y. (2014) High-pressure and high-temperature phase diagram for Fe0.9Ni0.1–H alloy. Physics of the Earth and Planetary Interiors 228, 192–201. https://doi.org/10.1016/j.pepi.2013.12.013
Show in context Other experimental studies reported the Fe(-Ni)-H melting temperatures only above 2.7 GPa (Suzuki et al., 1984; Okuchi, 1998; Fukai et al., 2003; Sakamaki et al., 2009; Shibazaki et al., 2014; Mita et al., 2025).
View in article
Earlier studies attributed such melting temperature drop to a change in the subsolidus phase from body centred cubic (bcc) to fcc at ∼2 GPa (Fukai et al., 2003; Shibazaki et al., 2014), but the present experiments demonstrate that liquid Fe-H coexists with fcc and the melting temperature is depressed already at 1.0 GPa.
View in article
Steenstra, E.S., Lin, Y., Rai, N., Jansen, M., van Westrenen, W. (2017) Carbon as the dominant light element in the lunar core. American Mineralogist 102, 92–97. https://doi.org/10.2138/am-2017-5727
Show in context Such density deficit requires the presence of substantial amounts of light elements in the metallic core, and sulfur and carbon have often been regarded as possible light alloy elements (e.g., Jing et al., 2014; Steenstra et al., 2017).
View in article
Steenstra, E.S., Berndt, J., Klemme, S., Fei, Y., van Westrenen, W. (2020) A possible high-temperature origin of the Moon and its geochemical consequences. Earth and Planetary Science Letters 538, 116222. https://doi.org/10.1016/j.epsl.2020.116222
Show in context Furthermore, a more recent study suggested a much higher temperature of ∼3200 K for the lunar core formation at 5 GPa in the case of an Fe-Ni core (Steenstra et al., 2020).
View in article
We also obtained DHmetal/silicate = 1.05 × 10² at 5 GPa and 2200 K (based on the liquidus temperature estimate by Rai and van Westrenen, 2014) and 1.85 × 10² at 3200 K (from the high temperature core formation model by Steenstra et al., 2020).
View in article
Stoutenburg, E.R., Caracas, R., Campbell, A.J. (2026) Immiscibility between hydrogen and molten iron in planetary cores. Earth and Planetary Science Letters 678, 119851. https://doi.org/10.1016/j.epsl.2026.119851
Show in context The theoretical predictions of those in liquid by Stoutenburg et al. (2026) at 1500 K are also shown.
View in article
Recent theoretical calculations found non-ideal mixing behaviour of Fe-H liquids under the lunar core pressures (Stoutenburg et al., 2026), possibly lowering their sound velocity. Indeed, the calculations by van Driel et al. (2025) showed that V P is faster for liquid Fe-H than for pure Fe above 20 GPa but the difference is smaller at lower pressures, suggesting a possibility that hydrogen reduces the sound velocity of liquid Fe at 5 GPa.
View in article
Strong, H.M., Tuft, R.E., Hanneman, R.E. (1973) The iron fusion curve and γ-δ-l triple point. Metallurgical Transactions 4, 2657–2661. https://doi.org/10.1007/BF02644272
Show in context The grey line represents the melting curve of pure Fe (Strong et al., 1973).
View in article
Suzuki, T., Akimoto, S.-i., Fukai, Y. (1984) The system iron-enstatite-water at high pressures and temperatures—formation of iron hydride and some geophysical implications. Physics of the Earth and Planetary Interiors 36, 135–144. https://doi.org/10.1016/0031-9201(84)90014-1
Show in context Other experimental studies reported the Fe(-Ni)-H melting temperatures only above 2.7 GPa (Suzuki et al., 1984; Okuchi, 1998; Fukai et al., 2003; Sakamaki et al., 2009; Shibazaki et al., 2014; Mita et al., 2025).
View in article
Tagawa, S., Sakamoto, N., Hirose, K., Yokoo, S., Hernlund, J., Ohishi, Y., Yurimoto, H. (2021) Experimental evidence for hydrogen incorporation into Earth’s core. Nature Communications 12, 2588. https://doi.org/10.1038/s41467-021-22035-0
Show in context Indeed, hydrogen was assumed to be poorly soluble into iron below ∼3 GPa in recent core formation modelling (Tagawa et al., 2021; Tsutsumi et al., 2025).
View in article
While recent planetary accretion and core formation modelling assumed that hydrogen is not soluble into core forming metals below 3 GPa (Tagawa et al., 2021; Tsutsumi et al., 2025), it is possible that metallic cores of small rocky bodies such as our moon also include some hydrogen.
View in article
Hydrogen incorporation from silicate melt into core forming metals has been investigated under high pressures (Clesi et al., 2018; Malavergne et al., 2019; Tagawa et al., 2021; Tsutsumi et al., 2025).
View in article
Tsutsumi, Y., Sakamoto, N., Hirose, K., Mita, S., Yokoo, S., Hsu, H., Yurimoto, H. (2025) Origin of Earth’s hydrogen and carbon constrained by their core-mantle partitioning and bulk Earth abundance. Nature Communications 16, 10038. https://doi.org/10.1038/s41467-025-65729-5
Show in context Indeed, hydrogen was assumed to be poorly soluble into iron below ∼3 GPa in recent core formation modelling (Tagawa et al., 2021; Tsutsumi et al., 2025).
View in article
While recent planetary accretion and core formation modelling assumed that hydrogen is not soluble into core forming metals below 3 GPa (Tagawa et al., 2021; Tsutsumi et al., 2025), it is possible that metallic cores of small rocky bodies such as our moon also include some hydrogen.
View in article
Hydrogen incorporation from silicate melt into core forming metals has been investigated under high pressures (Clesi et al., 2018; Malavergne et al., 2019; Tagawa et al., 2021; Tsutsumi et al., 2025).
View in article
Under plausible conditions of the lunar core formation of 2.8 GPa, 2163 K, and oxygen fugacity relative to the iron-wüstite buffer ΔIW = −2 (Rai and van Westrenen, 2014), the partition coefficient of hydrogen DHmetal/silicate is 1.11 × 10² (molar basis) according to Tsutsumi et al. (2025) (
View in article
van Driel, J., Vočadlo, L., Brodholt, J. (2025) Thermodynamics of Fe-S-O-C-H liquids: implications for the Martian core. Earth and Planetary Science Letters 668, 119540. https://doi.org/10.1016/j.epsl.2025.119540
Show in context Recent theoretical calculations found non-ideal mixing behaviour of Fe-H liquids under the lunar core pressures (Stoutenburg et al., 2026), possibly lowering their sound velocity. Indeed, the calculations by van Driel et al. (2025) showed that VP is faster for liquid Fe-H than for pure Fe above 20 GPa but the difference is smaller at lower pressures, suggesting a possibility that hydrogen reduces the sound velocity of liquid Fe at 5 GPa.
View in article
Viswanathan, V., Rambaux, N., Fienga, A., Laskar, J., Gastineau, M. (2019) Observational constraint on the radius and oblateness of the lunar core-mantle boundary. Geophysical Research Letters 46, 7295–7303. https://doi.org/10.1029/2019GL082677
Show in context Geophysical constraints on the lunar interior indicate that the density of its core is a few percent up to ∼40 % lower than that of pure iron (e.g., Garcia et al., 2019; Viswanathan et al., 2019; Kuskov et al., 2021; Zhao et al., 2023).
View in article
The density of the lunar core has been modelled to be 4200–5200 kg/m3 by Garcia et al. (2019) and 5560–6070 kg/m3 by Viswanathan et al. (2019) assuming homogeneous liquid core.
View in article
These amounts of hydrogen account for the lunar core density estimated by Kuskov et al. (2021), while other light elements such as sulfur and carbon are required for earlier estimates by Garcia et al. (2019) and Viswanathan et al. (2019).
View in article
The maximum 0.6–1.1 wt. % H in the lunar core based on the hydrogen solubility limit reconciles within uncertainty the lunar liquid core density deficit estimated by Kuskov et al. (2021) with hydrogen alone, although it is not enough for the lower densities proposed earlier by Garcia et al. (2019) and Viswanathan et al. (2019).
View in article
Weber, R.C., Lin, P.-Y., Garnero, E.J., Williams, Q., Lognonné, P. (2011) Seismic detection of the lunar core. Science 331, 309–312. https://doi.org/10.1126/science.1199375
Show in context Thus, the relatively low compressional wave velocity (V P) inferred for the lunar core (Weber et al., 2011) may require light elements such as sulfur.
View in article
Yagi, T., Hishinuma, T. (1995) Iron hydride formed by the reaction of iron, silicate, and water: implications for the light element of the Earth’s core. Geophysical Research Letters 22, 1933–1936. https://doi.org/10.1029/95GL01792
Show in context Yagi and Hishinuma (1995) performed XRD measurements on Fe-H and determined melting temperatures at pressures down to 2.2 GPa, demonstrating a large reduction from the melting curve of Fe.
View in article
These results locate the melting (solidus) curve of Fe-H in a pressure range from 1.0 to 3.3 GPa, showing that its melting temperature decreases monotonically from ambient pressure to ∼3 GPa (Fig. 2), rather than a sudden reduction above ∼2 GPa (Yagi and Hishinuma, 1995; Fukai et al., 2003).
View in article
Earlier experiments reported that the Fe-H melting temperature conversely rises above ∼3.5 GPa (Yagi and Hishinuma, 1995; Okuchi, 1998) (Fig. 2).
View in article
Zhao, B., Morard, G., Boulard, E., Boccato, S., Siersch, N.C., Rivoldini, A., Guignot, N., Henry, L., King, A., Zurkowski, C., Fei, Y., Antonangeli, D. (2023) Local structure and density of liquid Fe-C-S alloys at Moon’s core conditions. Journal of Geophysical Research: Planets 128, e2022JE007577. https://doi.org/10.1029/2022JE007577
Show in context Geophysical constraints on the lunar interior indicate that the density of its core is a few percent up to ∼40 % lower than that of pure iron (e.g., Garcia et al., 2019; Viswanathan et al., 2019; Kuskov et al., 2021; Zhao et al., 2023).
View in article
top
Supplementary Information
The Supplementary Information includes:
- Experimental Methods
- Estimates of the Hydrogen Content in Liquid Iron
- Calculations of Metal-Silicate Partitioning of Hydrogen
- Tables S-1 and S-2
- Figures S-1 to S-4
- Supplementary Information References
Download the Supplementary Information (PDF)