


T.W. Dahl, J.N. Connelly, A. Kouchinsky, B.C. Gill, S.F. Månsson, M. Bizzarro
10
1724cor
9
April
2019
12
April
2019
30
April
2019
40
0
Corrigendum to “Reorganisation of Earth's biogeochemical cycles briefly oxygenated the oceans 520 Myr ago” by Dahl et al., 2017
1Natural History Museum of Denmark, University of Copenhagen, Denmark
J.N. Connelly1,2, 1Natural History Museum of Denmark, University of Copenhagen, Denmark
2Centre for Star and Planet Formation, University of Copenhagen, Denmark
3Swedish Museum of Natural History, Stockholm, Sweden
B.C. Gill4,4Virginia Polytechnic Institute and State University, Blacksburg, USA
S.F. Månsson1,1Natural History Museum of Denmark, University of Copenhagen, Denmark
M. Bizzarro1,2 1Natural History Museum of Denmark, University of Copenhagen, Denmark
2Centre for Star and Planet Formation, University of Copenhagen, Denmark
T.W. Dahl
Email: tais.dahl@snm.ku.dk
1Natural History Museum of Denmark, University of Copenhagen, Denmark
2Center for Star and Planet Formation, University of Copenhagen, Denmark
3Swedish Museum of Natural History, Stockholm, Sweden
4Virginia Polytechnic Institute and State University, Blacksburg, USA
Corrigendum to “Reorganisation of Earth's biogeochemical cycles briefly oxygenated the oceans 520 Myr ago” by Dahl et al., 2017. Geochem. Persp. Let. 10, 40.
Geochemical Perspectives Letters v10 | doi: 10.7185/geochemlet.1724cor
Received 9 April 2019 | Accepted 12 April 2019 | Published 30 April 2019
Published by the European Association of Geochemistry
under Creative Commons License CC BY-NC-ND 4.0
 |
- Share this article


Article views:63Cumulative count of HTML views and PDF downloads.
- Download Citation
- Rights & Permissions

top
Corrigendum
Correction to: Geochemical Perspectives Letters v3, n2, 210-220, doi: 10.7185/geochemlet.1724, published on 15 June 2017.
The authors have identified an error in Figures S-8 and S-9 of the Supplementary Information accompanying the original article. Figures S-8 and S-9 have now been corrected in the online and PDF versions of the Supplementary Information and the correct figures are shown below.
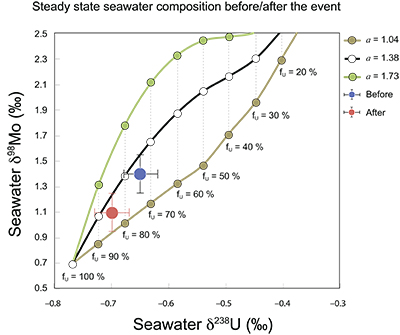
Figure S-8 Modelled seawater composition (δ238U, δ98Mo) for the early Cambrian steady states before and after the Cambrian Stage 2–3 event. The left most point represents 100 % burial in anoxic settings (fU = fMo = 1). At each step point towards the right, fU decreases 10 % (i.e. 90 %, 80 %, 70 %, etc.). The estimated composition of the δ238U and δ98Mo of early Cambrian seawater in ‰ before and after the event are (-0.65, -0.70) and (1.4, 1.1), respectively, Error bars show ±0.03 ‰ and ±0.15 for δ238U and δ98Mo, respectively.
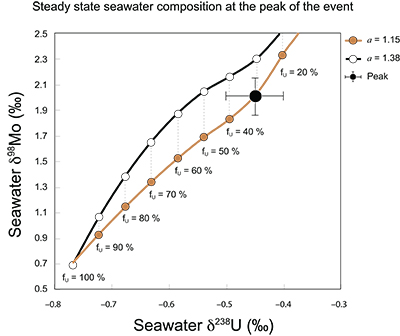
Figure S-9 The predicted composition of seawater at steady state for a = 1.15–1.38 is consistent with observations at the peak of the oxygenation event (δ238U = –0.45 ‰, δ98Mo = 2.0 ‰) with only 30 ± 10 % U removal into anoxic settings (corresponding to 25 ± 10 % and 19 ± 8 % Mo removal for a = 1.15 and 1.38, respectively).
Figures and Tables
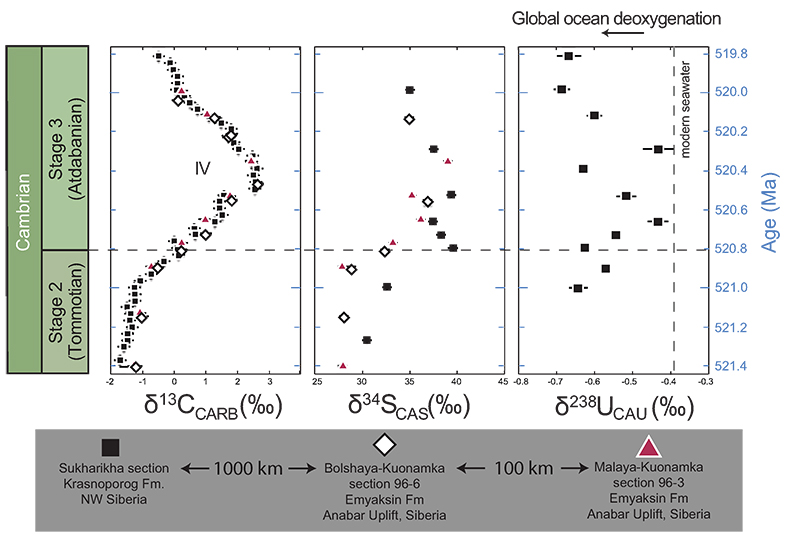
Figure 1 Isotope data from three carbonate successions straddling the Cambrian Stage 2–3 boundary (Cambrian Stage 2–3) in Siberia. Carbon isotope data from carbonate (δ13CCARB) is taken from Kouchinsky et al. (2007)
Kouchinsky, A., Bengtson, S., Pavlov, V., Runnegar, B., Torssander, P., Young, E., Ziegler, K. (2007) Carbon isotope stratigraphy of the Precambrian–Cambrian Sukharikha River section, northwestern Siberian platform. Geological Magazine 144, 1–10.
. Sulphur and uranium isotope data are from carbonate-associated sulphate (δ34SCAS) and uranium (δ238UCAU), respectively. Age assignments derived from correlations to the carbon isotope stratigraphy and the age model of Maloof et al. (2010)Maloof, A.C., Porter, S.M., Moore, J.L., Dudas, F.O., Bowring, S.A., Higgins, J.A., Fike, D.A., Eddy, M.P. (2010) The earliest Cambrian record of animals and ocean geochemical change. Geological Society of America Bulletin 122, 1731–1774.
.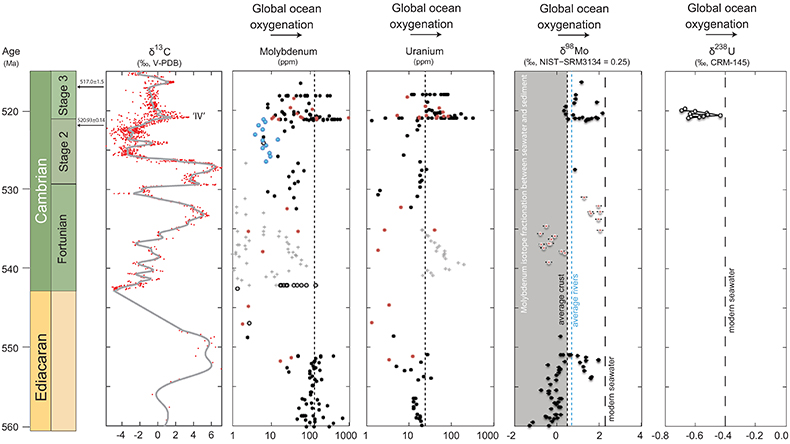
Figure 2 Summary of the redox proxy and carbon isotope data from latest Ediacaran to Early Cambrian (560–515 Myr). Redox proxy data includes the sedimentary contents and stable isotope compositions of molybdenum and uranium: Euxinic shales (black circles), Ferruginous shales (red circles), oxic shales (blue circles), shales from unknown redox environments (gray crosses), phosphorites (white diamonds), and carbonates (white circles). The grey field on the molybdenum isotope plot indicates values that are definitively fractionated from seawater, although values greater than these may be so as well. References for the data are listed in the Supplementary Information Extended Data, Table S-22.
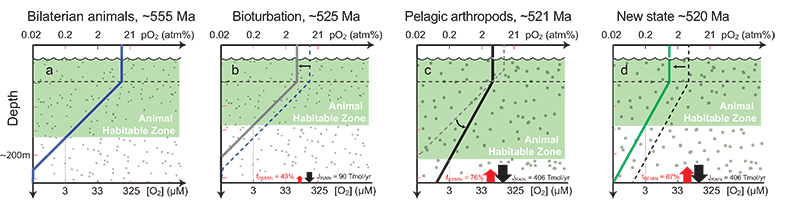
Figure 3 Conceptual model for the episodic expansion of the oxygenation zone in the oceans. The emergence of bilaterian animals (a-b) increased sediment mixing via bioturbation causing atmospheric pO2 to decline. The oxygenation zone contracts until (c) a rapid increase in the sinking rate of organic matter changes O2 consumption rates in the upper water column. (d) This accelerates organic carbon export to the sediments and delivers more food and O2 to the benthos over wider areas of the seafloor. Enhanced bioturbation promotes atmospheric pO2 decline, and re-stabilises the ocean in a more reducing state. Arrows and numbers illustrate organic export fluxes in one scenario (details in Table S-11). For simplicity, the organic C export increases in one step with the emergence of larger faecal pellets. Quantitative estimates for organic carbon export and remineralisation are derived from the coupled C and S isotope modelling (see Supplementary Information S5).
Back to article
Supplementary Figures and Tables
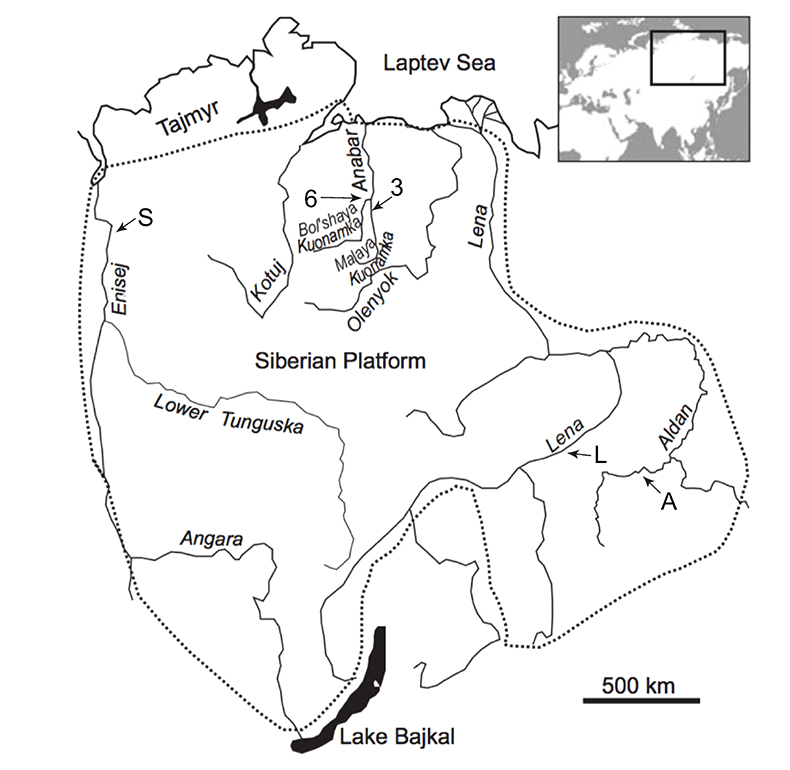
Figure S-1 Location of the studied sections Sukharikha (S), Bolshaya Kuonamka (6) and Malaya Kuonamka (3) and other sections at the Siberian platform discussed in the text (L–Middle Lena, A–Aldan Rivers).
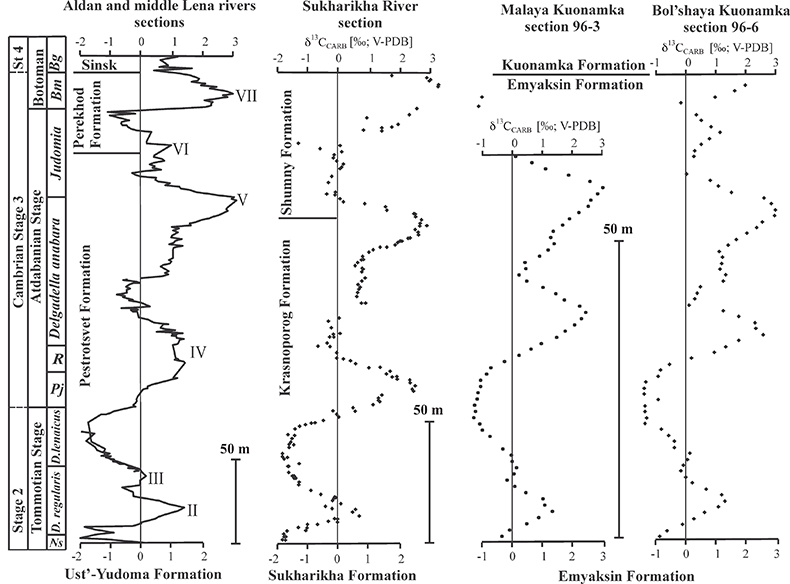
Figure S-2 Carbon isotope stratigraphy of the three studied sections and composite curve from Aldan and Middle Lena Rivers (Brasier et al., 1994; Kouchinsky et al., 2007). Zones as defined in the Lena-Aldan area: Ns – Nochoroicyathus sunnaginicus; D. regularis – Dokidocyathus regularis; D. lenaicus – Dokidocyathus lenaicus–Tumuliolynthus primigenius; Pj – Profallotaspis jakutensis; R – Repinaella; Bm – Bergeroniellus micmacciformis; Bg – Bergeroniellus gurarii.
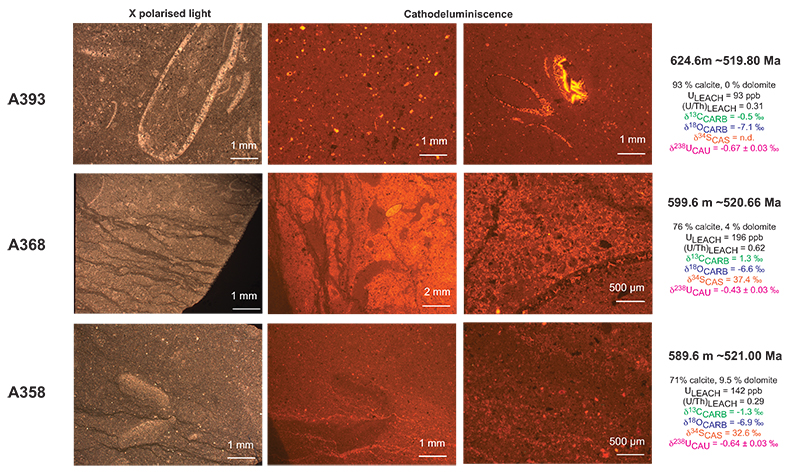
Figure S-3 Photomicrographs of samples (A358, A368 and A393) from the Sukharikha River section show microstructure and cathodoluminescent (CL) characteristics. Recrystallised shell fragments are embedded in a micrite matrix. Photographs are taken from thin section using multi-composite exposure (HDR). Selected geochemical data are summarised; n.d. – no data.
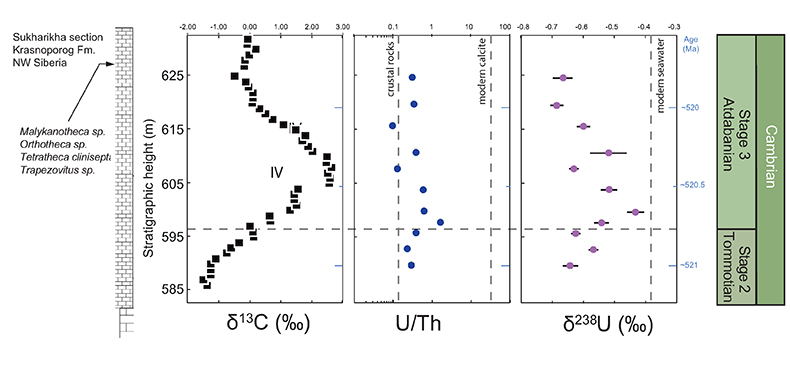
Figure S-4 Geochemical profiles from the Sukharikha River section showing δ13C, U/Th (note the logarithmic scale) and δ238U in stratigraphic context. The lithostratigraphy is adapted from Kouchinsky et al. (2007) and Rowland et al. (1998). The age assignment follows the model proposed by Maloof et al. (2010) assuming synchronicity worldwide in δ13C record tied to five absolute U/Pb age dates obtained from interbedded volcanic ashes in sections from Morocco (Maloof et al., 2010a). The uncertainty on δ13C is smaller than symbol size (2 SD reproducibility of samples from the same bed). The uncertainty of U/Th is <30 % measured on replicate leachates (see Extended Data 1). The uncertainty of δ238U is shown with error bars as 2 SE (replicate analyses of the same sample solution, see Table S-1).
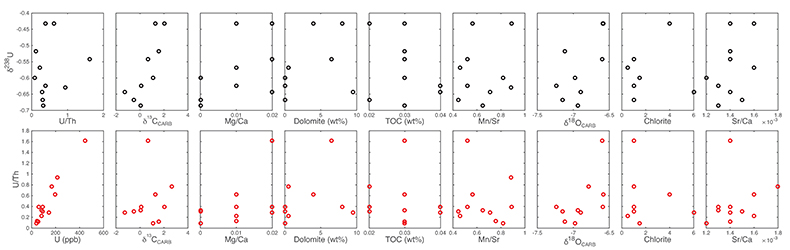
Figure S-5 Comparison of δ238U and highly reactive U to δ13C and geochemical indicators of dolomitisation (Mg/Ca, dolomite), pore water redox conditions (TOC), diagenetic alteration (Mn/Sr, δ18O), detrital input (Al/Ca, clay content), and primary carbonate mineralogy (Sr/Ca).
Table S-1 Pearson's correlation coefficients and p-values calculated to test the influence of diagenetic indicators on δ238U and U/Th. Uranium content (U) is linearly correlated to U/Th, hence the significance of the correlations between U and diagenetic indicators are similar. Statistical significant relationships are in bold (confidence interval = 5 %).
| R | p-value | |
| δ238U vs. U | 0.12 | 0.71 |
| δ238U vs. U/Th | 0.15 | 0.67 |
| U vs. U/Th | 0.96 | 8.11E-07 |
| δ238U vs. δ13C | 0.82 | 0.005 |
| δ238U vs. Mg/Ca | 0.52 | 0.15 |
| δ238U vs. TOC | -0.31 | 0.41 |
| δ238U vs. δ18O | 0.68 | 0.04 |
| δ238U vs. Mn/Sr | 0.14 | 0.69 |
| δ238U vs. Al/Ca | #N/D | #N/D |
| δ238U vs. Sr/Ca | 0.5 | 0.14 |
| δ238U vs. calcite | -0.66 | 0.07 |
| δ238U vs. quartz | 0.69 | 0.05 |
| δ238U vs. dolomite | 0.38 | 0.34 |
| δ238U vs. ankerite | -0.68 | 0.16 |
| δ238U vs. chlorite | 0.14 | 0.76 |
| δ238U vs. mica | 0.21 | 0.61 |
| δ238U vs. K-feldspar | 0.44 | 0.27 |
| U/Th vs. δ13C | 0.15 | 0.67 |
| U/Th vs. Mg/Ca | 0.49 | 0.15 |
| U/Th vs. TOC | -0.1 | 0.78 |
| U/Th vs. δ18O | 0.59 | 0.07 |
| U/Th vs. Mn/Sr | -0.13 | 0.71 |
| U/Th vs. Al/Ca | #N/D | #N/D |
| U/Th vs. Sr/Ca | 0.16 | 0.65 |
| U/Th vs. calcite | -0.13 | 0.75 |
| U/Th vs. quartz | 0.04 | 0.92 |
| U/Th vs. dolomite | 0.3 | 0.44 |
| U/Th vs. ankerite | -0.24 | 0.63 |
| U/Th vs. chlorite | 0.01 | 0.98 |
| U/Th vs. mica | -0.13 | 0.73 |
| U/Th vs. K-feldspar | 0.06 | 0.88 |
Table S-2 Uranium extracted from two reference materials with the sequential extraction procedure.
| U (ppb) | KTChalk | MCPhos |
| (100 % CaCO3) | (8.5 wt. % P2O5) | |
| 10 % acetic acid | 70 ± 4 | 440 ± 5 |
| 0.5 M HCl | 19 ± 1 | 872 ± 423 |
| 2 M HCl | 4 ± 0 | 133 ± 49 |
| HF + HNO3 | 14 ± 0 | 994 ± 8 |
| Total | 107 ± 4 | 2439 ± 426 |
Table S-3 Comparison of extraction yields for acetic acid vs. hydrochloric acid of various molarity.
| U | KTChalk | MCPhos |
| 10 % acetic acid | 75 ± 4 % | 30 ± 0 % |
| 0.5 M HCl | 20 ± 1 % | 60 ± 29 % |
| 2 M HCl | 4 ± 0 % | 9 ± 3 % |
| Total | 100 % | 100 % |
Table S-4 Repeated analyses of carbonate-associated U and δ238UCAU using the mild acetic acid extraction (with variable reaction time).
| Replicate | Reaction time | U (ppb) | δ238U (‰) |
| SRM-1d (modern argillaceous limestone) | |||
| #1 | 16 hr | 70 | –0.09 ± 0.02 |
| #2 | 16 hr | 743 | –0.08 ± 0.02 |
| #3 | 16 hr | 639 | –0.11 ± 0.02 |
| T1-13 (Cambrian limestone) | |||
| #3 | 30 min | 298 | –0.85 ± 0.02 |
| #4 | 4 hr | 292 | –0.83 ± 0.02 |
| #5 | 16 hr | 281 | –0.82 ± 0.03 |
| T1-26.5 (Cambrian limestone) | |||
| #1 | 16 hr | 102 | not determined |
| #2 | 16 hr | 155 | –0.56 ± 0.02 |
| #3 | 16 hr | 154 | –0.60 ± 0.03 |
Table S-5 Extraction yields for various mixtures of KTChalk and MCPhos.
| Acid | Chalk | 1:1† | 1:2ß | MCPhos | 1:1† | 1:2ß |
| measured | predicted | |||||
| 10 % acetic | 65 % | 35 % | 24 % | 18 % | 40 % | 33 % |
| 0.5 M HCl | 18 % | 37 % | 34 % | 36 % | 27 % | 30 % |
| 2 M HCl | 4 % | 5 % | 12 % | 5 % | 5 % | 5 % |
| HF + HNO3 | 13 % | 24 % | 3 % | 41 % | 28 % | 33 % |
†Mixing ratio 1:1 corresponds to 1.0187 g KTChalk (108 ng U) + 0.0519 g MCPhos (127 ng U).
ßMixing ratio 1:2 corresponds to 1.0993 g KTChalk (117 ng U) + 0.1138 g MCPhos (278 ng U).
Table S-6 Five parameterisations for the modern oceanic uranium isotope budget shown in Figure S-6. The models are broadly consistent with the modern ocean state.
| Case | 1 | 2 | 3 | 4 | 5 | 6 |
| Default | low δIN | hi ΔANOX | hi δIN | low ΔANOX | hi ΔOTHER | |
| δIN | –0.27 ‰ | –0.34 ‰ | –0.27 ‰ | –0.30 ‰ | –0.27 ‰ | –0.27 ‰ |
| ΔOTHER | 0.04 ‰ | 0.00 ‰ | 0.10 ‰ | 0.10 ‰ | 0.04 ‰ | 0.15 ‰ |
| ΔANOX | 0.50 ‰ | 0.50 ‰ | 0.60 ‰ | 0.60 ‰ | 0.40 ‰ | 0.40 ‰ |
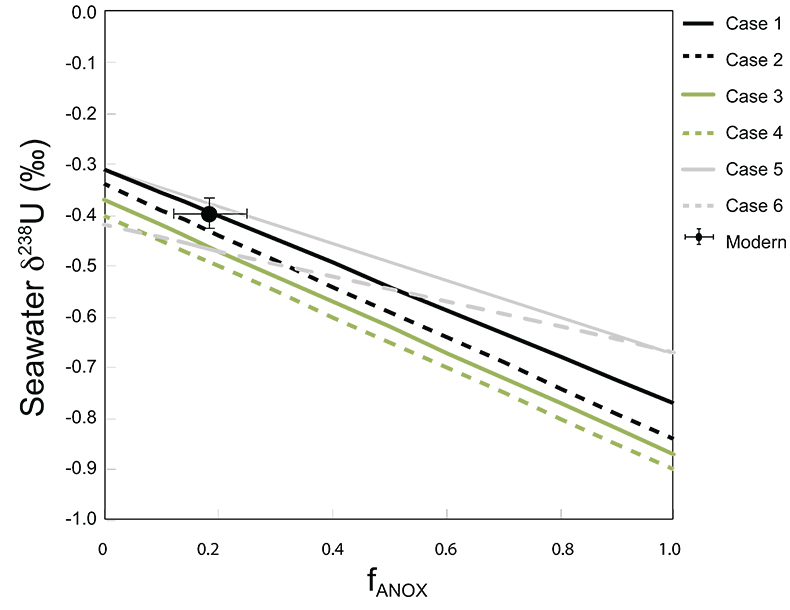
Figure S-6 Relationships between δSW and anoxic U burial fraction (fU) in the ocean are shown when the system is at steady state. The fraction of total oceanic U burial in anoxic basins (fU) is a key parameter that can shift seawater δ238U significantly below the modern value (black circle). The remaining U burial occurs in various oxygenated settings with a smaller isotopic imprint on global seawater (see text for details).
Table S-7 Parameter values used in the coupled Mo–U isotope mass balance models for today's ocean.
| Mo | U | |
| δIN | 0.7 | -0.27 |
| ΔOX | 2.8 | 0.04 |
| ΔANOX | 0.0 | 0.50 |
| ΔSAD | 1.4 | - |
| ƒOX | 30 % | 82 % |
| ƒSAD | 58 % | - |
| ƒEUX | 12 % | 18 % |
| Predicted δSW | 2.35 | -0.393 |
| Observed δSW | 2.34 ± 0.10 | -0.392 ± 0.005 |
(Note that all Δs are here defined positive, despite Mo and U isotope fractionations have opposite signs).
Back to article | Download in Excel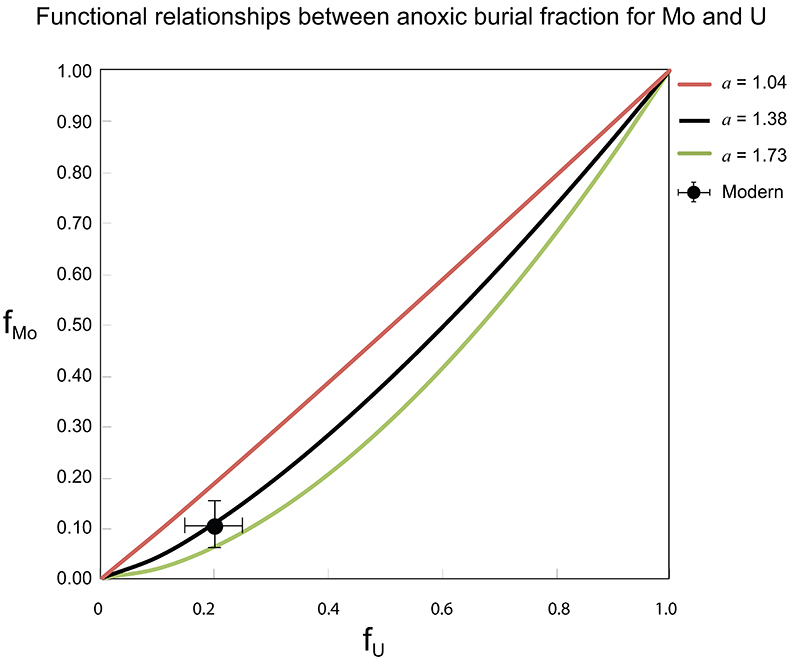
Figure S-7 Modelled functional relationships between euxinic Mo and U sinks. Modern estimates for the anoxic burial fractions (white square) suggest a is slightly larger than 1, consistent with modern oceanic budgets (Noordmann et al., 2016) where a = 1.38 ± 0.34.
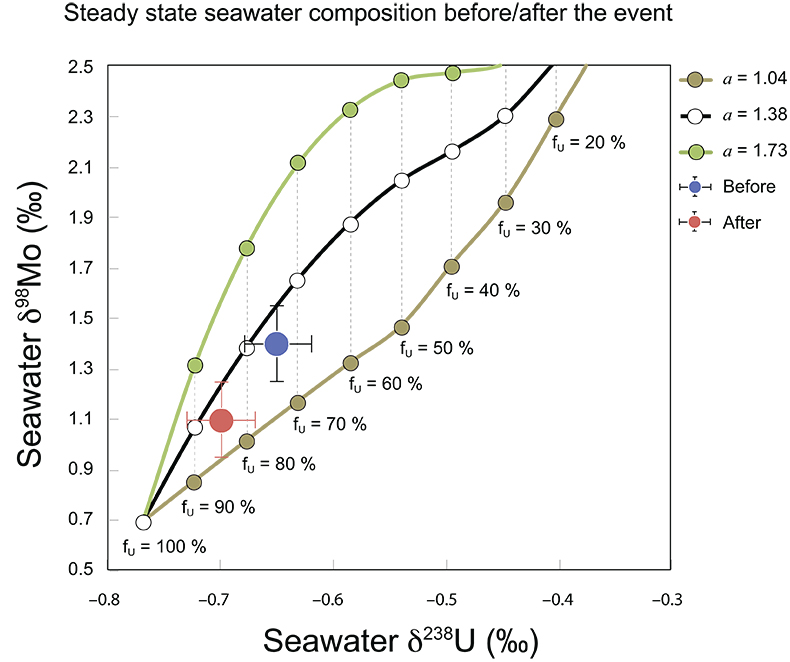
Figure S-8 Modelled seawater composition (δ238U, δ98Mo) for the early Cambrian steady states before and after the Cambrian Stage 2–3 event. The left most point represents 100 % burial in anoxic settings (fU = fMo = 1). At each step point towards the right, fU decreases 10 % (i.e. 90 %, 80 %, 70 %, etc.). The estimated composition of the δ238U and δ98Mo of early Cambrian seawater in ‰ before and after the event are (-0.65, -0.70) and (1.4, 1.1), respectively, Error bars show ±0.03 ‰ and ±0.15 for δ238U and δ98Mo, respectively.

Figure S-9 The predicted composition of seawater at steady state for a = 1.15–1.38 is consistent with observations at the peak of the oxygenation event (δ238U = –0.45 ‰, δ98Mo = 2.0 ‰) with only 30 ± 10 % U removal into anoxic settings (corresponding to 25 ± 10 % and 19 ± 8 % Mo removal for a = 1.15 and 1.38, respectively).
Table S-8 Parameter values used for the C and S modelling.
| Modern alue | Explored range | Explanation | Ref | |
| α | 0.0072 | x (3-30) | Ratio of pyrite formation to organic carbon remineralisation rate | B07 |
| JRAIN | 192 · 1012 | ¥ | mol/yr. Modern organic rain rate | |
| JORG | 26 · 1012 | ¥ | mol/yr. Modern marine organic C burial rate | B07 |
| JLAND | 26 · 1012 | ß | mol/yr. Modern terrestrial organic C burial rate | |
| JEVAP | 2.1·1012 | x (0.2 - 1) | mol/yr. Cenozoic sulphate burial rate | CF09† |
| JCARB | 216·1012 | x (0.2 - 1) | mol/yr. Modern carbonate burial rate | BB12 |
| δIN.C | –5 ‰ | –5 ± 1 ‰ | δ13C of oceanic input | |
| ΔC | 26 ‰ | 24-30 ‰ | Average δ13C offset between seawater and buried organic matter | |
| δin.S | 8 ‰ | 4-16 ‰ | δ34S of oceanic input | |
| ΔS | 35 ‰ | 35-50 ‰ | Average δ34S offset between seawater and buried pyrite | |
| SR | 40 · 1012 | mol/yr. Modern organic burial rate | B07 | |
| SO42- | 28 | 2-3 | mM. Modern oceanic sulphate level | |
| JPY | 1.2 · 1012 | ¥ | mol/yr. Modern pyrite burial rate | B07 |
† The size of the modern oxidising C and S sinks were established from the isotope-derived f-constraints (Burdige, 2007; Saltzman and Thomas, 2012), suggesting ƒORG = 0.192 and ƒPY = 0.36 leads to steady state seawater values of δ13C = 0 ‰ and δ34S = 21 ‰, respectively. We assume that the modern terrestrial organic carbon burial equals that of marine organic carbon burial (Bergman et al., 2004), and neglect terrestrial pyrite burial.
¥ Model results are given in Tables S-9 to S-14
ß Terrestrial organic carbon burial (e.g., coal) is assumed equal to marine organic carbon (Bergman et al., 2004). Ref. B07 = Burdige (2007), Ref CF09 = Canfield and Farquhar (2009), Ref BB12 = Berner and Berner (2012).
Table S-9 Changes in the f-ratios during the Cambrian Stage 2–3 oxygenation episode. Uncertainties are propagated from the uncertainty of the isotope compositions of the inputs and the isotope fractionation associated with burial in reducing sinks (Table S-8)
| Before the event | At the peak | Behaviour | Modern value | |
| δC | 0 % | 3 % | increase | 0 ‰ |
| δS | 28 % | 40 % | increase | 21 ‰ |
| this leads to: | ||||
| ƒORG | 17 ± 4 % | 28 ± 5 % | increase | 20 ‰ |
| ƒPY | 40 ± 17 % | 70 ± 22 % | increase | 36 ‰ |
Table S-10 Ratios between reducing and oxidising sinks for carbon and sulphur changed during the Cambrian Stage 2–3 event.
| Before the event | At the peak | Behaviour | Modern value | |
| δ13C | 0 ‰ | 3 ‰ | increase | 0 ‰ |
| δ34S | 28 ‰ | 40 ‰ | increase | 21 ‰ |
| ƒORG /(1-ƒORG) | 0.21 ± 0.06 | 0.40 ± 0.10 | increase | 0.25 |
| ƒPY/(1-ƒPY) | 0.81 ± 0.51 | 6.21 ± 5.29 | increase | 0.56 |
Table S-11 Consequences for absolute organic carbon and pyrite sulphur flux, assuming modern-day values for JCARB, JEVAP, and α. The other constants are δIN, C = –5 ‰, δIN, S = 8 ‰, ΔS = 35 ‰, Δbio = 26 ‰. Flux unit: mol/yr.
| Before the event | At the peak | Behaviour | Modern value | |
| JRAIN | 440·1012 | 3190·1012 | increase | 192 ·1012 |
| JORG | 52·1012 | 96·1012 | increase | 26 ·1012 |
| JPY | 2.8·1012 | 22·1012 | increase | 1.2 ·1012 |
| ƒREMIN | 0.88 | 0.97 | increase | 0.87 |
Table S-12 Calculations with α = 0.070 (= 10 x modern). The higher α value leads to a solution with more modest organic load fluxes and less remineralisation, fREMIN < 0.76.
| Before the event | At the peak | Behaviour | Modern value | |
| JRAIN | 90·1012 | 406·1012 | increase | 192 ·1012 |
| JORG | 50·1012 | 93·1012 | increase | 26 ·1012 |
| JPY | 2.8·1012 | 22·1012 | increase | 1.2 ·1012 |
| ƒREMIN | 0.43 | 0.76 | increase | 0.87 |
Table S-13 Calculations with oxidative burial fluxes (JCARB, JEVAP) set at 1/4 of modern values. α set at 0.070.
| Before the event | At the peak | Behaviour | Modern value | |
| JRAIN | 23·1012 | 100·1012 | increase | 192 ·1012 |
| JORG | 13·1012 | 24·1012 | increase | 26 ·1012 |
| JPY | 0.70·1012 | 5.6·1012 | increase | 1.2 ·1012 |
| ƒREMIN | 0.43 | 0.76 | increase | 0.87 |
Table S-14 Calculations with ΔS set at 50 ‰ (as opposed to 35 ‰). α = 0.070.
| Before the event | At the peak | Behaviour | Modern value | |
| JRAIN | 69·1012 | 145·1012 | increase | 192 ·1012 |
| JORG | 50·1012 | 93·1012 | increase | 26 ·1012 |
| JPY | 1.4·1012 | 3.7·1012 | increase | 1.2 ·1012 |
| ƒREMIN | 0.27 | 0.35 | increase | 0.87 |
Table S-15 Calculations with δIN,S set at 16 ‰ (as opposed to 8 ‰). α = 0.070.
| Before the event | At the peak | Behaviour | Modern value | |
| JRAIN | 67·1012 | 159 ·1012 | increase | 192 ·1012 |
| JORG | 50·1012 | 93 ·1012 | increase | 26 ·1012 |
| JPY | 1.1·1012 | 4.6 ·1012 | increase | 1.2 ·1012 |
| ƒREMIN | 0.23 | 0.40 | increase | 0.87 |
Table S-16 Calculations with δIN,C set at –4 ‰ (as opposed to –5 ‰). α = 0.070.
| Before the event | At the peak | Behaviour | Modern value | |
| JRAIN | 71·1012 | 373·1012 | increase | 192 ·1012 |
| JORG | 31·1012 | 61·1012 | increase | 26 ·1012 |
| JPY | 2.8·1012 | 22·1012 | increase | 1.2 ·1012 |
| ƒREMIN | 0.55 | 0.83 | increase | 0.87 |
Table S-17 Calculations with ΔBIO = 30 ‰ (as opposed to 26 ‰). α = 0.070.
| Before the event | At the peak | Behaviour | Modern value | |
| JRAIN | 82·1012 | 388·1012 | increase | 192 ·1012 |
| JORG | 42 ·1012 | 76 ·1012 | increase | 26 ·1012 |
| JPY | 2.8 ·1012 | 22 ·1012 | increase | 1.2 ·1012 |
| ƒREMIN | 0.47 | 0.80 | increase | 0.87 |
Table S-18 Summary of selected solutions and the increasing organic rain rate during the Cambrian Stage 2–3 event.
| Case | Example | Initial JRAIN | Increase of JRAIN | ƒREMIN |
| Modern oceans | 219·1012 | 87 % | ||
| 1 | Higher α (10-fold, α = 0.072) (Table S-12) | 90·1012 | x 4.5 | 43 to >76 % |
| 1b | Higher α (3-fold, α = 0.022) | 181·1012 | x 6.3 | 71 to >91 % |
| 1c | Higher α (30-fold, α = 0.22) | 64·1012 | x 3.1 | 20 to >52 % |
| 2 | Case 1 + smaller JCARB, JEVAP (1/5) (Table S-13) | 23·1012 | x 4.5 | 43 to >76 % |
| 3 | Case 1 + higher ΔS (50 ‰) (Table S-14) | 71·1012 | x 2.1 | 27 to >35 % |
| 4 | Case 1 + higher δIN,S (16 ‰) (Table S-15) | 67·1012 | x 2.4 | 23 to >40 % |
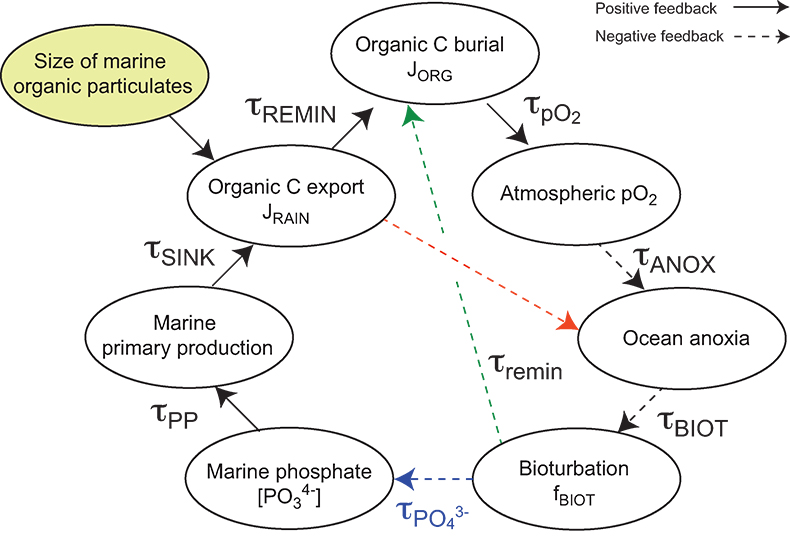
Figure S-10 Feedback diagram showing the oxygenation dynamics of the atmosphere-ocean system in response to increasing sinking rates of particulate organic matter in the oceans by larger animals with guts. See text for details.
Table S-19 Elemental and isotope data for samples from the Sukharikha River Section. Reference materials include IAPSO seawater, argillaceous limestone (SRM-1d), carbonatite (COQ-1) and Columbia River basalt (BCR-2). rpt = repeated analyses.
| Sample | Strat. height (m) | Age* (Ma) | Th (ppb) | U (ppb) | U/Th | δ238U (‰) | ± 2SE (‰) | n | U EFTh ƒ | Mg/Ca | Al/Ca | Fe/Ca | Mn/Sr | Sr/Ca |
| Sukharikha River Section (A), Krasnoporog Fm | ||||||||||||||
| A393 | 624.6 | 519.81 | 301 | 93 | 0.31 | -0.667 | 0.032 | 5 | 0.2 | 0 | 0 | 0 | 0.45 | 0.0015 |
| A388 | 619.6 | 519.98 | 249 | 83 | 0.33 | -0.686 | 0.021 | 5 | 0.3 | 0 | 0 | 0 | 0.65 | 0.0013 |
| A384 | 615.6 | 520.12 | 408 | 39 | 0.09 | -0.6 | 0.02 | 1 | -0.7 | 0 | 0 | 0 | 0.82 | 0.0012 |
| A379 | 610.6 | 520.29 | 155 | 60 | 0.39 | -0.433 | 0.043 | 5 | 0.5 | 0.02 | 0 | 0.01 | 0.89 | 0.0014 |
| A376 | 607.6 | 520.39 | 221 | 169 | 0.77 | 1.9 | 0.0018 | |||||||
| - rpt | 607.6 | 520.39 | 228 | 214 | 0.94 | -0.63 | 0.015 | 5 | 2.6 | 0.89 | ||||
| A372 | 603.6 | 520.53 | 449 | 54 | 0.12 | -0.517 | 0.026 | 3 | -0.5 | 0.0014 | ||||
| - rpt | 603.6 | 520.53 | 333 | 44 | 0.13 | -0.5 | 0.01 | 0 | 0.02 | 0.76 | ||||
| A368 | 599.6 | 520.66 | 317 | 196 | 0.62 | -0.432 | 0.027 | 5 | 1.4 | 0.01 | 0 | 0.01 | 0.56 | 0.0016 |
| A366 | 597.6 | 520.73 | 275 | 445 | 1.62 | -0.542 | 0.023 | 5 | 5.2 | 0.02 | 0 | 0.01 | 0.52 | 0.0014 |
| A364 | 595.6 | 520.8 | 231 | 90 | 0.39 | -0.625 | 0.015 | 5 | 0.5 | 0.01 | 0 | 0.01 | 0.52 | 0.0013 |
| A361 | 592.6 | 520.9 | 352 | 82 | 0.23 | -0.569 | 0.015 | 3 | -0.1 | 0.01 | 0 | 0.01 | 0.46 | 0.0016 |
| A358 | 589.6 | 521 | 487 | 142 | 0.29 | -0.643 | 0.025 | 5 | 0.1 | 0.02 | 0 | 0.02 | 0.71 | 0.0014 |
| Malaya Kuonamka River Section (K3), Emyaksin Fm | ||||||||||||||
| K3-18P | 21.5 | 521.4 | 268 | 120 | 0.45 | 0.7 | 0.03 | 0 | 0.02 | 1.52 | 0.0009 | |||
| K3-22P | 26 | 521.13 | 246 | 239 | 0.97 | 2.7 | 0.06 | 0 | 0.04 | 1.01 | 0.0014 | |||
| K3-26P | 30 | 520.89 | 456 | 54 | 0.12 | -0.5 | 0.03 | 0 | 0.02 | 2.12 | 0.0008 | |||
| K3-28P | 32 | 520.77 | 183 | 31 | 0.17 | -0.4 | 0.02 | 0 | 0.02 | 1.25 | 0.0011 | |||
| K3-30P | 34 | 520.65 | 310 | 54 | 0.17 | -0.3 | 0.05 | 0 | 0.03 | 1.38 | 0.0010 | |||
| K3-32P | 36 | 520.53 | 276 | 74 | 0.27 | 0.0 | 0.07 | 0 | 0.23 | 1.29 | 0.0014 | |||
| K3-35P | 39 | 520.35 | 418 | 49 | 0.12 | -0.6 | 0.02 | 0 | 0.02 | 0.74 | 0.0012 | |||
| K3-37P | 41 | 520.23 | 943 | 87 | 0.09 | -0.6 | 0.02 | 0 | 0.01 | 1.18 | 0.0009 | |||
| K3-39P | 43 | 520.11 | 338 | 34 | 0.10 | -0.6 | 0.02 | 0 | 0.02 | 1.29 | 0.0009 | |||
| K3-41P | 45 | 519.99 | 348 | 39 | 0.11 | -0.6 | 0.03 | 0 | 0.02 | 1.65 | 0.0010 | |||
| Bol'shaya Kuonamka (K6), Emyaksin Fm | ||||||||||||||
| K6-24 | 23 | 521.4 | 569 | 151 | 0.26 | 0.0 | 0.05 | 0 | 0.02 | 1.03 | 0.0012 | |||
| K6-27 | 26 | 521.15 | 363 | 67 | 0.19 | -0.3 | 0.04 | 0 | 0.02 | 1.44 | 0.0012 | |||
| K6-30 | 29 | 520.89 | 568 | 65 | 0.12 | -0.6 | 0.06 | 0.01 | 0.02 | 1.62 | 0.0011 | |||
| K6-31A | 30 | 520.81 | 615 | 137 | 0.22 | -0.1 | 0.02 | 0 | 0.02 | 0.98 | 0.0015 | |||
| K6-34 | 33 | 520.55 | 815 | 111 | 0.14 | -0.5 | 0.07 | 0 | 0.01 | 1.44 | 0.0013 | |||
| K6-35 | 34 | 520.47 | 475 | 72 | 0.15 | -0.4 | 0.02 | 0.01 | 0.01 | 0.97 | 0.0047 | |||
| K6-38 | 37 | 520.21 | 380 | 66 | 0.17 | -0.3 | 0.01 | 0 | 0.01 | 0.76 | 0.0009 | |||
| K6-39 | 38 | 520.13 | 312 | 46 | 0.15 | -0.4 | 0.01 | 0 | 0.02 | 1.35 | 0.0008 | |||
| K6-40 | 39 | 520.04 | 251 | 178 | 0.71 | 1.7 | 0.01 | 0 | 0 | 1.00 | 0.0009 | |||
| Reference materials | ||||||||||||||
| IAPSO seawater¬ | -0.342 | 0.022 | 5 | |||||||||||
| SRM-1d | 77 | 743 | 9.64 | -0.083 | 0.017 | 7 | 36.8 | 0.01 | 0.01 | 0.09 | ||||
| - rpt | 70 | 478 | 6.87 | -0.089 | 0.024 | 2 | 26.2 | 0 | 0 | 0 | ||||
| SRM-1d † | 5475 | 1475 | 0.27 | -0.105 | 0.017 | 7 | 1 | 0 | 0 | 0.01 | ||||
| COQ-1 † | 112 | 727 | 6.51 | -0.337 | 0.024 | 5 | 24.9 | 0.08 | 0.03 | 0.2 | ||||
| BCR-2 † | -0.274 | 0.017 | 5 | |||||||||||
| BCR-2 † | -0.255 | 0.013 | 4 | |||||||||||
| BCR-2 † | -0.24 | 0.009 | 5 | |||||||||||
*Age model based on δ13C chemostratigraphy after Maloof et al. (2010a).
Samples marked with † are whole-rock analysis, all others are mild acetic leaches (see methods for details).
¬) The processing of IAPSO seawater followed the procedure of Weyer et al. (2008).
ƒ) Uranium Enrichment factor is calculated as follows: U EFTh = (U/Th) /(U/Th)UCC, where the UCC stands for upper continental crust with a U/Th = 0.26
Table S-20 Mineralogical data for samples from the Sukharikha River section.
| Sample | Calcite | Quartz | Dolomite | Ankerite | Chlorite (Clinochlore) | Mica | K-Feldspar | Haematite | sum |
| wt. % | wt. % | wt. % | wt. % | wt. % | wt. % | wt. % | wt. % | ||
| Sukharikha River Section. Igarka River. NW Siberia | |||||||||
| A393 | 93 | 2 | 0 | 1 | 1 | 3 | 100 | ||
| A388 | |||||||||
| A384 | 88 | 4 | 0 | 1.5 | 1.75 | 4.5 | 0.25 | 92 | |
| A379 | 56 | 25.5 | 8 | 0 | 2 | 8.5 | 66 | ||
| A376 | 85 | 11 | <5 | 0.5 | 1 | 0.5 | 2.5 | 97.5 | |
| A372 | |||||||||
| A368 | 76 | 7 | 4 | 2.5 | 4 | 2 | 4.5 | 95.5 | |
| A366 | 79 | 5 | 6.5 | 1.5 | 1 | 1 | 6 | 100 | |
| A364 | 90 | 5 | 0 | 1 | 0.5 | 3.5 | 96 | ||
| A361 | 90 | 2 | 0.5 | 0.5 | 0.5 | 1 | 5.5 | 94 | |
| A358 | 71 | 4 | 9.5 | 9.5 | 6 | 3 | 7.5 | 103 | |
| Bolshaya Kuonamka. Anabar Uplift. Section 96-6 | |||||||||
| K6-24 | 88 | 4 | 1.5 | 2 | 2.5 | 2 | 97.5 | ||
| K6-27 | 85 | 4 | 4 | 2.5 | 2 | 2 | 0.5 | 97 | |
| K6-30 | 80 | 4 | 8 | 3 | 2 | 2.5 | 0.5 | 97 | |
| K6-31A | 90 | 4 | 0.5 | 1 | 2 | 1.5 | 1.5 | < 0.5 | 97.5 |
| K6-31B | 86 | 4.5 | 0.5 | 1.5 | 2 | 2.5 | 2.5 | 0.5 | 90 |
| K6-34 | 76 | 5 | 3 | 6.5 | 3 | 2.5 | 3 | 1 | 97.5 |
| K6-35 | 82 | 5.5 | 3.5 | 2 | 2.5 | 2 | 2.5 | 89.5 | |
| K6-38 | 91 | 3 | 0.5 | 0.5 | 1 | 2 | 2 | 100 | |
| K6-39 | 87 | 4.5 | 1 | 1.5 | 2 | 2 | 2 | < 0.5 | 95.5 |
| K6-40 | 84 | 2 | 0.5 | 1.5 | 1.5 | 0.5 | 86.5 | ||
Table S-21 Sulphur isotope data of carbonate associated sulphate and total organic carbon content in samples from three Siberian sections (Sukharika River (A), Bolshaya Kuonamka river (K3), and Malaya Kuonamka river (K6)). Published C and O isotope data are shown for comparison (Kouchinsky et al., 2007).
| Sample | Age assigned | TOC | δ34S | δ13C | δ18O |
| Ma | wt. % | ‰ (V-CDT) | ‰ (V-PDB) | ‰ (V-PDB) | |
| Sukharikha River Section, Krasnoporog Fm | |||||
| A350 | 521.27 | 0.04 | 30.48 | -1.48 | -6.85 |
| A358 | 521 | 0.04 | 32.58 | -1.27 | -6.9 |
| A364 | 520.8 | 0.04 | 39.53 | 0.09 | -7.24 |
| A366 | 520.73 | 0.03 | 38.27 | 0.67 | -6.6 |
| A368 | 520.66 | 0.03 | 37.41 | 1.29 | -6.58 |
| A372 | 520.53 | 0.03 | 39.37 | 1.56 | -7.12 |
| A376 | 520.39 | 0.02 | 2.63 | -6.79 | |
| A379 | 520.29 | 0.02 | 37.5 | 2.03 | -6.59 |
| A384 | 520.12 | 0.03 | 1.09 | -6.98 | |
| A388 | 519.98 | 0.03 | 35.02 | 0.07 | -6.94 |
| A393 | 519.81 | 0.02 | -0.5 | -7.15 | |
| Malaya Kuonamka River Section (K3), Emyaksin Fm | |||||
| K3-18P | 521.4 | 0.033 | 27.93 | -1.29 | -6.24 |
| K3-22P | 521.13 | 0.159 | -1.1 | -5.78 | |
| K3-26P | 520.89 | 0.025 | 27.93 | -0.72 | -5.99 |
| K3-28P | 520.77 | 0.032 | 33.27 | 0.22 | -5.96 |
| K3-30P | 520.65 | 0.028 | 36.16 | 0.97 | -5.57 |
| K3-32P | 520.53 | 0.024 | 35.2 | 1.76 | -5.62 |
| K3-35P | 520.35 | 0.026 | 39.03 | 2.43 | -5.8 |
| K3-37P | 520.23 | 0.018 | 1.72 | -5.92 | |
| K3-39 | 520.11 | 0.027 | 1.03 | -5.88 | |
| K3-41 | 519.99 | 0.131 | 0.23 | -6.32 | |
| Bol'shaya Kuonamka (K6), Emyaksin Fm | |||||
| K6-24 | 521.4 | 0.046 | -1.22 | -6.01 | |
| K6-27 | 521.15 | 0.05 | 28.03 | -1.02 | -6.26 |
| K6-30 | 520.89 | 0.097 | 28.81 | -0.54 | -6.07 |
| K6-31 | 520.81 | 0.035 | 32.35 | 0.21 | -6.18 |
| K6-32 | 520.72 | 0.062 | 0.99 | -5.91 | |
| K6-34 | 520.55 | 0.041 | 36.86 | 1.8 | -5.42 |
| K6-35 | 520.47 | 0.1 | 2.63 | -5.49 | |
| K6-38 | 520.21 | 0.024 | 1.81 | -5.65 | |
| K6-39 | 520.13 | 0.095 | 34.93 | 1.27 | -5.84 |
| K6-40 | 520.04 | 0.11 | -5.95 | ||
Table S-22 Data sources for the marine redox proxy data (Mo, U, δ98Mo and δ238U) from Late Ediacaran and Cambrian sedimentary archives (modified after Boyle et al., 2014). All Mo isotope data were corrected from in-house reference materials to the NIST SRM 3136 scale (Goldberg et al., 2013; Nägler et al., 2014).
| Formation | Locality | Biozone | Lithology | Age (max) | Age (min) | Mo | U | Mo/TOC | U/TOC | δ98Mo | δ98Mo ref ‰ offset from NIST 3136 at 0.25 ‰ | References |
| Dictyonema Shales | Sweden | Shale | 482 | √ | Quinby-Hunt et al. (1989) | |||||||
| Alum Shale | Albjära, Sweden | Cambrian Series 4 | Shale | 485 | √ | √ | √ | 0.08 | Dahl et al. (2010) | |||
| Alum Shale | Gislövhammar, Sweden | Cambrian Series 4 | Shale | 485 | √ | √ | √ | 0.08 | Dahl et al. (2010) | |||
| Alum Shale | Cambrian Series 4 | Shale | 499 | √ | √ | Lewan and Buchardt (1989) | ||||||
| Alum Shale | Cambrian Series 4 | Shale | 499 | √ | √ | Partin et al. (2013) | ||||||
| Alum Shale | Andrarum-3, Sweden | Cambrian Series 3-4 | Shale | 500 | √ | √ | √ | 0.08 | Dahl et al. (2010) | |||
| Alum Shale | Andrarum-3, Sweden | Cambrian Series 3-4 | Shale | 500 | √ | √ | √ | 0.08 | Gill et al. (2011) (except δ98Mo) | |||
| Alum Shale | Närke Area, Sweden | Shale | 505 | 499 | √ | √ | √ | Leventhal (1991) | ||||
| Burgess Shale | Canada | Cambrian Series 3 | Shale | 505 | √ | √ | √ | 0.08 | Dahl et al. (2010) | |||
| Hay River | Georgina Basin, Australia | Shale | 505 | √ | √ | Donnelly et al. (1988) | ||||||
| Niutitang | Zunyi, South China | Cambrian Stage 3 | Shale | 520 | √ | √ | Jiang et al. (2006) | |||||
| Niutitang | Zhangjiajie | Cambrian Stage 3 | Shale | 520 | 520 | √ | √ | Jiang et al. (2006) | ||||
| Niutitang | Dingtai | Cambrian Stage 3 | Shale | 521 | 517 | √ | √ | √ | Xu et al. (2012) | |||
| Niutitang | Maluhe | Cambrian Stage 3 | Shale | 521 | √ | √ | √ | Xu et al. (2012) | ||||
| Niutitang | Dazhuliushui | Cambrian Stage 3 | Shale | 521 | √ | √ | √ | Xu et al. (2012) | ||||
| Niutitang | Sancha | Cambrian Stage 3 | Shale | 521 | √ | √ | √ | Xu et al. (2012) | ||||
| Niutitang | Ganziping | Cambrian Stage 3 | Shale | 521 | 520 | √ | √ | √ | √ | Lehmann et al. (2007) | ||
| Niutitang | Yuanling | Cambrian Stage 3 | Shale | 521 | 520 | √ | √ | √ | √ | Lehmann et al. (2007) | ||
| Yuertushi | Xiaoerbulaki, Tarim Basin, NW China | Cambrian Stage 2 | Shale | 521 | √ | √ | √ | Yu et al. (2009) | ||||
| Yuertushi | Sugaitebulaki, Tarim Basin, NW China | Cambrian Stage 2 | Shale | 521 | √ | √ | Yu et al. (2009) | |||||
| Niutitang | Maluhe | Cambrian Stage 3 | Shale | 521 | √ | Lehmann et al. (2007) | ||||||
| Yu’anshan | Chengjiang, South China | Cambrian Stage 3 | Shale | 521 | √ | √ | √ | 0.08 | Dahl et al. (2010) | |||
| Niutitang | Ganziping | Cambrian Stage 3 | Shale | 521 | 520 | √ | Wille et al. (2008) | |||||
| Niutitang | Yuanling | Cambrian Stage 3 | Shale | 521 | 520 | √ | Wille et al. (2008) | |||||
| Yuanshan | Xiaotan, China | Cambrian Stage 3 | Shale | 521 | 518 | √ | √ | Och et al. (2013) | ||||
| Yuanshan | Dapotuo, China | Cambrian Stage 3 | Shale | 521 | 518 | √ | √ | Och et al. (2013) | ||||
| Niutitang | Zhongnan, China | Cambrian Stage 3 | Shale | 521 | 520 | √ | √ | Och et al. (2013) | ||||
| Niutitang | Dazhuliushui | Cambrian Stage 3 | Shale | 521 | √ | √ | Och et al. (2013) | |||||
| Niutitang | Maluhe | Cambrian Stage 3 | Shale | 521 | √ | √ | Och et al. (2013) | |||||
| Niutitang | Cili | Cambrian Stage 3 | Shale | 521 | √ | √ | Och et al. (2013) | |||||
| Guojiaba | Songtao section, South China | Cambrian Stage 2-3 | Shale | 524 | 508 | √ | √ | √ | √ | Guo et al. (2007) | ||
| Jiumenchong | Songtao section, South China | Cambrian Stage 2-3 | Shale | 524 | 520 | √ | √ | √ | √ | Guo et al. (2007) | ||
| Shiyantou | Meischucun, China | Cambrian Stage 2 | Shale | 524 | 522 | √ | √ | Och et al. (2013) | ||||
| Shiyantou | Dapotuo, China | Cambrian Stage 2 | Shale | 524 | 522 | √ | √ | Och et al. (2013) | ||||
| Shiyantou | Xiaotan, China | Cambrian Stage 2 | Shale | 529 | 521 | √ | √ | Och et al. (2013) | ||||
| Shiyantou | Meischucun, SYT | Cambrian Stage 2 | Shale | 529 | 521 | √ | √ | √ | Wen et al. (2011) | |||
| Hetang | Cambrian Stage 3 | Shale | 531 | √ | Zhou and Jiang (2009) | |||||||
| Ara Group | ALNR-1, Oman | Ediacaran-Cambrian | Shale | 540 | √ | √ | Wille et al. (2008) | |||||
| Ara Group | MM NW-1, Oman | Ediacaran-Cambrian | Shale | 540 | √ | √ | Wille et al. (2008) | |||||
| Ara Group | MM NW-1, Oman | Ediacaran-Cambrian | Shale | 542 | √ | Schröder and Grotzinger (2007) | ||||||
| Dengying | Ediacaran Series 2 | Shale | 545 | √ | Partin et al. (2013) | |||||||
| Dengying | Ediacaran Series 2 | Shale | 545 | √ | √ | Guo et al. (2007) | ||||||
| Liuchapo | Ediacaran Series 2 | Shale | 545 | √ | √ | Guo et al. (2007) | ||||||
| Dengying | Songtao section, South China | Shale | 545 | √ | Guo et al. (2007) | |||||||
| Nama Group | Namibia | Ediacaran Series 2 | Shale | 548 | √ | McLennan et al. (1983) | ||||||
| Doushantuo | Songtao section,South China | Shale | 551 | √ | Partin et al. (2013) | |||||||
| Doushantuo | Songtao section,South China | Shale | 551 | √ | Guo et al. (2007) | |||||||
| Isaac | Castle Creek + Cariboo Mountains, Windermere, Canada | Shale | 565 | √ | 0.08 | Dahl et al. (2010) | ||||||
| Drook | New Foundland, Canada | Shale | 565 | √ | √ | √ | 0.08 | Dahl et al. (2010) | ||||
| Doushantuo, Cycle 3 | Jiulongwan, Zhongling, Minle, Longe Nanhua Basin, South China | Shale | 565 | 555 | √ | √ | Li et al. (2010) | |||||
| Gaskiers | New Foundland, Canada | Shale | 580 | √ | √ | √ | 0.08 | Dahl et al. (2010) | ||||
| Upper Kaza | Windermere, Canada | Shale | 580 | √ | √ | √ | 0.08 | Dahl et al. (2010) |